. 2018 Feb 26:9:363.
doi: 10.3389/fimmu.2018.00363. eCollection 2018.

NLRX1 Modulates Immunometabolic Mechanisms Controlling the Host-Gut Microbiota Interactions during Inflammatory Bowel Disease

Affiliations

NLRX1 Modulates Immunometabolic Mechanisms Controlling the Host-Gut Microbiota Interactions during Inflammatory Bowel Disease

Andrew Leber et al. Front Immunol. .

Abstract

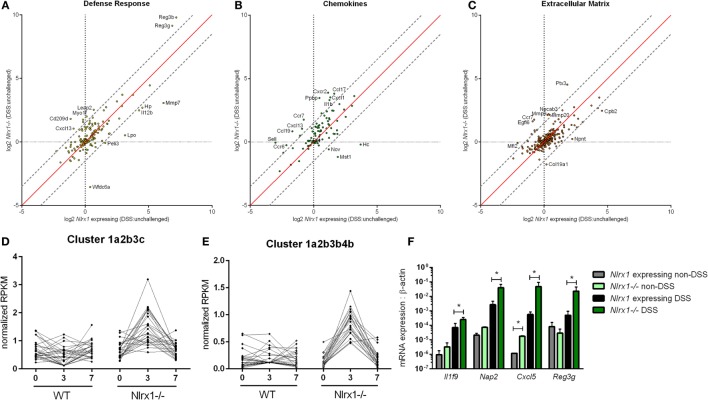
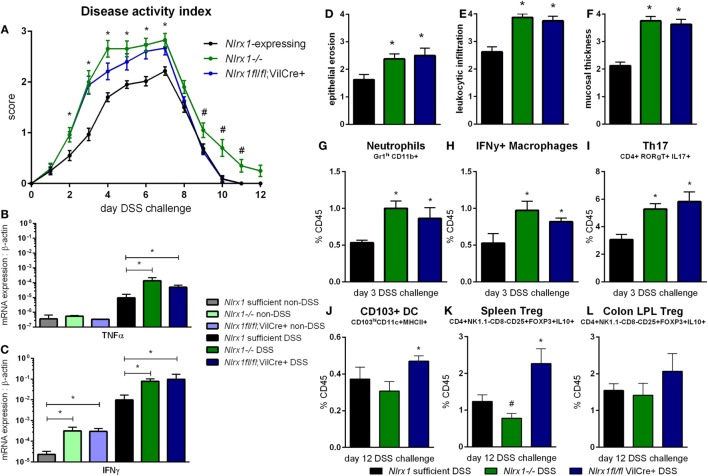
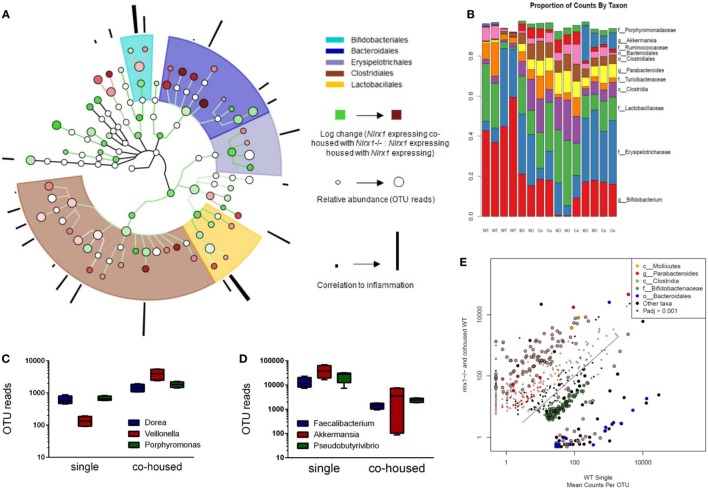
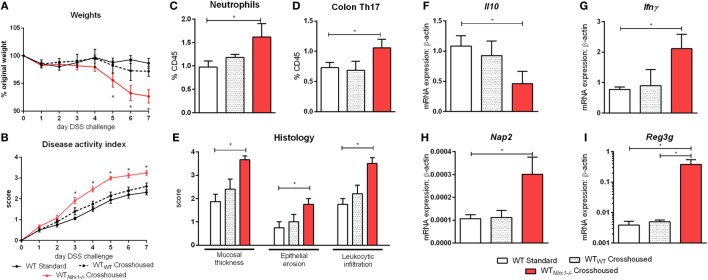
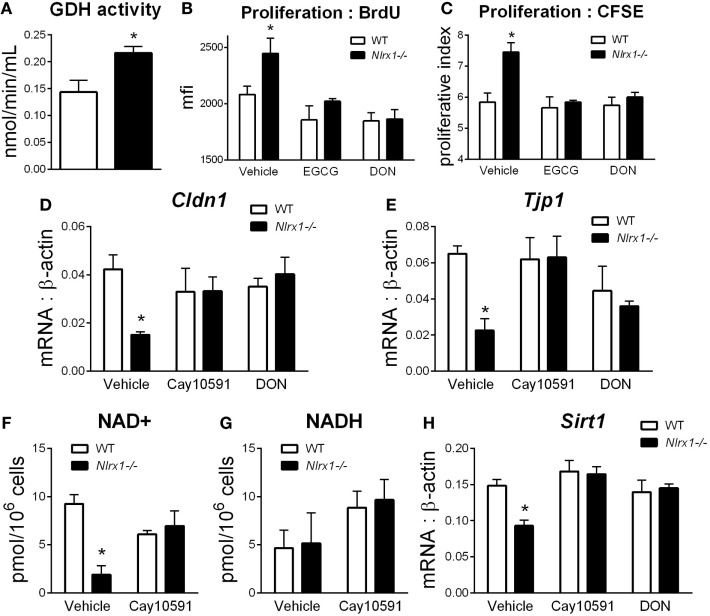
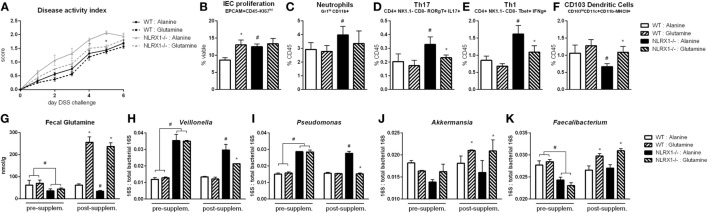
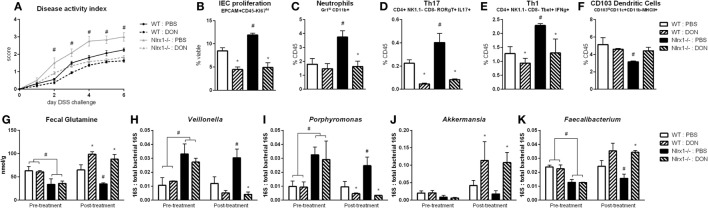
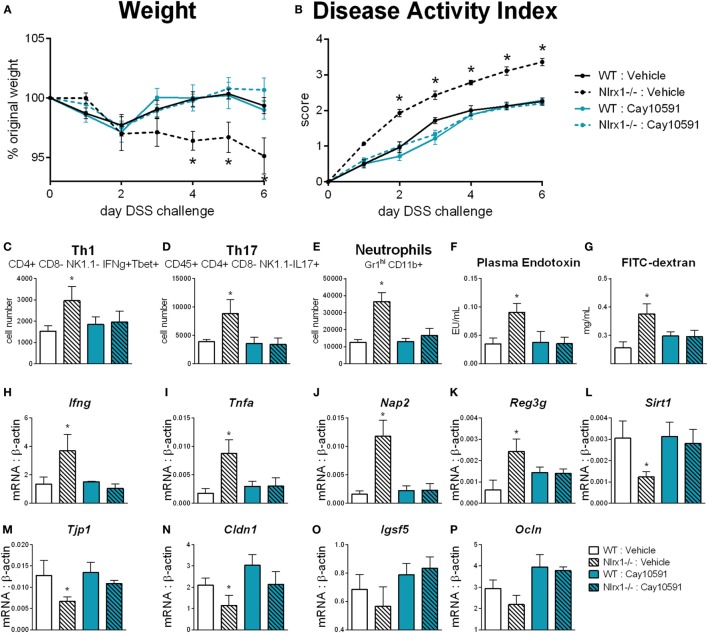
Interactions among the gut microbiome, dysregulated immune responses, and genetic factors contribute to the pathogenesis of inflammatory bowel disease (IBD). Nlrx1-/- mice have exacerbated disease severity, colonic lesions, and increased inflammatory markers. Global transcriptomic analyses demonstrate enhanced mucosal antimicrobial defense response, chemokine and cytokine expression, and epithelial cell metabolism in colitic Nlrx1-/- mice compared to wild-type (WT) mice. Cell-specificity studies using cre-lox mice demonstrate that the loss of NLRX1 in intestinal epithelial cells (IEC) recapitulate the increased sensitivity to DSS colitis observed in whole body Nlrx1-/- mice. Further, organoid cultures of Nlrx1-/- and WT epithelial cells confirm the altered patterns of proliferation, amino acid metabolism, and tight junction expression. These differences in IEC behavior can impact the composition of the microbiome. Microbiome analyses demonstrate that colitogenic bacterial taxa such as Veillonella and Clostridiales are increased in abundance in Nlrx1-/- mice and in WT mice co-housed with Nlrx1-/- mice. The transfer of an Nlrx1-/--associated gut microbiome through co-housing worsens disease in WT mice confirming the contributions of the microbiome to the Nlrx1-/- phenotype. To validate NLRX1 effects on IEC metabolism mediate gut-microbiome interactions, restoration of WT glutamine metabolic profiles through either exogenous glutamine supplementation or administration of 6-diazo-5-oxo-l-norleucine abrogates differences in inflammation, microbiome, and overall disease severity in Nlrx1-/- mice. The influence NLRX1 deficiency on SIRT1-mediated effects is identified to be an upstream controller of the Nlrx1-/- phenotype in intestinal epithelial cell function and metabolism. The altered IEC function and metabolisms leads to changes in barrier permeability and microbiome interactions, in turn, promoting greater translocation and inflammation and resulting in an increased disease severity. In conclusion, NLRX1 is an immunoregulatory molecule and a candidate modulator of the interplay between mucosal inflammation, metabolism, and the gut microbiome during IBD.

Keywords: NLRX1; gut microbiome; immunometabolism; inflammatory bowel disease; intestinal epithelial cells; mucosal immunology.


Figures

Figure 1
Figure 1
RNA-seq analysis of colons from unchallenged and DSS-challenged Nlrx1 expressing and Nlrx1−/− mice indicates differences in gene expression. The log2 changes between DSS-challenged and unchallenged samples were calculated and plotted for each genotype within functional families of genes (A–C). Each point within the graph represents an individual gene. Points falling near the red identity line in each plot correspond to those that have similar response patterns in Nlrx1-expressing and Nlrx1−/− animals. The gray dotted lines follow a 1.5 log2 difference from the identity line. Genes outside of the gray lines were considered to have different behavior between genotypes. Clusters enriched in proliferation (D) and metabolic (E) functions following hierarchical clustering for temporal patterns within RNA-seq dataset. Quantitative real-time PCR validation of cytokine, chemokine, and antimicrobial peptide expression normalized to beta-actin (F). Asterisks (*) mark significance (p ≤ 0.05) in comparison between treatments of the same genotype (n = 8), experiment in triplicate. Number signs (#) mark significance (p ≤ 0.05) between Nlrx1−/− and Nlrx1-expressing only (n = 8), experiment in triplicate.
Figure 2
Figure 2
Epithelial cell NLRX1 knockout mice recapitulate the phenotype of whole body NLRX1−/−. Nlrx1-expressing, Nlrx1−/− and Nlrx1fl/fl; VillinCre+ mice were challenged with DSS. Increases in disease activity index were observed both with Nlrx1−/− and Nlrx1fl/fl; VillinCre+ mice compared to Nlrx1-expressing (A). Nlrx1−/− and Nlrx1fl/fl; VillinCre+ animals possess significantly higher mRNA expression of TNFα (B) and IFNγ (C) at day 7 of DSS challenge compared to Nlrx1-expressing. Sections of colonic tissue were obtained and histologically graded on a scale of 0–4 at day 7 of DSS challenge. Significant increases in epithelial erosion (D), leukocytic infiltration (E), and mucosal thickness (F) were observed in Nlrx1−/− and Nlrx1fl/fl; VillinCre+ mice compared to Nlrx1-expressing colonic neutrophils (G), IFNγ-producing macrophages (H), and Th17 cells (I), as percentage of CD45+ cells, on day 3 of DSS challenge. Flow cytometry analysis of colonic CD103+ DC (J), splenic Treg (K) and colonic Treg (L) as percentages of CD45+ cells on day 12 of DSS challenge Asterisks (*) mark significance (p ≤ 0.05) in comparison between genotypes of the same treatment (n = 8). Number signs (#) mark significance (p ≤ 0.05) between Nlrx1−/− and Nlrx1-expressing only (n = 8).
Figure 3
Figure 3
The loss of NLRX1 results in transferrable changes in the gut microbiota composition. Nlrx1-expressing mice were housed only with wild-type mice (single) or co-housed with Nlrx1−/− mice (co-housed) (n = 4). After this period, colonic contents were collected for 16S rRNA-based sequencing. Observed taxa were compiled into a phylogenetic map using the Python-based program, Graphlan (A). Microbiota composition was comprised largely of five main order Clostridiales, Bacteroidales, Lactobacillales, Erysipelotrichales, and Bifidobacteria indicated by the shaded ring sections. The relative operational taxonomic units (OTUs) in co-housed compared to single are indicated by the interior color of each taxon marker on a scale from green (taxon lower in co-housed) to red (taxon higher in co-housed). The size of each marker is dependent on the number of reads observed. On the outer ring, the correlation to inflammation based on a search algorithm for genera and species are marked in a bar graph style. A stacked bar graph for individual samples displays changes between single and co-housed samples and the high degree of agreement between co-housed Nlrx1-expressing and their Nlrx1−/− counterparts (B). Boxplots of increased (C) and decreased (D) taxa following co-housing. Scatterplot of main taxa displaying altered abundance of Clostridia and Bacteroidales orders between Nlrx1−/− and Nlrx1-expressing samples (E).
Figure 4
Figure 4
Nlrx1−/− microbiome transfer worsens colitis in NLRX1-expressing mice. Wild-type mice were given antibiotics then co-housed with non-antibiotic administered mice. Weight change (A) and disease activity index (B) of non-antibiotic administered mice wild-type mice (WT Standard), antibiotic administered WT mice housed with non-antibiotic WT mice (WTWT), and antibiotic administered WT mice housed with non-antibiotic Nlrx1−/− mice (WTNlrx1−/−) following cohousing. Colonic neutrophil (C) and Th17 (D) responses on day 7 of DSS challenge. Colonic histological scores (E) for mucosal thickness, epithelial erosion, and leukocytic infiltration criteria on day 7 of DSS challenge. Expression of Il10 (F), Ifnγ (G), Nap2 (H), and Reg3g (I) mRNA by qRT-PCR assay of colon samples on day 7 of DSS challenge. Asterisks (*) mark significance (p ≤ 0.05) in comparison between treatments within genotypes (n = 6).
Figure 5
Figure 5
Characterization of NLRX1 deficiency in the metabolic and expression profiles of intestinal organoids. Glutamate dehydrogenase activity by colorimetric assay of organoid homogenate (A). Proliferation of intestinal organoids by BrdU (B) and CFSE (C) staining. Expression of Cldn1 (D) and Tjp1 (E) after 24 h of LPS stimulation normalized to beta-actin. Concentration of NAD+ (F) and NADH (G) by colorimetric assay. Expression of Sirt1 (H) after 24 h of LPS stimulation normalized to beta-actin. Asterisks (*) mark significance (p ≤ 0.05) in comparison between genotypes. Data are a result of three independent experiments, each containing four replicates.
Figure 6
Figure 6
Glutamine supplementation abrogates Nlrx1−/− associated microbiome. Mice were given daily l-glutamine or alanine by oral gavage prior to DSS. Nlrx1−/− mice given l-glutamine displayed lower disease activity scores (A). Flow cytometry assessment of intestinal epithelial cell (IEC) proliferation (B), neutrophils (C), Th17 (D), Th1 (E), and CD103+ dendritic cells (F) on day 7 of DSS challenge. Fecal glutamine concentration pre- and post-supplementation by colorimetric assay (G). 16S abundance of Veillonella (H), Porphyromonas (I), Akkermansia (J), and Faecalibacterium (K) by qRT-PCR normalized to total 16S abundance. Asterisks (*) mark significance (p ≤ 0.05) in comparison between treatments of the same genotype (n = 8). Number signs (#) mark significance (p ≤ 0.05) between Nlrx1−/− and Nlrx1-expressing only (n = 8).
Figure 7
Figure 7
Host amino acid metabolism inhibition abrogates Nlrx1−/− associated microbiome. Mice were given 6-diazo-5-oxo-l-norleucine (DON) or PBS by intraperitoneal injection every 3 days starting prior to DSS. Nlrx1−/− mice given DON displayed lower disease activity scores (A). Flow cytometry assessment of intestinal epithelial cell (IEC) proliferation (B), neutrophils (C), Th17 (D), Th1 (E), and CD103+ dendritic cells (F) on day 7 of DSS challenge. Fecal glutamine concentration pre- and post-supplementation by colorimetric assay (G). 16S abundance of Veillonella (H), porphyromonas (I), Akkermansia (J), and Faecalibacterium (K) by qRT-PCR normalized to total 16S abundance. Asterisks (*) mark significance (p ≤ 0.05) in comparison between treatments of the same genotype (n = 8). Number signs (#) mark significance (p ≤ 0.05) between Nlrx1−/− and Nlrx1-expressing only (n = 8).
Figure 8
Figure 8
Rescue of SIRT1 activity abrogates differences caused by NLRX1 deficiency. WT and Nlrx1−/− mice were administered the SIRT1 activator, Cay10591, on days 1, 3, and 6 of DSS challenge by intraperitoneal injection. Weight (A) and disease activity index (B) throughout course of DSS challenge. Cell number of Th1 (C), Th17 (D), and neutrophils (E) within the colonic lamina propria on day 7 of DSS challenge. Plasma endotoxin (F) and FITC-dextran (G) concentration within heparinized plasma collected 4 h post-FITC-dextran administration by oral gavage. RNA expression of Ifng (H), Tnfa (I), Nap2 (J), Reg3g (K), Sirt1 (L), Tjp1 (M), Cldn1 (N), Igsf5 (O), Ocln (P) within whole colon normalized to beta-actin. Asterisks (*) mark significance (p ≤ 0.05) in comparison between genotypes (n = 9).

Similar articles

Cited by

References

    1. Proell M, Riedl SJ, Fritz JH, Rojas AM, Schwarzenbacher R. The Nod-like receptor (NLR) family: a tale of similarities and differences. PLoS One (2008) 3(4):e2119. 10.1371/journal.pone.0002119 - DOI - PMC - PubMed
    1. Saxena M, Yeretssian G. NOD-like receptors: master regulators of inflammation and cancer. Front Immunol (2014) 5:327. 10.3389/fimmu.2014.00327 - DOI - PMC - PubMed
    1. Hugot JP, Chamaillard M, Zouali H, Lesage S, Cézard JP, Belaiche J, et al. Association of NOD2 leucine-rich repeat variants with susceptibility to Crohn’s disease. Nature (2001) 411(6837):599–603. 10.1038/35079107 - DOI - PubMed
    1. Davis BK, Philipson C, Hontecillas R, Eden K, Bassaganya-Riera J, Allen IC. Emerging significance of NLRs in inflammatory bowel disease. Inflamm Bowel Dis (2014) 20(12):2412–32. 10.1097/MIB.0000000000000151 - DOI - PMC - PubMed
    1. Allen IC, Wilson JE, Schneider M, Lich JD, Roberts RA, Arthur JC, et al. NLRP12 suppresses colon inflammation and tumorigenesis through the negative regulation of noncanonical NF-kappaB signaling. Immunity (2012) 36(5):742–54. 10.1016/j.immuni.2012.03.012 - DOI - PMC - PubMed

MeSH terms