. 2018 Feb 26:9:364.
doi: 10.3389/fimmu.2018.00364. eCollection 2018.

The MEK1/2-ERK Pathway Inhibits Type I IFN Production in Plasmacytoid Dendritic Cells

Affiliations

The MEK1/2-ERK Pathway Inhibits Type I IFN Production in Plasmacytoid Dendritic Cells

Vaclav Janovec et al. Front Immunol. .

Abstract

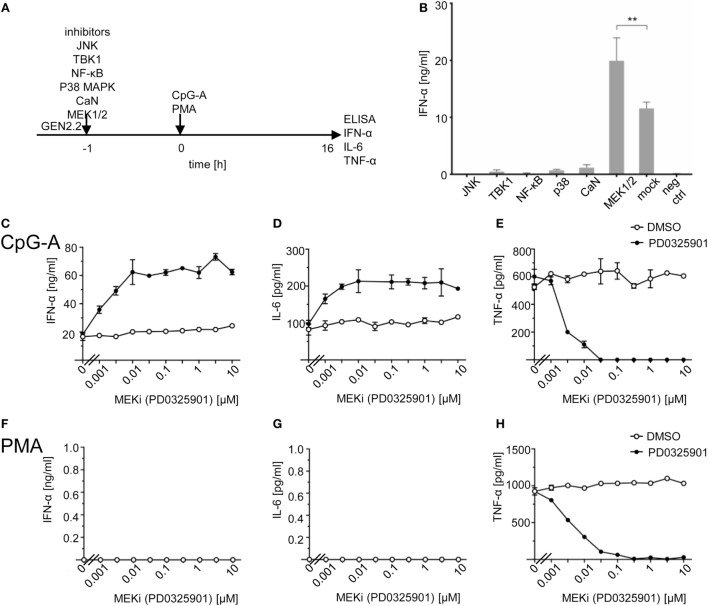
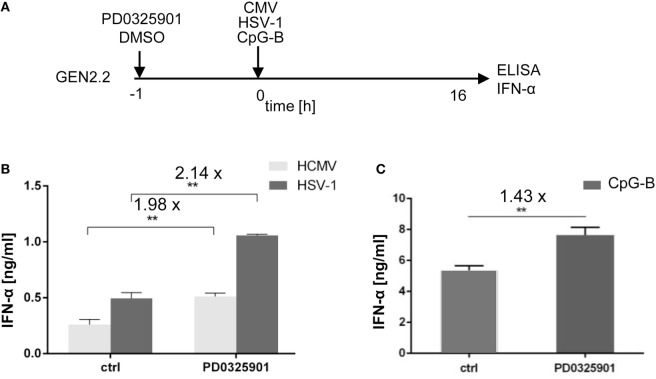
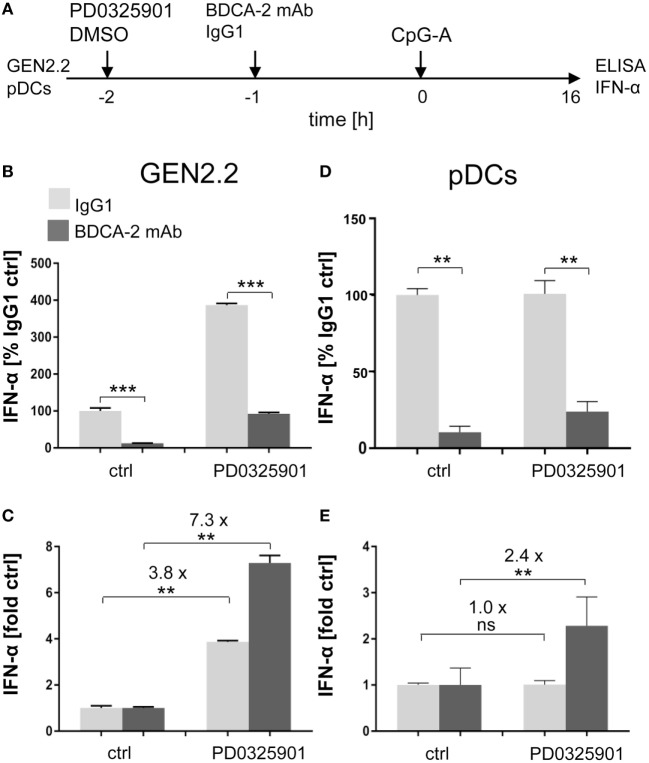
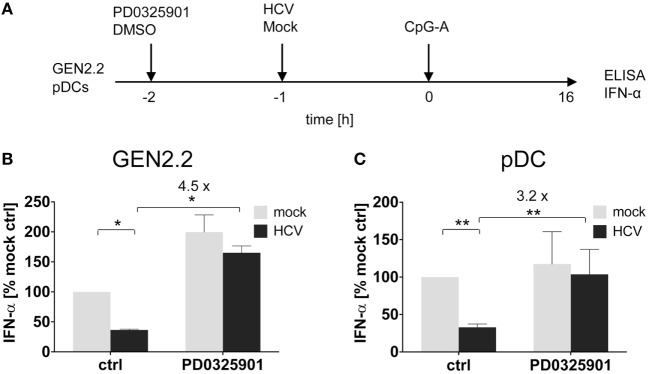
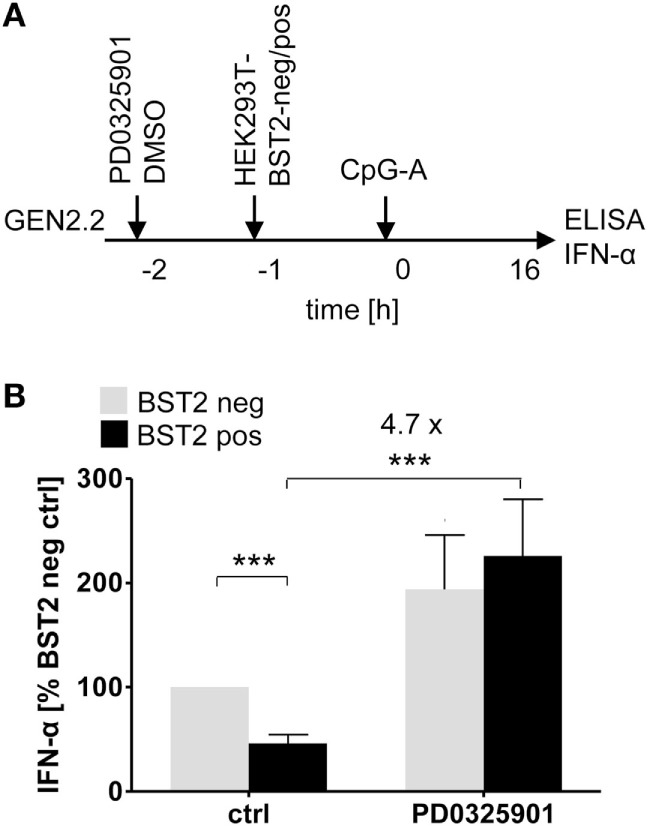
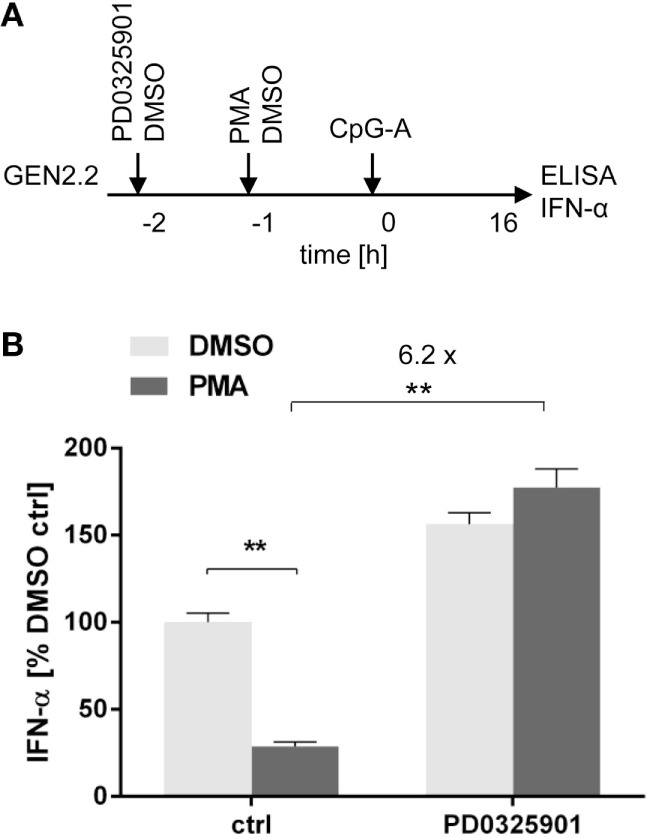
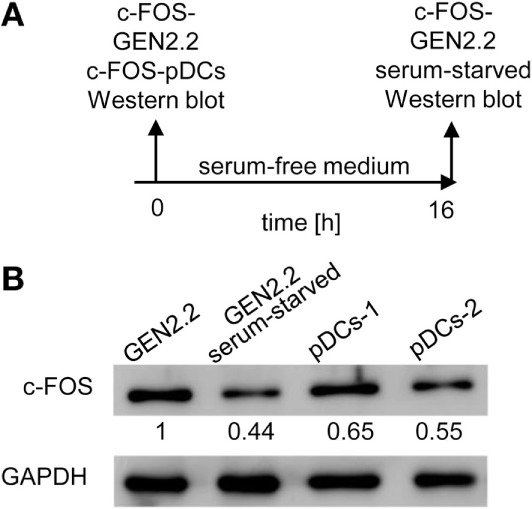
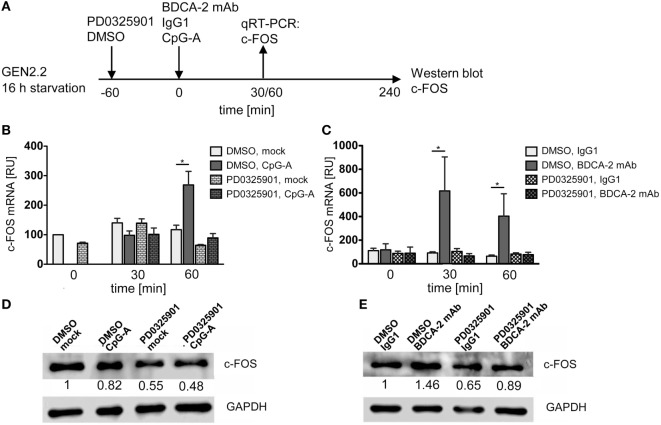
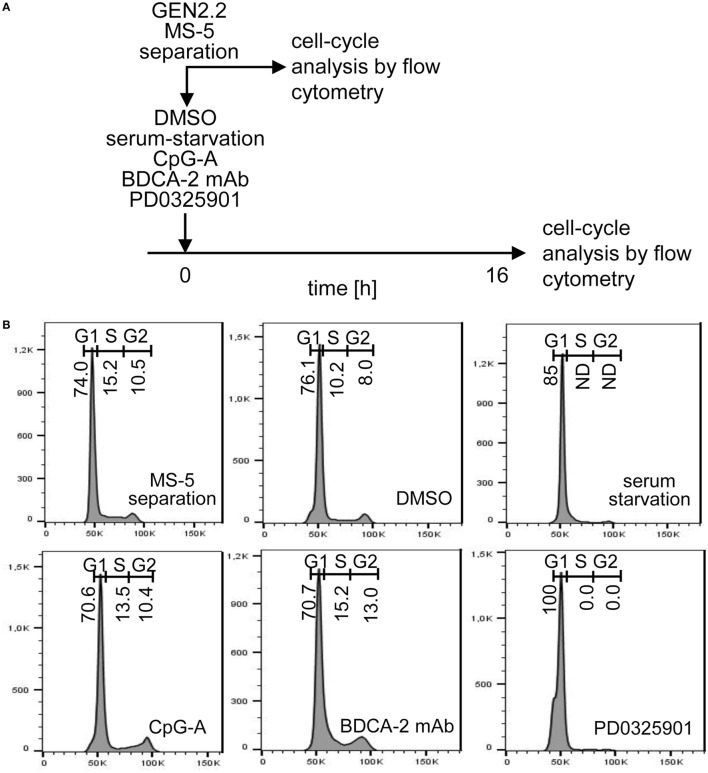
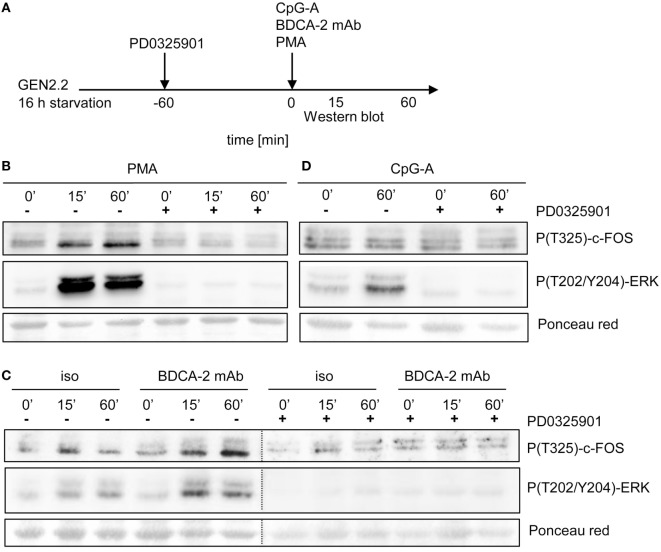
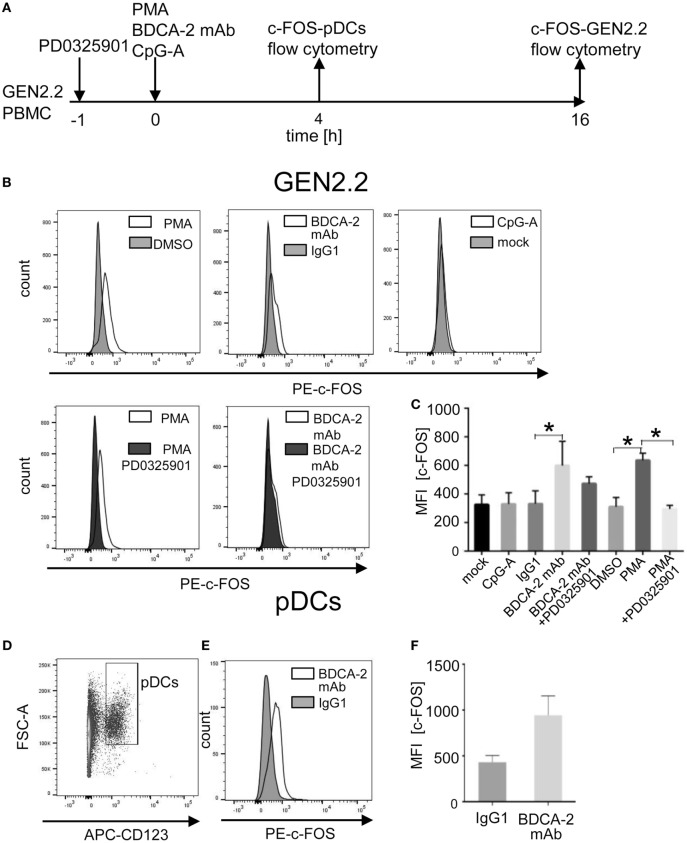
Recent studies have reported that the crosslinking of regulatory receptors (RRs), such as blood dendritic cell antigen 2 (BDCA-2) (CD303) or ILT7 (CD85g), of plasmacytoid dendritic cells (pDCs) efficiently suppresses the production of type I interferons (IFN-I, α/β/ω) and other cytokines in response to toll-like receptor 7 and 9 (TLR7/9) ligands. The exact mechanism of how this B cell receptor (BCR)-like signaling blocks TLR7/9-mediated IFN-I production is unknown. Here, we stimulated BCR-like signaling by ligation of RRs with BDCA-2 and ILT7 mAbs, hepatitis C virus particles, or BST2 expressing cells. We compared BCR-like signaling in proliferating pDC cell line GEN2.2 and in primary pDCs from healthy donors, and addressed the question of whether pharmacological targeting of BCR-like signaling can antagonize RR-induced pDC inhibition. To this end, we tested the TLR9-mediated production of IFN-I and proinflammatory cytokines in pDCs exposed to a panel of inhibitors of signaling molecules involved in BCR-like, MAPK, NF-ĸB, and calcium signaling pathways. We found that MEK1/2 inhibitors, PD0325901 and U0126 potentiated TLR9-mediated production of IFN-I in GEN2.2 cells. More importantly, MEK1/2 inhibitors significantly increased the TLR9-mediated IFN-I production blocked in both GEN2.2 cells and primary pDCs upon stimulation of BCR-like or phorbol 12-myristate 13-acetate-induced protein kinase C (PKC) signaling. Triggering of BCR-like and PKC signaling in pDCs resulted in an upregulation of the expression and phoshorylation of c-FOS, a downstream gene product of the MEK1/2-ERK pathway. We found that the total level of c-FOS was higher in proliferating GEN2.2 cells than in the resting primary pDCs. The PD0325901-facilitated restoration of the TLR9-mediated IFN-I production correlated with the abrogation of MEK1/2-ERK-c-FOS signaling. These results indicate that the MEK1/2-ERK pathway inhibits TLR9-mediated type I IFN production in pDCs and that pharmacological targeting of MEK1/2-ERK signaling could be a strategy to overcome immunotolerance of pDCs and re-establish their immunogenic activity.

Keywords: B cell-like receptor signaling; MEK1/2; blood dendritic cell antigen 2; c-FOS; plasmacytoid dendritic cells; regulatory receptors; toll-like receptors 7 and 9 (TLR7/9); type I interferon.


Figures

Figure 1
Figure 1
Effect of MEK1/2 inhibitor PD0325901 on cytokine production in CpG-A and phorbol myristoyl acetate (PMA)-stimulated GEN2.2 cells. (A) Experimental outline. GEN2.2 cells separated from MS-5 feeder cells were exposed or not to inhibitors of Jun N-terminal kinase (JNK), TANK binding kinase 1 (TBK1), NF-ĸB, p38 MAPK, calcineurin, or MEK1/2 for 1 h and then stimulated with CpG-A at 4 µg/ml. The concentration of IFN-α, IL-6, and tumor necrosis factor α (TNF-α) in the cell-free supernatant was determined by ELISA after a 16 h treatment. (B) The production of IFN-α by GEN2.2 cells stimulated with CpG-A in the presence of JNK (SP600125, 10 µM), TBK1 (BX795, 1 µM), NF-ĸB (Bay11-7082, 1 µM), p38 MAPK (SB253080, 1 µM), calcineurin (FK506, 0.1 µM), or MEK1/2 (PD0325901, 1 µM) inhibitors. The PD0325901 concentration-dependent production of IFN-α (C,F), IL-6 (D,G), and TNF-α (E,H) in CpG-A-induced (C–E) or PMA-induced (F–H) GEN2.2 cells. The data show mean and SEM of two independent experiments in biological triplicates (B–H). **, p < 0.01; two-tailed Mann–Whitney test.
Figure 2
Figure 2
Effect of MEK1/2 inhibitor PD0325901 on the potentiation of IFN-α production stimulated with HSV-1, human cytomegalovirus (HCMV), or CpG-B. (A) Experimental outline. GEN2.2 cells separated from MS-5 feeder cells were incubated with the MEK1/2 inhibitor PD0325901 (1 µM) for 1 h before stimulation with HSV-1 or HCMV at the MOI of 10 TCID50 per cell, or with 4 µg/ml CpG-B. After a 16 h culture, the IFN-α production was determined in the cell-free supernatants by ELISA. N = 3, **, p < 0.01; two-tailed Student’s t-test. (B) The production of IFN-α by GEN2.2 cells stimulated with HSV-1 or HCMV in the presence or absence of PD0325901. (C) The production of IFN-α by GEN2.2 cells stimulated with CpG-B in the presence or absence of PD0325901. The data show mean and SEM of three independent experiments. N = 7, **, p < 0.01; two-tailed Mann–Whitney test.
Figure 3
Figure 3
Effect of MEK1/2 inhibitor PD0325901 on the blockade of IFN-α production by ligation of regulatory receptors of GEN2.2 cells or primary plasmacytoid dendritic cells (pDCs) with blood dendritic cell antigen 2 (BDCA-2) mAb. (A) Experimental outline. GEN2.2 cells separated from MS-5 feeder cells or primary pDCs were incubated with the MEK1/2 inhibitor for 1 h before stimulation with BDCA-2 mAb and CpG-A. After a 16 h culture, the IFN-α production was determined in the cell-free supernatants by ELISA. (B,D) The IFN-α production was normalized to the level induced by CpG-A in the presence of IgG1 and in the absence of the MEK1/2 inhibitor. (C,E) The same data showing the IFN-α production in panels (B–D) were normalized to the level induced by CpG-A in the absence of the MEK1/2 inhibitor. The data show mean ± SEM of (B,C) six independent experiments with GEN2.2 cells, **, p < 0.01; ***, p < 0.001; two-tailed Mann–Whitney test, and (D,E) nine independent experiments with primary pDCs from different healthy donors, **, p < 0.01; two-tailed paired Wilcoxon test.
Figure 4
Figure 4
Effect of MEK1/2 inhibition on the hepatitis C virus (HCV) blockade of IFN-α in GEN2.2 cells or primary plasmacytoid dendritic cells (pDCs). (A) Experimental outline. GEN2.2 cells separated from MS-5 feeder cells (B), or primary pDCs (C), were incubated with 1 µM MEK1/2 inhibitor PD0325901 for 1 h and then treated with HCV virions at MOI = 10 geq/cell for 1 h before CpG-A stimulation. After a 16 h culture, the IFN-α production was determined in the cell-free supernatants by ELISA. (B,C) The IFN-α production was normalized to the level induced by CpG-A in the presence of a mock-infected control and in the absence of PD0325901. The data show mean ± SEM of (B) two independent experiments with GEN2.2 cells, *, p < 0.05; unpaired, two-tailed t-test and (C) ten independent experiments with primary pDCs from different healthy donors, **, p < 0.01; two-tailed paired Wilcoxon test.
Figure 5
Figure 5
Effect of MEK1/2 inhibition on the blockade of IFN-α by co-culture of GEN2.2 cells with BST2-expressing HEK293T cells. (A) Experimental outline. In total 105 GEN2.2 cells pretreated with 1 µM PD0325901 were added to a monolayer of 105 control HEK293T cells or to the same amount of BST2-expressing HEK293T cells in a volume of 200 µl. The proportion of BST2-expressing cells in the lentivirus-transduced HEK293T cells was determined by flow cytometry using the anti-BST2-PE antibody (Figure S4 in Supplementary Material). The co-cultures of GEN2.2 and HEK293T cells were kept for 1 h at 37°C before adding CpG-A. After a 16 h culture, the IFN-α production was determined in the cell-free supernatants by ELISA. (B) The IFN-α production was normalized to the IFN-α level induced in GEN2.2 cells by CpG-A in co-culture with the mock-transduced BST2-negative HEK293T cells and in the absence of PD0325901. The data show mean ± SEM of five independent co-culture experiments of GEN2.2 cells with BST2-negative or BST2-positive HEK293 cells, *, p < 0.05; ***, p < 0.001; two-tailed Mann–Whitney test.
Figure 6
Figure 6
Effect of MEK1/2 inhibitor PD0325901 on the blockade of IFN-α production in phorbol myristoyl acetate (PMA)-stimulated GEN2.2 cells. (A) Experimental outline. GEN2.2 cells separated from MS-5 feeder cells were incubated with the MEK1/2 inhibitor for 1 h before stimulation with PMA. After a 16 h culture, the IFN-α production was determined in the cell-free supernatants by ELISA. (B) The IFN-α production was normalized to the level induced by CpG-A in the presence of DMSO and in the absence of the MEK1/2 inhibitor. The data show mean ± SEM of six independent experiments with GEN2.2 cells. **, p < 0.01; two-tailed Mann–Whitney test.
Figure 7
Figure 7
c-FOS in proliferating GEN2.2 cells, GEN2.2 cells starved in the serum-free medium and in primary plasmacytoid dendritic cells (pDCs). (A) Experimental outline. Total cell extracts were prepared from GEN2.2 cells immediately after their separation from MS-5 feeder cells (GEN2.2), GEN2.2 cells separated from MS-5 feeder cells and starved overnight in the serum-free medium (GEN2.2 serum-starved), and from primary pDCs isolated from two healthy donors by magnetic-bead purification without any further culture (pDCs-1, pDCs-2). (B) c-FOS levels were determined in the total cell extract by Western blotting by rabbit polyclonal Ab c-FOS (sc-52). The values shown below each band represent relative quantity of c-FOS determined by densitometry normalized to proliferating GEN2.2 cells. GAPDH was used as a loading control.
Figure 8
Figure 8
c-FOS mRNA and protein expression in GEN2.2 stimulated with TLR9 or RR agonists. (A) Experimental outline. GEN2.2 cells separated from MS-5 feeder cells and starved in a serum-free medium for 16 h were pretreated or not with MEK1/2 inhibitor PD0325901 for 1 h and then exposed to CpG-A (B,D) or blood dendritic cell antigen 2 (BDCA-2) mAb (C,E). (B,C) The expression of human c-FOS mRNA was quantified after 30 or 60-min exposure to CpG-A (B) or BDCA-2 mAb (C) by TaqMan qRT-PCR in the total cellular RNA. The data normalized to time zero show mean ± SEM of three independent experiments; *, p < 0.05; two-tailed Mann–Whitney test. (D,E) c-FOS protein levels were determined after 240 min exposure to CpG-A (D) or BDCA-2 mAb (E) in the total cell extract by Western blotting by rabbit polyclonal Ab c-FOS (sc-52). Relative quantity of c-FOS protein normalized to mock-treated GEN2.2 cells determined by densitometry is shown below each band. GAPDH was used as a loading control (representative result of three independent experiments).
Figure 9
Figure 9
Cell cycle analysis of GEN2.2 cells cultured in the presence of PD0325901, CpG-A, blood dendritic cell antigen 2 (BDCA-2) mAb, or in serum-free medium. (A) Experimental outline. GEN2.2 cells separated from MS-5 feeder cells were exposed for 16 hr to 1 µM PD0325901, 4 µg/ml CpG-A, 0.25 µg/ml BDCA-2 mAb, or DMSO (mock-treated control), or analyzed immediately after separation from MS-5 cells. (B) Cell cycle analysis using Hoechst 33342 stain. Histograms of live GEN2.2 cells (representative result of three independent experiments) stained with Hoechst 33342 dye showing DNA content distribution. Live/Dead cell discrimination was performed by Zombie Green™ Fixable Viability Kit. ND, not determined.
Figure 10
Figure 10
Activation of c-FOS and ERK in GEN2.2 cells stimulated with phorbol myristoyl acetate (PMA), blood dendritic cell antigen 2 (BDCA-2) mAb and CpG-A. (A) Experimental outline. GEN2.2 cells separated from MS-5 feeder cells and starved in a serum-free medium for 16 h were pretreated or not with MEK1/2 inhibitor PD0325901 for 1 h and then stimulated with PMA (B), BDCA-2 mAb (C), or CpG-A (D). The activation of c-FOS was evaluated by analysis of c-FOS phosphorylation using Western blotting with the P(T325)-c-FOS antibody. The phosphorylation of ERK-1 was determined by P(T202/Y204) ERK-1. Ponceau red was used as a loading control. Figure (C) is composed of two images of two different gels with samples from the same experiment. The two images are separated by a dotted line. Full scans of the original gels are shown in Figure S7 in Supplementary Material.
Figure 11
Figure 11
Induction of total c-FOS in GEN2.2 cells and primary plasmacytoid dendritic cells (pDCs). (A) Experimental outline. GEN2.2 cells separated from MS-5 feeder cells exposed or not to PD0325901 were stimulated with phorbol myristoyl acetate (PMA), blood dendritic cell antigen 2 (BDCA-2) mAb, or CpG-A for 16 h. Peripheral blood mononuclear cells (PBMCs) of healthy donors were exposed to BDCA-2 mAb or IgG1 isotype Ab and quantity of the total c-FOS in pDCs gated from PBMCs was determined 4 h later. (B) Fluorescence intensity of the total c-FOS in GEN2.2 cells. Viable GEN2.2 cells were gated according to Live/Dead Zombie Green kit, semipermeabilized and stained with PE-conjugated c-FOS (9F6) rabbit mAb. Control light shaded areas show c-FOS in unstimulated PD0325901 mock-treated GEN2.2 cells. Dark shaded areas show c-FOS in PD0325901-treated GEN2.2 cells. Representative result of three independent experiments. (C) The data show mean MFI ± SEM of the total c-FOS in GEN2.2 cells determined in three independent experiments. *, p < 0.05; unpaired, two-tailed t-test. (D) Primary pDCs in PBMCs were gated negatively for Zombie green- (living cells) and FITC-Lin and positively for APC-CD123+. (E) c-FOS in semipermeabilized primary pDCs gated from PBMCs stimulated with BDCA-2 mAb or IgG1 isotype for 4 h was stained with PE-c-FOS (9F6) rabbit mAb. Representative result of three independent experiments with PBMCs from different healthy donors. (F) The data show mean MFI ± SEM of the total c-FOS in primary pDCs gated from BDCA-2-stimulated or unstimulated PBMCs determined in three independent experiments in PBMCs of different donors.

Similar articles

Cited by

References

    1. Diebold SS, Kaisho T, Hemmi H, Akira S, Reis e Sousa C. Innate antiviral responses by means of TLR7-mediated recognition of single-stranded RNA. Science (2004) 303(5663):1529–31. 10.1126/science.1093616 - DOI - PubMed
    1. Lund J, Sato A, Akira S, Medzhitov R, Iwasaki A. Toll-like receptor 9-mediated recognition of herpes simplex virus-2 by plasmacytoid dendritic cells. J Exp Med (2003) 198(3):513–20. 10.1084/jem.20030162 - DOI - PMC - PubMed
    1. Diamond MS, Kinder M, Matsushita H, Mashayekhi M, Dunn GP, Archambault JM, et al. Type I interferon is selectively required by dendritic cells for immune rejection of tumors. J Exp Med (2011) 208(10):1989–2003. 10.1084/jem.20101158 - DOI - PMC - PubMed
    1. Sisirak V, Faget J, Gobert M, Goutagny N, Vey N, Treilleux I, et al. Impaired IFN-alpha production by plasmacytoid dendritic cells favors regulatory t-cell expansion that may contribute to breast cancer progression. Cancer Res (2012) 72(20):5188–97. 10.1158/0008-5472.CAN-11-3468 - DOI - PubMed
    1. Conrad C, Gregorio J, Wang YH, Ito T, Meller S, Hanabuchi S, et al. Plasmacytoid dendritic cells promote immunosuppression in ovarian cancer via ICOS costimulation of Foxp3+ T-regulatory cells. Cancer Res (2012) 72(20):5240–9. 10.1158/0008-5472.CAN-12-2271 - DOI - PMC - PubMed

Publication types

MeSH terms

LinkOut - more resources