. 2018 Feb 25:2018:1075156.
doi: 10.1155/2018/1075156. eCollection 2018.

Neuropilin 1 Mediates Keratinocyte Growth Factor Signaling in Adipose-Derived Stem Cells: Potential Involvement in Adipogenesis

Affiliations

Neuropilin 1 Mediates Keratinocyte Growth Factor Signaling in Adipose-Derived Stem Cells: Potential Involvement in Adipogenesis

Simona Ceccarelli et al. Stem Cells Int. .

Abstract

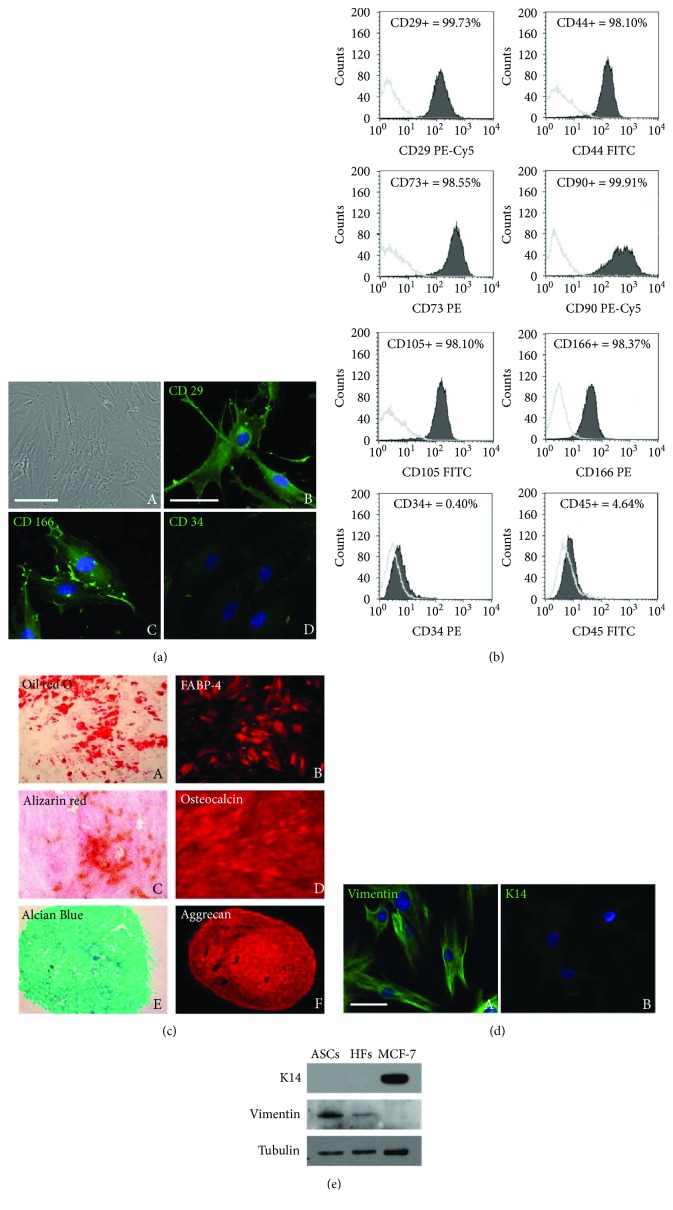
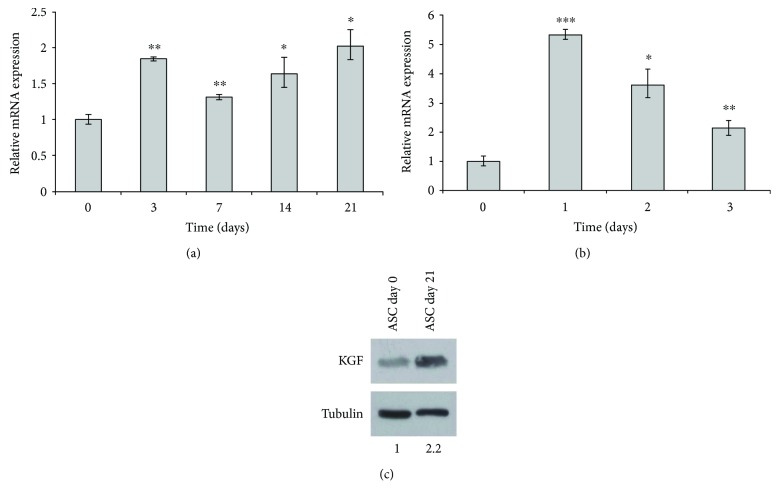
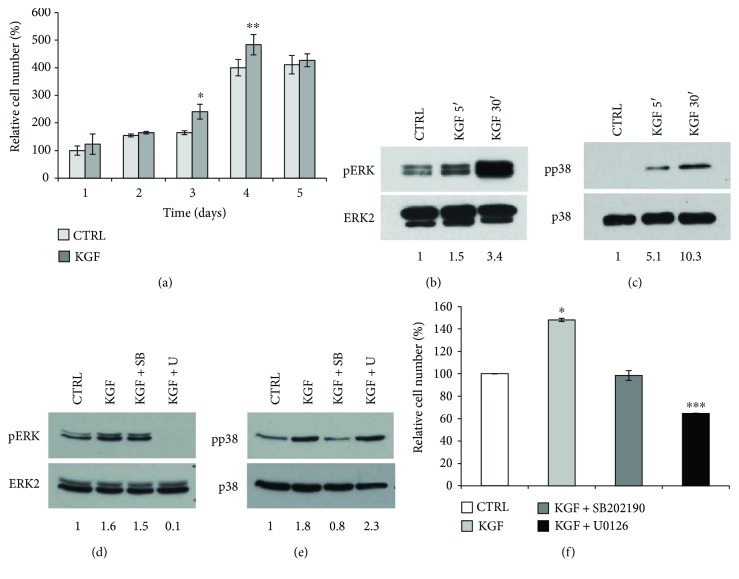
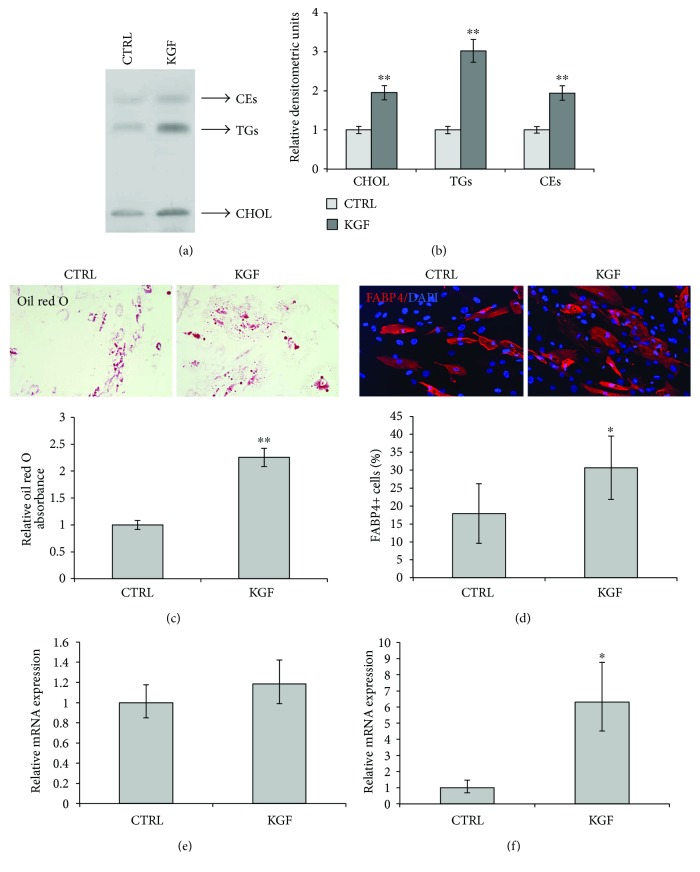
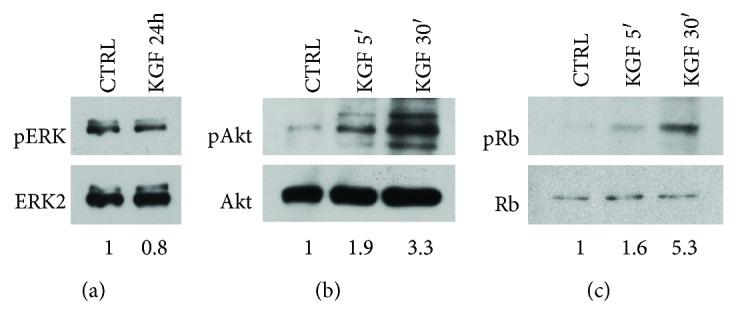
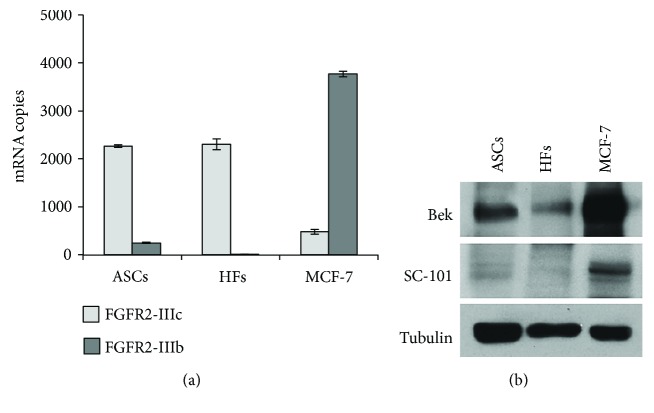
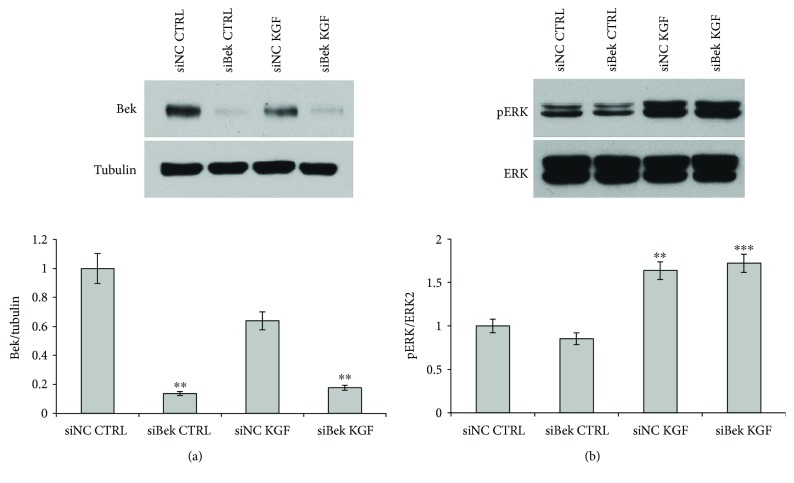
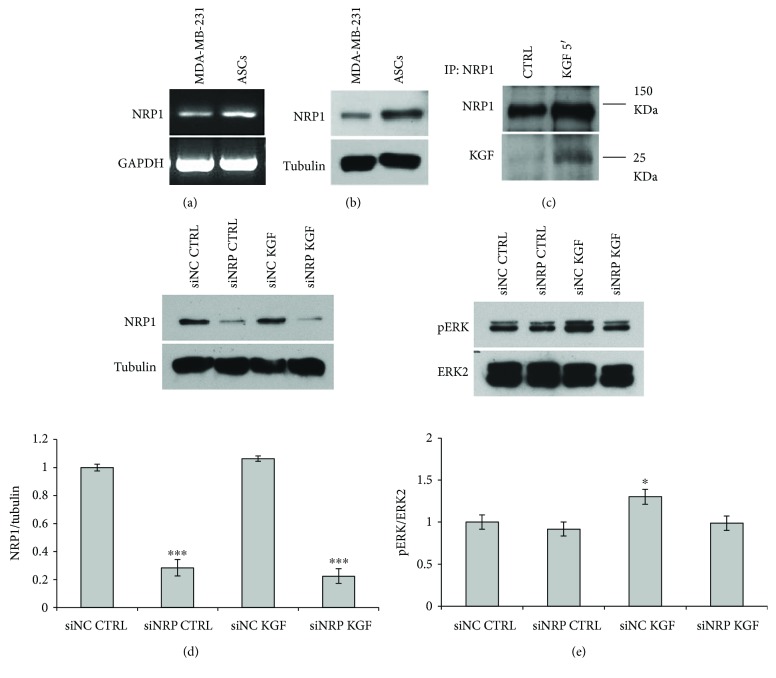
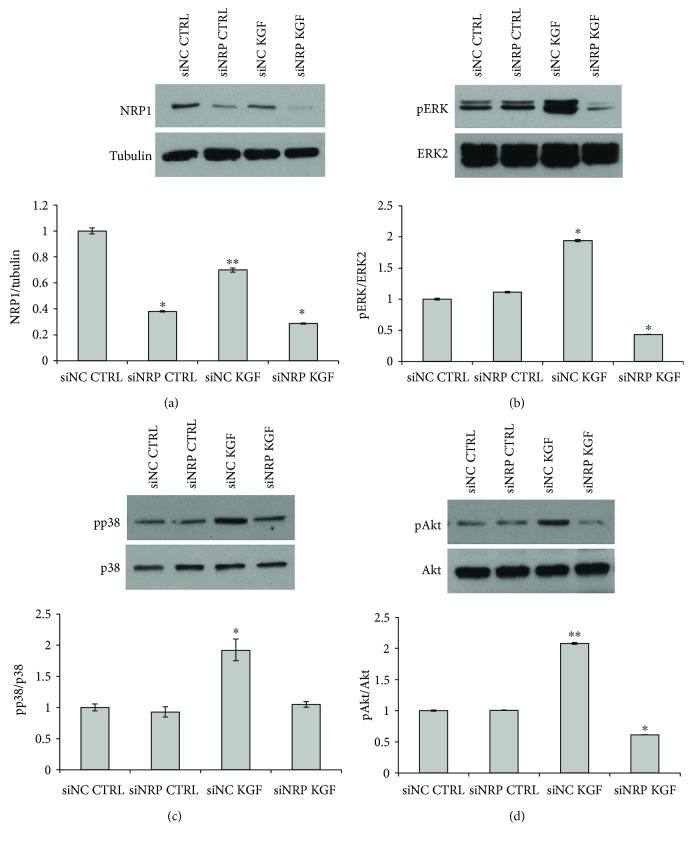
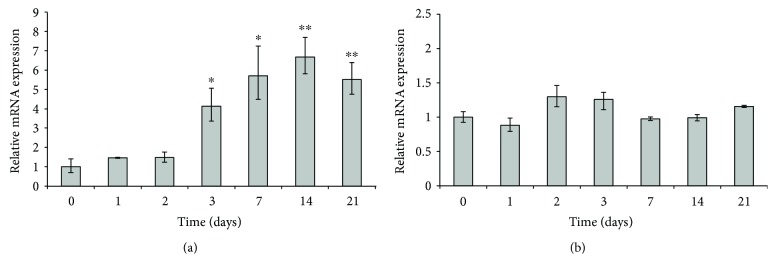
Adipogenesis is regulated by a complex network of molecules, including fibroblast growth factors. Keratinocyte growth factor (KGF) has been previously reported to promote proliferation on rat preadipocytes, although the expression of its specific receptor, FGFR2-IIIb/KGFR, is not actually detected in mesenchymal cells. Here, we demonstrate that human adipose-derived stem cells (ASCs) show increased expression of KGF during adipogenic differentiation, especially in the early steps. Moreover, KGF is able to induce transient activation of ERK and p38 MAPK pathways in these cells. Furthermore, KGF promotes ASC differentiation and supports the activation of differentiation pathways, such as those of PI3K/Akt and the retinoblastoma protein (Rb). Notably, we observed only a low amount of FGFR2-IIIb in ASCs, which seems not to be responsible for KGF activity. Here, we demonstrate for the first time that Neuropilin 1 (NRP1), a transmembrane glycoprotein expressed in ASCs acting as a coreceptor for some growth factors, is responsible for KGF-dependent pathway activation in these cells. Our study contributes to clarify the molecular bases of human adipogenesis, demonstrating a role of KGF in the early steps of this process, and points out a role of NRP1 as a previously unknown mediator of KGF action in ASCs.


Figures

Figure 1
Figure 1
Phenotypical characterization of ASCs. (a) Representative phase-contrast photomicrograph of ASCs, showing homogeneous, spindle-shaped morphology (A) and immunofluorescence analysis showing positive staining for the mesenchymal antigens CD29 (B) and CD166 (C) and negative staining for the hematopoietic CD34 antigen (D). Nuclei (blue) were visualized with 4′,6-diamidino-2-phenylindole (DAPI). Scale bars: 100 μm. (b) Flow cytometric analysis of ASCs. Cells were stained with monoclonal antibodies directed against CD29, C44, CD90, CD166, CD73, CD105, CD34, and CD45. Dark grey areas represent patterns obtained with antibodies against the indicated markers, whereas light grey lines represent the isotype-matched monoclonal antibody that served as a control. Each panel reported the percentage of positive cells for the corresponding marker. (c) Multilineage differentiation of ASCs. Adipogenic differentiation was assessed by positive staining with oil red O (A) and by positive immunofluorescence analysis for the adipocyte-specific fatty acid binding protein 4 (FABP4) (B). Osteogenic differentiation was demonstrated by positive staining for alizarin red (C) and positive immunofluorescence reactivity to osteocalcin (D). Chondrogenic differentiation was assessed by positive staining for Alcian Blue (E) and by positive immunofluorescence with anti-aggrecan antibodies (F). (d) Immunofluorescence analysis of ASCs showing positive staining for the mesenchymal marker vimentin (A) and negative staining for the epithelial marker cytokeratin 14 (K14) (B). Scale bars: 100 μm. (e) Expression of vimentin and K14 assessed by Western blot analysis on ASC whole cell lysates. HFs and MCF-7 cells were used as controls for mesenchymal and epithelial lineage, respectively. Western blot with anti-tubulin antibody served as loading control. The images are representative of at least three independent experiments.
Figure 2
Figure 2
qRT-PCR analysis of KGF mRNA expression in ASCs at different times of adipogenic differentiation. (a) Relative KGF mRNA levels at days 3, 7, 14, and 21 of adipogenic differentiation are shown as fold value of the level of KGF mRNA in undifferentiated cells (day 0). (b) Relative KGF mRNA levels at days 1, 2, and 3 of adipogenic differentiation are shown as fold value of the level of KGF mRNA in undifferentiated cells (day 0). Each experiment was performed in triplicate, and mRNA levels were normalized to PPIA mRNA expression. Error bars represent standard deviations. P < 0.05; ∗∗ P < 0.005; and ∗∗∗ P < 0.0005. (c) KGF protein expression was assessed by Western blot analysis with anti-FGF7 antibody on ASC whole cell lysates at days 0 and 21 of adipogenic differentiation. Tubulin served as loading control.
Figure 3
Figure 3
Evaluation of KGF effect on ASC proliferation. (a) Proliferation ability of ASCs treated or not with 20 ng/ml KGF for 1–5 days was determined by MTT assay. Error bars represent standard deviations from three independent experiments. P < 0.05 and ∗∗ P < 0.005. (b) Phosphorylation of ERK was assessed by Western blot analysis with a phospho-specific ERK monoclonal antibody (pERK) on ASC whole cell lysates, treated or not with 20 ng/ml KGF for 5 and 30 min. Levels of total ERK were assessed by blotting with an ERK2-specific antibody and served as loading control. (c) Phosphorylation of p38 was assessed by Western blot analysis with a phospho-specific p38 monoclonal antibody (pp38) on ASC whole cell lysates, treated or not with 20 ng/ml KGF for 5 and 30 min. Levels of total p38 were assessed by blotting with a p38-specific antibody and served as loading control. (d) Phosphorylation of ERK was assessed by Western blot analysis with a phospho-specific ERK monoclonal antibody (pERK) on ASC whole cell lysates, treated or not with 20 ng/ml KGF for 5 min, in the presence or not of the p38 inhibitor SB202190 or of the ERK inhibitor U0126. Levels of total ERK were assessed by blotting with an ERK2-specific antibody and served as loading control. (e) Phosphorylation of p38 was assessed by Western blot analysis with a phospho-specific p38 monoclonal antibody (pp38) on ASC whole cell lysates, treated or not with 20 ng/ml KGF for 30 min, in the presence or not of the p38 inhibitor SB202190 or of the ERK inhibitor U0126. Levels of total p38 were assessed by blotting with a p38-specific antibody and served as loading control. (b–e) The intensity of the bands was evaluated by densitometric analysis; the values from at least three independent experiments were normalized and reported as fold increase with respect to the untreated sample. (f) Proliferation ability of ASCs treated or not with 20 ng/ml KGF in the presence or not of the p38 inhibitor SB202190 or of the ERK inhibitor U0126 for 3 days was determined by MTT assay. Error bars represent standard deviations from three independent experiments. P < 0.05 and ∗∗∗ P < 0.0005.
Figure 4
Figure 4
Evaluation of KGF effect on ASC adipogenic differentiation. (a) HPTLC analysis of the neutral-lipid cholesterol (CHOL), triglycerides (TGs), and cholesterol esters (CEs) in ASCs treated or not with 20 ng/ml KGF for 24 h. (b) The intensity of the bands was evaluated by densitometric analysis, normalized and reported in a graph as relative expression with respect to untreated cells. Error bars represent standard deviations (∗∗ P < 0.005). (c) Representative images of ASCs cultured in adipogenic medium with or without KGF for 21 days and subjected to lipid staining with oil red O. Stained cells were then solubilized using isopropanol, and the extent of adipocyte differentiation was quantitated by determining the amount of extracted dye, as measured by the optimal absorbance at 490 nM, reported in the graph as relative expression with respect to untreated cells (∗∗ P < 0.005). (d) Immunofluorescence analysis of the adipocyte-specific fatty acid binding protein 4 (FABP4, red) in ASCs at day 21 of adipogenic differentiation, treated or not with KGF during differentiation. Nuclei (blue) were visualized with 4′,6-diamidino-2-phenylindole (DAPI). The percentage of FABP4-positive cells was determined by counting the number of FABP4-positive cells versus total number of cells in ten different areas randomly taken from three independent experiments. Error bars represent standard deviations ( P < 0.05). (e) Relative PPARγ mRNA levels at day 21 of adipogenic differentiation in ASCs treated with KGF are shown as fold value of the level of PPARγ mRNA in untreated cells. Error bars represent standard deviations. (f) Relative FABP4 mRNA levels at day 21 of adipogenic differentiation in ASCs treated with KGF are shown as fold value of the level of FABP4 mRNA in untreated cells. Error bars represent standard deviations ( P < 0.05).
Figure 5
Figure 5
Evaluation of differentiation pathway activation by KGF. (a) Sustained phosphorylation of ERK was assessed by Western blot analysis with a phospho-specific ERK monoclonal antibody (pERK) on ASC whole cell lysates, treated or not with 20 ng/ml KGF for 24 h. Levels of total ERK were assessed by blotting with an ERK2-specific antibody and served as loading control. (b) Phosphorylation of Akt was assessed by Western blot analysis with a phospho-specific Akt monoclonal antibody (pAkt) on ASC whole cell lysates, treated or not with 20 ng/ml KGF for 5 and 30 min. Levels of total Akt were assessed by blotting with an Akt-specific antibody and served as loading control. (c) Phosphorylation of Rb was assessed by Western blot analysis with a phospho-specific Rb monoclonal antibody (pRb) on ASC whole cell lysates, treated or not with 20 ng/ml KGF for 5 and 30 min. Levels of total Rb were assessed by blotting with a Rb-specific antibody and served as loading control. The images are representative of at least three independent experiments.
Figure 6
Figure 6
FGFR2-IIIb and FGFR2-IIIc expression in ASCs. (a) FGFR2-IIIb and FGFR2-IIIc gene expression in ASCs were measured by absolute quantitation real-time PCR. MCF-7 cells were used as a positive control for FGFR2-IIIb and HFs as positive control for FGFR2-IIIc. (b) Western blot analysis of FGFR2-IIIb protein levels in ASCs, HFs, and MCF-7 cells. FGFR2-IIIb protein expression was evaluated by blotting with an anti-Bek antibody or with the homemade FGFR2-IIIb-specific SC-101 mAb. Western blot with anti-tubulin antibody was used as loading control. The images are representative of at least three independent experiments.
Figure 7
Figure 7
Effect of FGFR2 silencing on KGF-mediated phosphorylation of ERK. (a) ASCs transfected with FGFR2-specific siRNA (siBek) or nonspecific control siRNA (siNC), treated or not with 20 ng/ml KGF for 5 min at 37°C, were lysed, and FGFR2 expression was analyzed by immunoblotting with anti-Bek antibodies. siBek induced a marked reduction in FGFR2 expression in both untreated and KGF-treated cells. Western blot with anti-tubulin antibodies was used as loading control. (b) The same lysates were analyzed by immunoblotting with anti-phospho-ERK antibody. Transfection with siBek did not affect ERK phosphorylation levels in KGF-treated cells. The levels of total ERK were assessed by Western blot with anti-ERK1/2 antibodies. The intensity of the bands was evaluated by densitometric analysis; the values from a representative experiment were normalized, expressed as fold increase with respect to the untreated siNC sample and reported as a graph. ∗∗ P < 0.005 and ∗∗∗ P < 0.0005.
Figure 8
Figure 8
Effect of NRP1 silencing on KGF-mediated phosphorylation of ERK. Expression of NRP1 assessed by PCR (a) and Western blot analysis (b) on ASC whole cell lysates. MDA-MB-231 cells were used as positive control for NRP1 expression. GAPDH mRNA expression and blotting with anti-tubulin antibody served as loading control for PCR and Western blot analysis, respectively. The images are representative of at least three independent experiments. (c) Coimmunoprecipitation assay was performed to study in vivo interaction between KGF and NRP1 proteins. ASCs, untreated or treated with 20 ng/ml KGF for 5 min, were immunoprecipitated with anti-NRP1 antibody and blotted with anti-FGF7 antibody. Western blot with anti-NRP1 antibody was used as loading control. (d) ASCs transfected with NRP1-specific siRNA (siNRP) or nonspecific control siRNA (siNC), treated or not with 20 ng/ml KGF for 5 min at 37°C, were lysed, and NRP1 expression was analyzed by immunoblotting with anti-NRP1 antibodies. siNRP induced a marked reduction in NRP1 expression in both untreated and KGF-treated cells. Western blot with anti-tubulin antibodies was used as loading control. (e) The same lysates were analyzed by immunoblotting with anti-phospho-ERK antibody. Transfection with siNRP significantly inhibits ERK phosphorylation induced by KGF treatment. The levels of total ERK were assessed by Western blot with anti-ERK1/2 antibodies. The intensity of the bands was evaluated by densitometric analysis; the values from a representative experiment were normalized, expressed as fold increase with respect to the untreated siNC sample and reported as a graph. P < 0.05 and ∗∗∗ P < 0.0005.
Figure 9
Figure 9
Effect of NRP1 silencing on KGF-mediated phosphorylation of ERK, p38, and Akt. (a) ASCs transfected with NRP1-specific siRNA (siNRP) or nonspecific control siRNA (siNC), treated or not with 20 ng/ml KGF for 30 min at 37°C, were lysed, and NRP1 expression was analyzed by immunoblotting with anti-NRP1 antibodies. siNRP induced a marked reduction in NRP1 expression in both untreated and KGF-treated cells. Western blot with anti-tubulin antibodies was used as loading control. (b) The same lysates were analyzed by immunoblotting with anti-phospho-ERK antibody. Transfection with siNRP significantly inhibits ERK phosphorylation induced by KGF treatment. The levels of total ERK were assessed by Western blot with anti-ERK1/2 antibodies. (c) Phosphorylation of p38 was assessed by Western blot analysis with a phospho-specific p38 monoclonal antibody (pp38). Levels of total p38 were assessed by blotting with a p38-specific antibody and served as loading control. (d) Phosphorylation of Akt was assessed by Western blot analysis with a phospho-specific Akt monoclonal antibody (pAkt). Levels of total Akt were assessed by blotting with an Akt-specific antibody and served as loading control.The intensity of the bands was evaluated by densitometric analysis; the values from a representative experiment were normalized, expressed as fold increase with respect to the untreated siNC sample and reported as a graph. P < 0.05 and ∗∗ P < 0.005.
Figure 10
Figure 10
qRT-PCR analysis of FGFR2-IIIb (a) and NRP1 (b) mRNA expression in ASCs at different times of adipogenic differentiation. Relative mRNA levels at days 1, 2, 3, 7, 14, and 21 of adipogenic differentiation are shown as fold value of the level of mRNA in undifferentiated cells (day 0). Each experiment was performed in triplicate, and mRNA levels were normalized to PPIA mRNA expression. Error bars represent standard deviations. P < 0.05 and ∗∗ P < 0.005.

Similar articles

Cited by

References

    1. Zuk P. A., Zhu M., Ashjian P., et al. Human adipose tissue is a source of multipotent stem cells. Molecular Biology of the Cell. 2002;13(12):4279–4295. doi: 10.1091/mbc.E02-02-0105. - DOI - PMC - PubMed
    1. Shingyochi Y., Orbay H., Mizuno H. Adipose-derived stem cells for wound repair and regeneration. Expert Opinion on Biological Therapy. 2015;15(9):1285–1292. doi: 10.1517/14712598.2015.1053867. - DOI - PubMed
    1. Dai R., Wang Z., Samanipour R., Koo K. I., Kim K. Adipose-derived stem cells for tissue engineering and regenerative medicine applications. Stem Cells International. 2016;2016:19. doi: 10.1155/2016/6737345.6737345 - DOI - PMC - PubMed
    1. Rosen E. D., MacDougald O. A. Adipocyte differentiation from the inside out. Nature Reviews Molecular Cell Biology. 2006;7(12):885–896. doi: 10.1038/nrm2066. - DOI - PubMed
    1. Hutley L., Shurety W., Newell F., et al. Fibroblast growth factor 1: a key regulator of human adipogenesis. Diabetes. 2004;53(12):3097–3106. doi: 10.2337/diabetes.53.12.3097. - DOI - PubMed

LinkOut - more resources