. 2017 Dec 19;9(12):10228-10246.
doi: 10.18632/oncotarget.23421. eCollection 2018 Feb 13.

The KDEL receptor signalling cascade targets focal adhesion kinase on focal adhesions and invadopodia

Affiliations

The KDEL receptor signalling cascade targets focal adhesion kinase on focal adhesions and invadopodia

Carmen Ruggiero et al. Oncotarget. .

Abstract

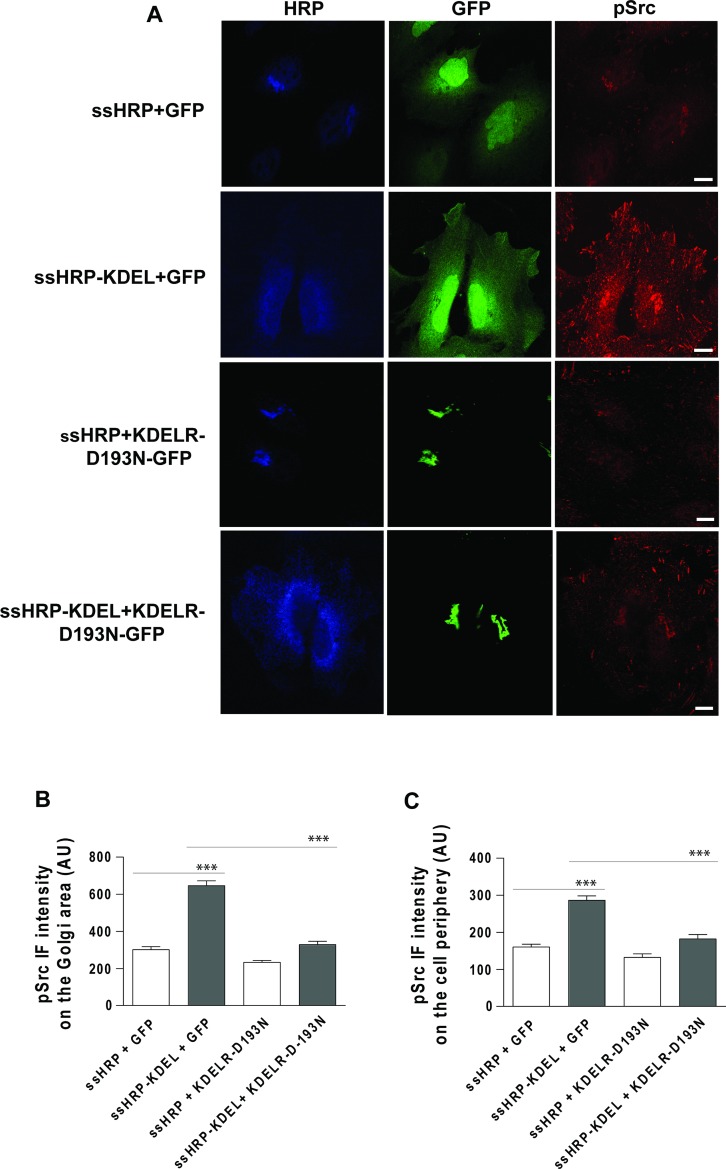
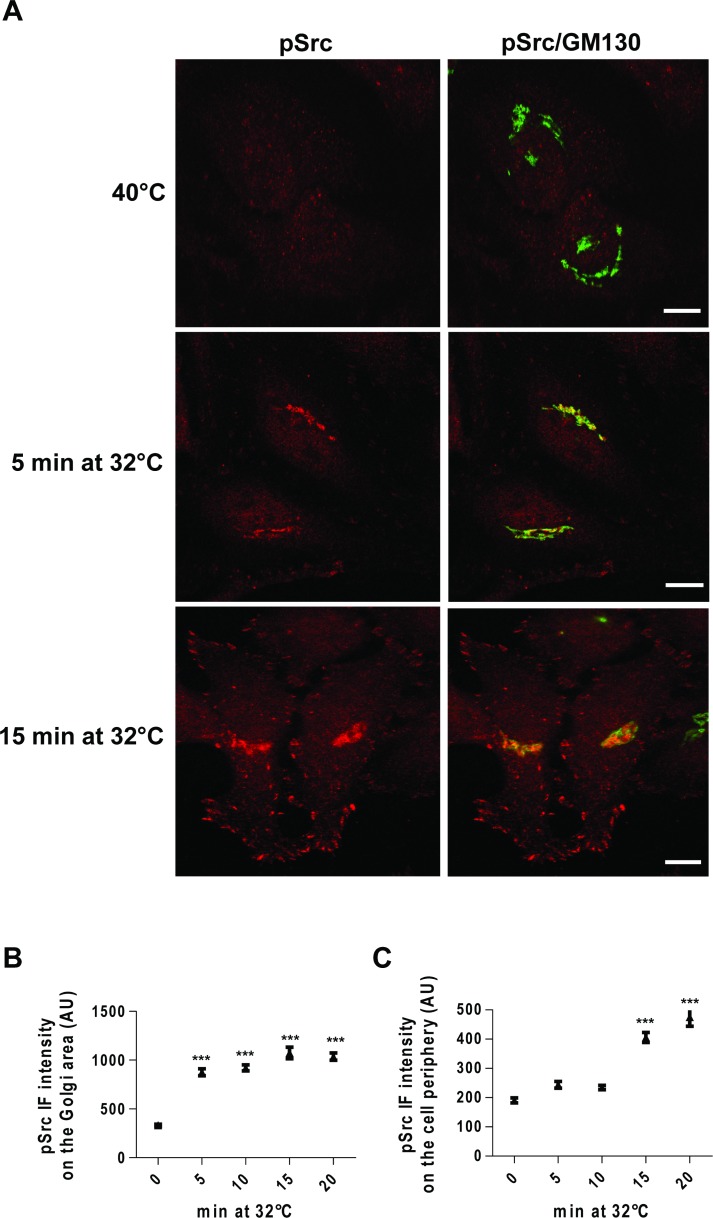
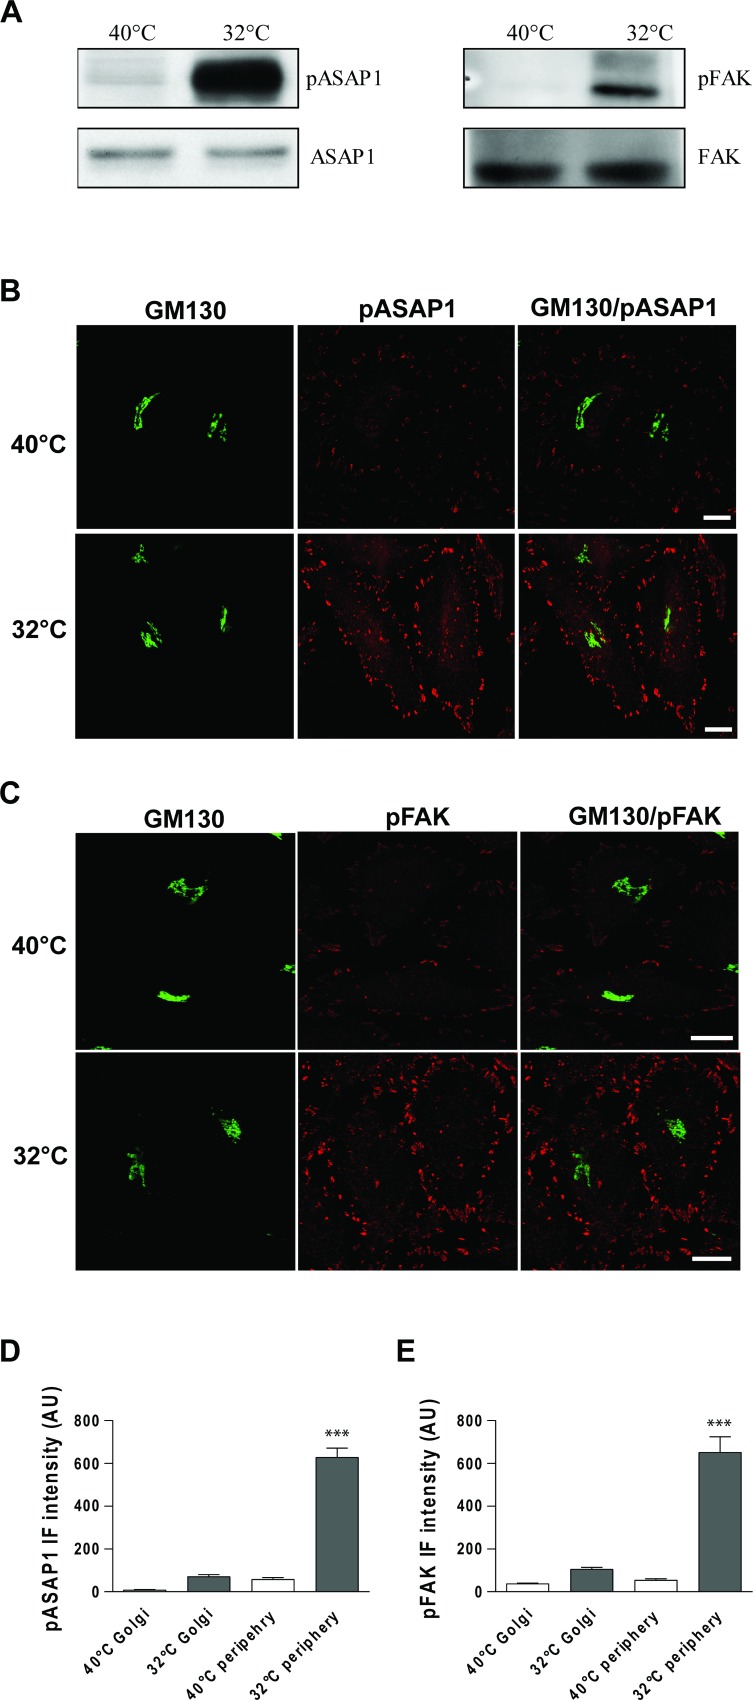
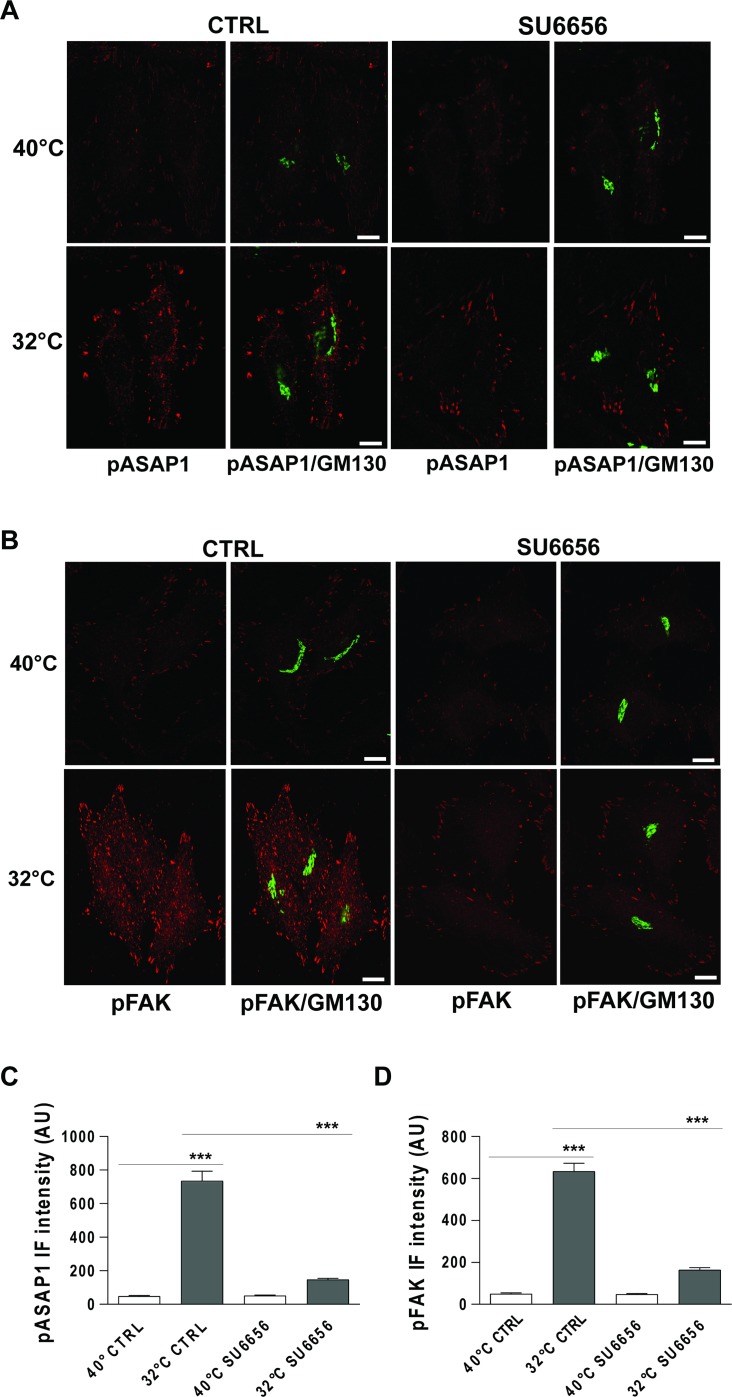
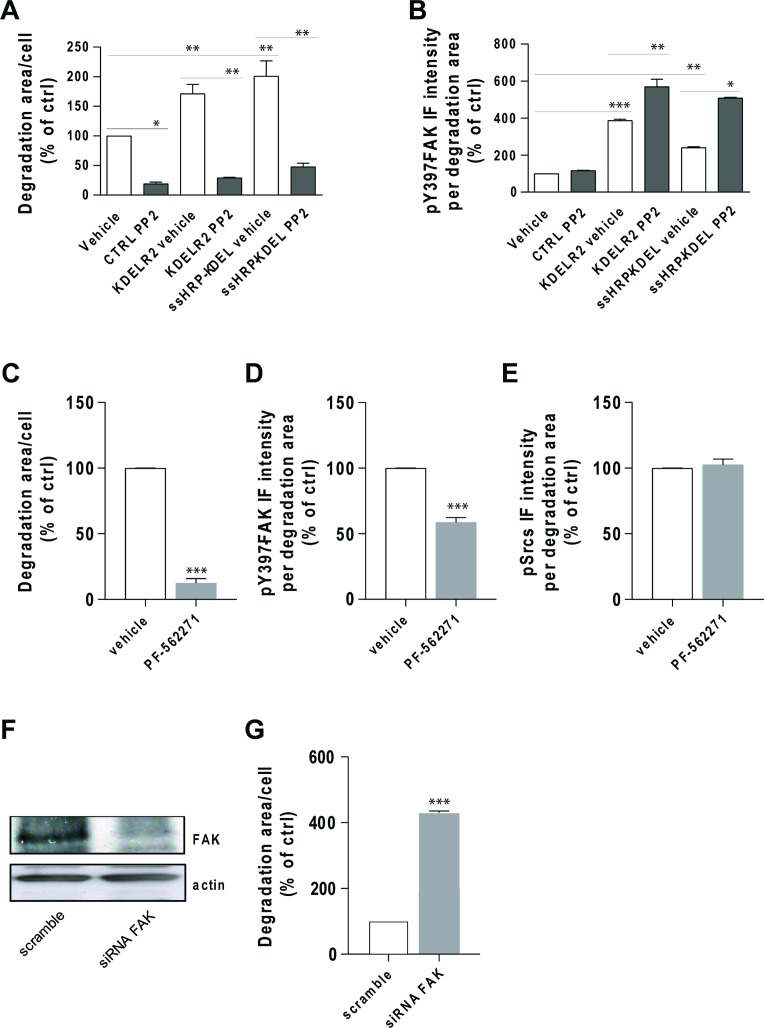
Membrane trafficking via the Golgi-localised KDEL receptor activates signalling cascades that coordinate both trafficking and other cellular functions, including autophagy and extracellular matrix degradation. In this study, we provide evidence that membrane trafficking activates KDEL receptor and the Src family kinases at focal adhesions of HeLa cells, where this phosphorylates ADP-ribosylation factor GTPase-activating protein with SH3 domain, ankyrin repeat and PH domain (ASAP)1 and focal adhesion kinase (FAK). Previous studies have reported extracellular matrix degradation at focal adhesions. Here, matrix degradation was not seen at focal adhesions, although it occurred at invadopodia, where it was increased by KDEL receptor activation. This activation of KDEL receptor at invadopodia of A375 cells promoted recruitment and phosphorylation of FAK on tyrosines 397 and 861. From the functional standpoint, FAK overexpression inhibited steady-state and KDEL-receptor-stimulated extracellular matrix degradation, whereas overexpression of the FAK-Y397F mutant only inhibited KDEL-receptor-stimulated matrix degradation. Finally, we show that the Src and FAK activated downstream of KDEL receptor are part of parallel signalling pathways. In conclusion, membrane-traffic-generated signalling via KDEL receptor activates Src not only at the Golgi complex, but also at focal adhesions. By acting on Src and FAK, KDEL receptor increases invadopodia-mediated matrix degradation.

Keywords: FAK; KDEL receptor; Src; cell signalling; membrane trafficking.


Conflict of interest statement

CONFLICTS OF INTEREST The authors declare that they have no conflicts of interest.

Figures

Figure 1
Figure 1. Traffic-induced Src activation at the Golgi complex and cell periphery is KDELR dependent
(A) HeLa cells were transfected for 24 h with empty vector (CTRL) or myc-tagged KDELR mutant D193N (KDELR-D193N), and incubated for 3 h at 40°C (temperature block), shifted to 32°C (temperature block release) for 30 min, and then fixed and double-stained for pSrc (red) and GM130 (green), or for pSrc (red) and myc (green). Merged images are also shown (pSrc/GM130; pSrc/myc). Scale bars, 10 μm. Images are representative of three independent experiments. (B, C) Quantification of pSrc IF intensities in the Golgi area (B) and cell periphery (C). Data are means ± SEM, from three independent experiments, with at least 25 cells quantified in each. ***p < 0.001 (ANOVA followed by Bonferroni correction). pSrc IF intensity is expressed as arbitrary units (AU).
Figure 2
Figure 2. Src activation at the cell periphery by ssHRPKDEL overexpression is KDELR dependent
(A) HeLa cells were transfected with ssHRPKDEL and GFP-tagged KDELR-D193N (KDELR-D193N-GFP), or with ssHRP-KDEL and GFP alone. In parallel, the cells were co-transfected with ssHRP and KDELR-D193N-GFP, or with ssHRP and GFP alone. After 24 h, the cells were fixed and stained for HRP (blue) and pSrc (red). Scale bars, 10 μm. Images are representative of two independent experiments. (B, C) Quantification of pSrc IF intensity in the Golgi area (B) and cell periphery (C) as means of two independent experiments, with at least 25 cells quantified in each. ***p < 0.001 (ANOVA followed by Bonferroni correction). pSrc IF intensity is expressed as arbitrary units (AU).
Figure 3
Figure 3. Time-course of Src activation at the Golgi complex and cell periphery following a traffic pulse
(A) HeLa cells were kept at 40°C for 3 h (temperature block), and shifted to 32°C (temperature block release) for the indicated times, and then fixed and stained for pSrc (red) and GM130 (green). Merged images are also shown (pSrc/GM130). Scale bars, 10 μm. Images are representative of three independent experiments. (B, C) Quantification of pSrc IF intensity at the Golgi (B) and the cell periphery (C). Data are means ± SEM of three independent experiments, with at least 25 cells quantified in each. ***p < 0.001 (ANOVA followed by Bonferroni correction) compared to zero time. pSrc IF intensity is expressed as arbitrary units (AU).
Figure 4
Figure 4. ASAP1 and FAK are Tyr phosphorylated following a traffic pulse
(A) HeLa cells were kept at 40°C for 3 h (temperature block), shifted to 32°C (temperature block release) for 30 min, and then homogenised. Total cell lysates were loaded onto SDS-PAGE gels and subjected to immunoblotting. Representative immunoblots of lysates from three independent experiments of non-phosphorylated (ASAP1 and FAK) and Tyr 782 phosphorylated ASAP1 (pASAP1) and Tyr 861 phosphorylated FAK (pFAK). (B, C) HeLa cells were incubated for 3 h at 40°C (temperature block), shifted to 32°C (temperature block release) for 30 min, and then fixed and double-stained for GM130 (green) and pASAP1 (pTyr 782, red) (B) or pFAK (pTyr 861, red) (C). Merged images are also shown. Scale bars, 10 μm. Images are representative of three independent experiments. (D, E) Quantification of pASAP1 (D) and pFAK (E) IF intensities on the Golgi area and at the cell periphery. Data are means ± SEM, from three independent experiments, with at least 25 cells quantified in each. ***p < 0.001 (ANOVA followed by Bonferroni correction). pASAP1 and pFAK IF intensities are expressed as arbitrary units (AU).
Figure 5
Figure 5. Traffic-induced ASAP1 and FAK phosphorylation in the cell periphery are KDELR dependent
(A, B) HeLa cells were transfected for 24 h with an empty vector (CTRL) or with myc-tagged KDELR mutant D193N (KDELR-D193N), incubated for 3 h at 40°C (temperature block), and shifted to 32°C (temperature block release) for 30 min. The empty vector and KDELR-D193N-transfected cells were both double-stained for pASAP1 (pTyr 782, red) (A) or pFAK (pTyr 861, red) (B) and separately for GM130 (green) or myc (green), respectively. Merged images are also shown. Scale bars, 10 μm. Images are representative of three independent experiments. (C, D) Quantification of pASAP1 (C) and pFAK (D) IF intensities at the cell periphery. Data are means ± SEM of three independent experiments, with at least 25 cells quantified in each. ***p < 0.001 (ANOVA followed by Bonferroni correction). IF intensities are expressed as arbitrary units (AU).
Figure 6
Figure 6. Traffic-induced ASAP1 and FAK phosphorylation in the cell periphery are Src dependent
(A, B) HeLa cells were incubated at 40°C for 3 h (temperature block), and ± 10 μM SU6656 for the final 30 min, and then shifted to 32°C (temperature block release) for 30 min, again ± 10 μM SU6656. The cells were then fixed and double-stained for pASAP1 (pTyr 782, red) (A) or pFAK (pTyr 861, red) (B) and GM130 (green). Merged images are also shown. Scale bars, 10 μm. Images are representative of three independent experiments. (C, D) Quantification of pASAP1 (C) and pFAK (D) IF intensities at the cell periphery. Data are means ± SEM from three independent experiments, with at least 25 cells quantified in each. ***p < 0.001 (ANOVA followed by Bonferroni correction). pASAP1 and pFAK IF intensities are expressed as arbitrary units (AU).
Figure 7
Figure 7. KDELR stimulation promotes FAK recruitment and phosphorylation to areas of ECM degradation
(A, D) A375 cells were transfected with empty vector (MOCK) or ssHRP-KDEL and grown on rhodamine-conjugated crosslinked gelatin (red) for 16 h in the presence of 5 μM protease inhibitor BB94. Following BB94 wash out, the cells were incubated for a further 3 h and then fixed and stained for FAK or pY861FAK (green). An anti-HRP antibody (blue) was used to visualise ssHRP-KDEL-transfected cells. Merged images are also shown (merge). The region outlined by the black box corresponds to the magnified image shown on the right. Scale bars, 10 μm. Images are representative of three independent experiments. (B, C) Quantification of FAK (B) and p861FAK (C) IF intensities in the areas of degradation. Data are means ± SEM of three independent experiments, with at least 100 cells quantified in each. ***p < 0.001 (Student's t-test).
Figure 8
Figure 8. Effects of FAK-WT and non-phosphorylatable FAK mutants on ECM degradation and Src recruitment to degradation areas
(A) A375 cells were transfected with empty vector (CTRL), HA-tagged FAK-WT or HA-tagged FAK-Y861F mutant. The cells were also transfected with myc-tagged ssHRP-KDEL, myc-tagged ssHRP-KDEL and FAK-WT, or myc-tagged ssHRP-KDEL and FAK-Y861F. The cells were grown on rhodamine-conjugated crosslinked gelatin for 16 h in the presence of 5 μM protease inhibitor BB94. Following BB94 wash out, the cells were incubated for a further 3 h and then fixed and stained with an anti-HA antibody and Alexa Fluor 633-phalloidin or with anti-HA and anti-myc antibodies. Quantification of degradation area per cell, as means ± SEM of three independent experiments, with at least 100 cells quantified in each. ***p < 0.001 (ANOVA followed by Bonferroni correction). (B) KDELR stimulation increases the levels of FAK phosphorylated on Tyr 397 in areas of degradation. A375 cells were transfected with empty vector (CTRL) or myc-tagged ssHRP-KDEL and grown on rhodamine-conjugated crosslinked gelatin for 16 h in the presence of 5 μM protease inhibitor BB94. Following BB94 wash out, the cells were incubated for a further 3 h before being fixed and stained for pFAK (pTyr 397). Quantification of pY397-FAK IF intensity in the areas of degradation, as means ± SEM of three independent experiments, with at least 100 cells quantified in each. ***p < 0.001 (Student's t-test). (C) Effects of FAK-Y397F mutant overexpression on ECM degradation. A375 cells were transfected with empty vector (CTRL), HA-tagged FAK-Y397F mutant, myc-tagged ssHRP-KDEL or myc-tagged ssHRP-KDEL and FAK-Y397F. The cells were grown on rhodamine-conjugated crosslinked gelatin for 16 h in the presence of 5 μM protease inhibitor BB94. Following BB94 wash out, the cells were incubated for a further 3 h before being fixed and stained with anti-HA or anti-myc, or with anti-HA and anti-myc antibodies. Quantification of the area of degradation per cell as means ± SEM of three independent experiments, with at least 100 cells quantified in each. ***p < 0.001 (ANOVA followed by Bonferroni correction). (D) A375 cells were transfected (see below) and subjected to the gelatin degradation assay as in (A), then the control (CTRL) cells were labelled with an anti-Src antibody (green) and Alexa Fuor-633 phalloidin (blue), while FAK-construct-transfected cells were labelled with anti-Src (green) and anti-HA (blue) antibodies. Merged images are also shown. Regions outlined by black boxes correspond to magnified regions of degradation sites. Scale bars, 10 μm. Images are representative of two independent experiments. (E) A375 cells were transfected and subjected to the gelatin degradation assay as in (A), then control (CTRL) cells were labelled with an anti-pSrc antibody (green) and Alexa Fuor-633 phalloidin (blue), while FAK-construct-transfected cells were labelled with anti-pSrc (green) and anti-HA antibodies (blue). Merged images are also shown. Regions outlined by black boxes correspond to magnified regions of pSrc staining at degradation sites. Scale bars, 10 μm. Images are representative of two independent experiments. (F) Quantification of Src IF intensity in areas of degradation, as means ± SEM of two independent experiments, with IF intensities of at least 100 cells quantified in each. ***p < 0.001, versus control cells (ANOVA followed by Bonferroni correction). (G) Quantification of pSrc IF intensity in areas of degradation, as means ± SEM of two independent experiments. IF intensities at sites of ECM degradation of at least 100 cells were quantified in each. ***p < 0.001 (ANOVA followed by Bonferroni correction).
Figure 9
Figure 9. Src inhibition does not prevent FAK autophosphorylation at invadopodia
(A) A375 cells were transfected with empty vector (CTRL), myc-tagged KDELR2 or myc-tagged ssHRP-KDEL, and grown on rhodamine-conjugated crosslinked gelatin for 16 h in the presence of 5 μM protease inhibitor BB94. The cells were treated with vehicle alone (vehicle) or with 3 μM Src inhibitor PP2 for the final 2 h. After BB94 wash-out, PP2 was re-added for a further 3 h, after which the cells were fixed and stained. Following staining with Alexa Fluor-633 phalloidin (CTRL) or anti-myc antibody and Alexa Fluor-633 phalloidin (KDELR2- and ssHRP-KDEL-transfected cells), the total area of ECM degradation per cell was determined, as means ± SEM of two independent experiments, with at least 100 cells quantified in each. **p < 0.01 and *p < 0.05 (ANOVA followed by Bonferroni correction). (B) A375 cells were transfected, treated with PP2, and subjected to gelatin degradation assay as in (A). Following labelling with an anti-pFAK (pTyr 397) antibody, Y397-FAK IF intensity in the areas of degradation was quantified, as means ± SEM of two independent experiments, with at least 100 cells quantified in each. ***p < 0.001, **p < 0.01 and *p < 0.05 (ANOVA followed by Bonferroni correction). (C) A375 cells were plated on rhodamine-conjugated gelatin in the presence of 5 μM protease inhibitor BB94 for 16 h and pre-treated without (ctrl) or with FAK inhibitor PF-562271 (5 μM) during the final 30 min of incubation. Following BB94 wash out, the cells were treated for a further 3 h with 5 μM PF-562271, and fixed and stained for pFAK (pTyr 397). Quantification of p397FAK IF intensity in the areas of ECM degradation, as means ± SEM of three independent experiments, with at least 100 cells quantified in each. (D) A375 cells were treated and subjected to gelatin degradation assay as in (A), then scored for ECM degradation area per cell, as means ± SEM of three independent experiments, with at least 100 cells quantified in each. (E) A375 cells were treated and subjected to gelatin degradation assay as in (A). Following labelling with an anti-pSrc (pTyr 419) antibody, pSrc IF intensities in the degradation areas were determined, as means ± SEM of IF intensity from three independent experiments, with at least 100 cells quantified in each. (F) FAK is required for ECM degradation by A375 cells. A375 cells were treated with scrambled siRNA or siRNA targeting FAK (siRNA FAK) for 96 h. Cells were incubated in plastic dishes for 72 h, detached and plated again for a further 24 h before lysis. FAK expression levels were determined by Western blotting using an anti-FAK antibody. An anti-actin antibody was used for protein loading in each lane. (G) A375 cells were treated as in (A) for 72 h, then detached and plated again for a further 24 h on rhodamine-conjugated crosslinked gelatin in the presence of 5 μM protease inhibitor BB94. Following BB94 wash out, the cells were incubated for a further 3 h, fixed and stained with an anti-FAK antibody and Alexa Fluor 633-phalloidin, and scored for ECM degradation area per cell, as means ± SEM of three independent experiments, with at least 100 cells quantified in each.

Similar articles

Cited by

References

    1. Capitani M, Sallese M. The KDEL receptor: new functions for an old protein. FEBS Lett. 2009;583:3863–3871. https://doi.org/10.1016/j.febslet.2009.10.053 - DOI - PubMed
    1. Pulvirenti T, Giannotta M, Capestrano M, Capitani M, Pisanu A, Polishchuk RS, San Pietro E, Beznoussenko GV, Mironov AA, Turacchio G, Hsu VW, Sallese M, Luini A. A traffic-activated Golgi-based signalling circuit coordinates the secretory pathway. Nat Cell Biol. 2008;10:912–922. https://doi.org/10.1038/ncb1751 - DOI - PubMed
    1. Ruggiero C, Fragassi G, Grossi M, Picciani B, Di Martino R, Capitani M, Buccione R, Luini A, Sallese M. A Golgi-based KDELR-dependent signalling pathway controls extracellular matrix degradation. Oncotarget. 2015;6:3375–3393. https://doi.org/10.18632/oncotarget.3270 - DOI - PMC - PubMed
    1. Basbaum CB, Werb Z. Focalized proteolysis: spatial and temporal regulation of extracellular matrix degradation at the cell surface. Curr Opin Cell Biol. 1996;8:731–738. https://doi.org/S0955-0674(96)80116-5 - PubMed
    1. Chen WT. Proteolytic activity of specialized surface protrusions formed at rosette contact sites of transformed cells. J Exp Zool. 1989;251:167–185. https://doi.org/10.1002/jez.1402510206 - DOI - PubMed