. 2017 Dec 8;9(12):10360-10374.
doi: 10.18632/oncotarget.23164. eCollection 2018 Feb 13.

Superior efficacy of the antifungal agent ciclopirox olamine over gemcitabine in pancreatic cancer models

Affiliations

Superior efficacy of the antifungal agent ciclopirox olamine over gemcitabine in pancreatic cancer models

Chrysovalantou Mihailidou et al. Oncotarget. .

Abstract

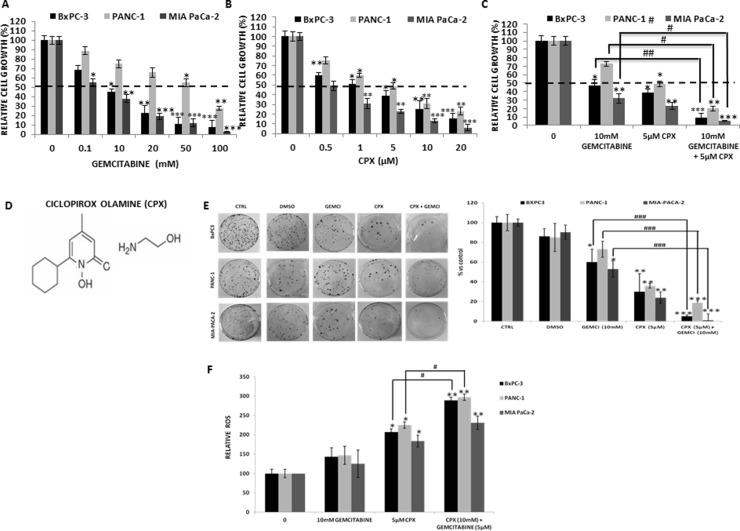
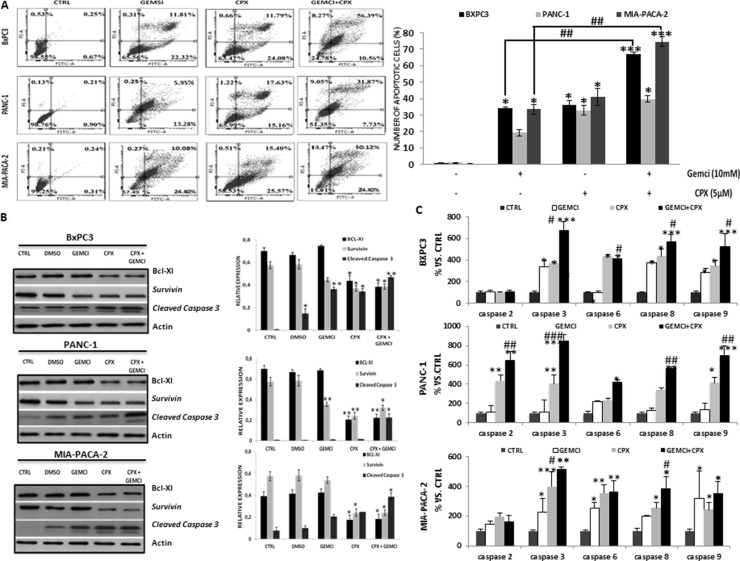
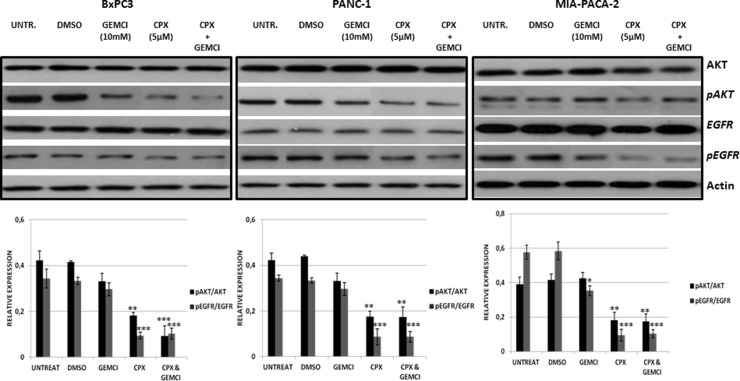
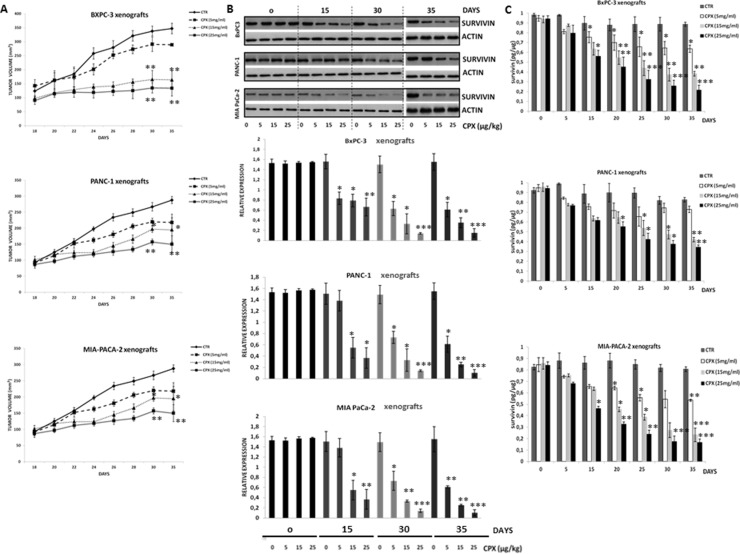
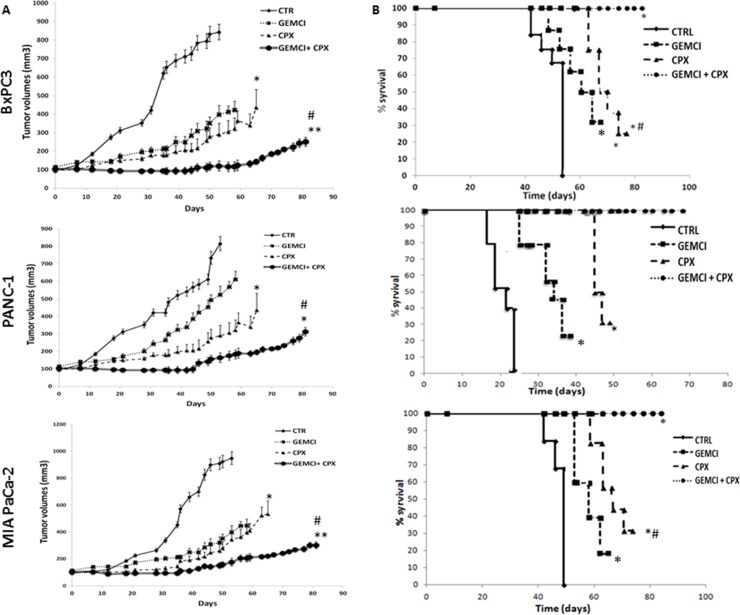
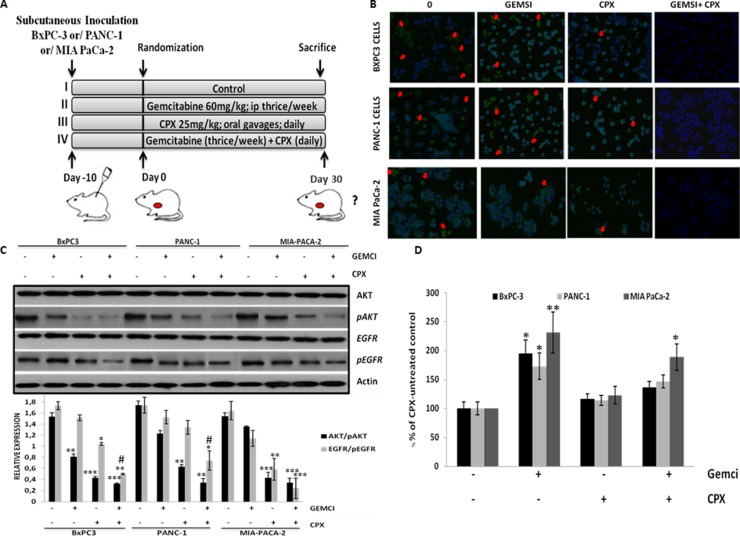
Ciclopirox olamine (CPX) is an antifungal agent that has recently demonstrated promising anti-neoplastic activity against hematologic and solid tumors. Here, we evaluated CPX compared with gemcitabine alone as well as their combination in human pancreatic cancer cell lines; BxPC-3, Panc-1, and MIA PaCa-2 and in humanized xenograft mouse models. We also examined the preclinical pharmacodynamic activity of CPX. CPX caused a pronounced decrease in cell proliferation and clonogenic growth potential. These inhibitory effects were accompanied by induction of reactive oxygen species (ROS), which were strongly associated with reduced Bcl-xL and survivin levels and activation of a panel of caspases, especially caspase-3, and finally resulted in apoptotic death. CPX-induced apoptosis was associated with reduced pEGFR (Y1068) and pAkt (Ser473) protein levels. Additionally, decreased proliferation was observed in CPX-treated xenografts tumors, demonstrating unique tumor regression and a profound survival benefit. Finally, we showed that CPX significantly abrogated gemcitabine-induced ROS levels in pancreatic tissues. These pre-clinical results have verified the superior antitumor efficacy of CPX over gemcitabine alone, while their combination is even more effective, providing the rationale for further clinical testing of CPX plus gemcitabine in pancreatic cancer patients.

Keywords: ciclopirox olamine; gemcitabine; human pancreatic tumor xenograft models; pancreatic cancer; pharmacodynamic activity.


Conflict of interest statement

CONFLICTS OF INTEREST The authors declare no potential conflicts of interest

Figures

Figure 1
Figure 1. CPX showed higher inhibitory effects on cell proliferation and colony forming ability as well as further stimulation of the ROS generation compared to gemcitabine treatment, in human pancreatic cell lines
BxPC-3, PANC-1 and MIA-PaCa-2 cells were incubated with a range of (A) CPX increasing doses (0 −20 μM) and (B) Gemcitabine increasing doses (0 – 100 mM). Next, cell viability was analyzed using colorimetric MTT metabolic activity assay. (C) Cells were exposed to gemcitabine co-incubated with CPX, at concentration 10 mM and 5 μM respectively, and were analyzed using colorimetric MTT metabolic activity assay. (D) Chemical structure of CPX (ciclopirox olamine). (E) Clonogenic survival of BxPC-3, PANC-1 and MIA-PaCa-2 following exposure to gemcitabine (10 mM) and CPX (5 μM) singly or in combination. Results are expressed as percentages vs controls and shown adjacent to representative petri dishes. Average values of three experiments ±S.D. (n = 3) are shown. *P < 0.05; **P < 0.01; ***P < 0.001; difference vs control group, #P < 0.05; ##P < 0.01; ###P < 0.001; difference vs gemcitabine group. (F) BxPC-3, PANC- 1 and MIA-PaCa-2 cells were pre-incubated with 5 μM CPX and/or 10 mM gemcitabine for 4 hours to assess ROS production. Here we show results obtained by OHdG measurements. Absorbance detection was measured using a microplate reader * P < 0.05, **P < 0.01 vs. control group. #, P<0.05 vs.CPX group, (Student's t-test). All values are expressed as average ±S.D. (n = 3). Gemci; Gemcitabine.
Figure 2
Figure 2. CPX decreases protein levels of Bcl-xL and survivin, increases cleavage of Bcl-2 and promotes apoptosis, more efficiently compared to gemcitabine
(A) BxPC-3, PANC- 1 and MIA-PaCa-2 cells were cultured with 5 μM CPX and/or 10mM gemcitabine for 48 h. The cells were harvested and processed for apoptosis assay using the Annexin V-FITC Apoptosis Detection Kit /PI staining and flow cytometry. The total percent of apoptotic cells are presented of three independent experiments that yielded similar results as mean ± S.D. (n = 3). *P < 0.05; **P < 0.01; ***P < 0.001, difference versus control group, #P < 0.05; ##P < 0.01 difference versus gemcitabine-treated group. Gemci; Gemcitabine. (B) BxPC-3, PANC- 1 and MIA-PaCa-2 cells were treated with 5μM CPX and/or 10mM gemcitabine for 24 hours. The cells were harvested and subjected to Western blotting assay. Actin was used as loading control. The densitometric quantification of apoptosis-related protein levels (normalized to the actin levels) are shown adjacent to each immunoblot and reflects average values ± SEM of at least 3 independent experiments. *p < 0.05 **P < 0.01 vs. control group. (C) Relative activities of caspases -2,-3,-6,-8,-9 after treatment of BxPC-3, PANC- 1 and MIA-PaCa-2 cells with 5μM CPX and/or 10mM gemcitabine. Average values of three replicate experiments ± S.D. are shown. *P < 0.05; **P < 0.01; ***P < 0.001, difference vs control group, #P < 0.05; ##P < 0.01; ###P < 0.001; difference vs gemcitabine group. (Student's t-test).
Figure 3
Figure 3. CPX treatment more down-regulate pEGFR and pAKT (S473) more efficiently in comparison with gemcitabine treatment
BxPC-3, PANC- 1 and MIA-PaCa-2 cells were pre-treated for 2 hours with 5 μM CPX and/or 10mM gemcitabine and then were harvested for immunoblotting assay. Actin levels were assessed as a loading control. The intensities of pEGFR (Y1068) /total EGFR and pAKT (S473)/total AKT in gemcitabine (10mM) untreated/treated cells, with/without CPX (5 μΜ) are represented in the graphs which are shown in the lower panel and reflects average values ± SEM of at least 3 independent experiments. *P < 0.05; **P < 0.01; ***P < 0.001, difference versus DMSO group. Gemci; Gemcitabine.
Figure 4
Figure 4. Pharmacodynamic analysis of CPX showed suppression of survivin levels in tumor of human pancreatic xenograft mice as well as inhibition of tumor growth, in a concetration- and time-dependent manner
Female SCID mice were inoculated subcutaneously with BxPC-3 (3 × 10⁶ cells/mouse) or PANC- 1 (3 × 10⁶ cells/mouse) or MIA PaCa-2 (3 × 10⁶ cells/mouse) tumor cells. When local tumors were established, mice were randomly subdivided into groups after daily single oral gavage of CPX at concentration 5 mg/kg, 15 mg/kg, and 25mg/kg. Tumor tissues were resected on 0, 5th, 15th, 30th day after the daily administration of CPX. Tumor tissues were also resected on day 35th day (5 days after stopping the administration of CPX). (A) The tumor volumes within each cell line group were calculated (thrice/per week) after oral gavage of CPX at 5, 15 and 25 mg/kg daily. The mean ± SD (n = 6) data on tumor volumes are presented in the indicated graph *Significant difference (P < 0.05), **Significant difference (P < 0.01) versus controls (untreated) per time point. (B) Western blot analysis was followed for detecting survivin protein levels in tumor tissues (upper panel). The densitometric quantification of survivin reflects average values ± SD (n = 3) of at least 3 independent experiments. *p < 0.05 **P < 0.01 ***P < 0.001 vs. Control group of the indicated time point (lower panel). (C) Survivin levels as measured by ELISA after increasing doses of CPX at 5, 15, 25 mg/kg (n = 3 per time point). Survivin reflects average values ± SEM of at least 3 independent experiments. *p < 0.05 **P < 0.01 ***P < 0.001 vs. Control group of the indicated time point.
Figure 5
Figure 5. CPX monotherapy improves the efficacy of gemcitabine monotherapy on the growth of established local pancreatic tumors in BxPC-3 Panc1 and MIA PaCa-2 xenograft models
(A) SCID mice were implanted with BxPC-3 Panc1 and MIA PaCa-2 cells. When local tumors were established, animals were randomly subdivided into four groups (i) vehicle; (ii) Gemcitabine alone (60 mg/kg); (iii) CPX alone (25 mg/kg); (iv) Combination of gemcitabine (60 mg/kg) and CPX (25mg/kg) of each cancer cell line, respectively. The animals were continuously gavaged with the agents for 90 days as mentioned in the Materials and Methods section. The tumor volume within each treatment group was calculated (thrice/per week) and presented in the indicated graphs. Values are means, n = 6–8. *Significant difference (P < 0.05), **Significant difference (P < 0.01) versus controls. Combination therapy was significantly more potent and the difference reached significance compared with gemcitabine treatment alone after 31 days for MIA PaCa-2 and 35 days for BxPC-3 and 46 days Panc1 (#P < 0.05 Student's t-test). (B) The median survival of BxPC-3, Panc1 and MIA PaCa-2 pancreatic tumors in each treatment group was constructed according to the Kaplan-Meier survival curve; n = 6 mice in each sub –group. The P values (*P, 0.05, **P, 0.01 vs the control group) for survival differences were determined applying log-rank testing (GraphPad Prism 4). CTR, vehicle control; Gemci, Gemcitabine; CPX, ciclopirox.
Figure 6
Figure 6. CPX monotherapy reduces cell proliferation levels, decreases pEFGR (Y1068) and pAKT (S473) levels in tumor cells more robustly in comparison with gemcitabine, however, abolishes gemcitabine-induced ROS levels in pancreatic tissues, in vivo
(A) Schematic representation of the experiment protocol; SCID mice bearing subcutaneous BxPC-3 Panc1 and MIA PaCa-2 tumor xenografts, were grouped into four groups, respectively (i) vehicle (n = 6); (ii) Gemcitabine alone (60 mg/kg) (n = 6); (iii) CPX alone (25 mg/kg) (n = 6);; (iv) Combination of gemcitabine (60mg/kg) and CPX (25 mg/kg) (n = 6);. (B) Representative images of Ki67-positive cells in tumor tissues from BxPC-3 Panc1 and MIA PaCa-2 tumor xenografts, on day 30 after treatment initiation, were assessed by confocal fluorescence microscopy. Red arrows indicate Ki67-positive cells (C) Mice were treated as described in Figure 6A. Tumors were harvested on day 30 of treatment for immunoblotting (three pooled samples per treatment / cell line for the experiment described in (A) and the indicated total and phosphorylated proteins were estimated by Western blot analysis of three independent experiments with similar results. (D) The levels of 8-hydroxy-2’ -deoxyguanosine (8-OHdG0 (arbitrary units, AU) were verified in the pancreatic tissues of BxPc3, Panc1 and MIA PaCa-2 tumor xenograft models, mice, respectively, treated with CPX and/or gemcitabine on day 30 as indicated in Figure 6A. (n = 6 per experimental group). *P < 0.05 (Student's t-test). All values are expressed as average ± S.D. CTR, vehicle control; Gemci, Gemcitabine; CPX, ciclopirox.

Similar articles

Cited by

References

    1. Siegel RL, Miller KD, Jemal A. Cancer statistics, 2017. CA: A Cancer Journal for Clinicians. 2017;67:7–30. - PubMed
    1. Adiseshaiah PP, Crist RM, Hook SS, McNeil SE. Nanomedicine strategies to overcome the pathophysiological barriers of pancreatic cancer. Nature Reviews Clinical Oncology. 2016;13:750–65. - PubMed
    1. Groot VP, van Santvoort HC, Rombouts SJE, Hagendoorn J, Borel Rinkes IHM, van Vulpen M, Herman JM, Wolfgang CL, Besselink MG, Molenaar IQ. Systematic review on the treatment of isolated local recurrence of pancreatic cancer after surgery; re-resection, chemoradiotherapy and SBRT. HPB (Oxford) 2017;19:83–92. - PubMed
    1. Davidson NE, Armstrong SA, Coussens LM, Cruz-Correa MR, DeBerardinis RJ, Doroshow JH, Foti M, Hwu P, Kensler TW, Morrow M, Mulligan CG, Pao W, Platz EA, et al. AACR Cancer Progress Report 2016. Clinical Cancer Research. American Association for Cancer Research. 2016;22:S1–S137. - PubMed
    1. Kamisawa T, Wood LD, Itoi T, Takaori K. Pancreatic cancer. The Lancet. 2016. pp. 73–85. - PubMed