. 2018 Jan 2;9(12):10417-10435.
doi: 10.18632/oncotarget.23824. eCollection 2018 Feb 13.

Epstein-Barr virus stably confers an invasive phenotype to epithelial cells through reprogramming of the WNT pathway

Affiliations

Epstein-Barr virus stably confers an invasive phenotype to epithelial cells through reprogramming of the WNT pathway

Christine E Birdwell et al. Oncotarget. .

Abstract

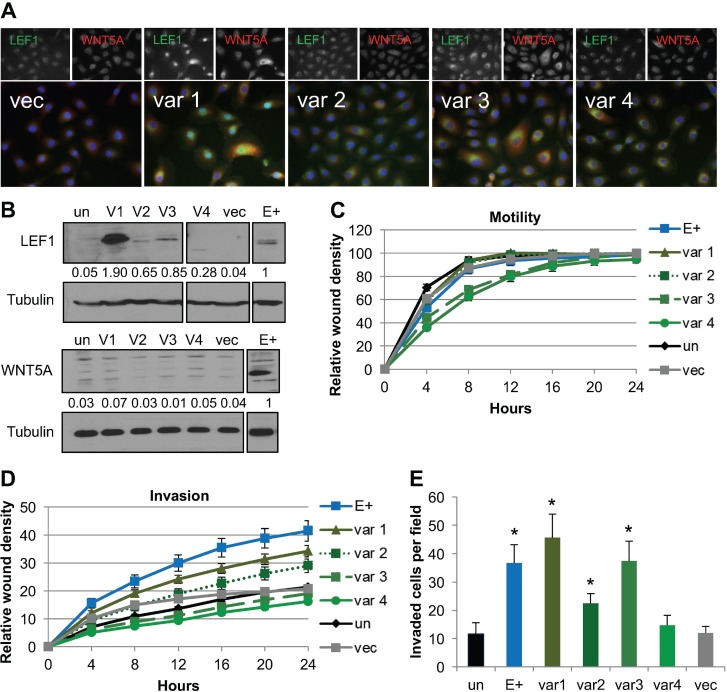
Epstein-Barr virus (EBV)-associated carcinomas, such as nasopharyngeal carcinoma (NPC), exhibit an undifferentiated and metastatic phenotype. To determine viral contributions involved in the invasive phenotype of EBV-associated carcinomas, EBV-infected human telomerase-immortalized normal oral keratinocytes (NOK) were investigated. EBV-infected NOK were previously shown to undergo epigenetic reprogramming involving CpG island hypermethylation and delayed responsiveness to differentiation. Here, we show that EBV-infected NOK acquired an invasive phenotype that was epigenetically retained after viral loss. The transcription factor lymphoid enhancer factor 1 (LEF1) and the secreted ligand WNT5A, expressed in NPC, were increased in EBV-infected NOK with sustained expression for more than 20 passages after viral loss. Increased LEF1 levels involved four LEF1 variants, and EBV-infected NOK showed a lack of responsiveness to β-catenin activation. Although forced expression of WNT5A and LEF1 enhanced the invasiveness of parental NOK, LEF1 knockdown reversed the invasive phenotype of EBV-infected NOK in the presence of WNT5A. Viral reprogramming of LEF1 and WNT5A was observed several passages after EBV infection, suggesting that LEF1 and WNT5A may provide a selective advantage to virally-infected cells. Our findings suggest that EBV epigenetically reprogrammed epithelial cells with features of basal, wound healing keratinocytes, with LEF1 contributing to the metastatic phenotype of EBV-associated carcinomas.

Keywords: Epstein-Barr virus; LEF1; WNT; epigenetics; invasion.


Conflict of interest statement

CONFLICTS OF INTEREST The authors declare no conflicts of interests

Figures

Figure 1
Figure 1. EBV-infected keratinocytes stably maintained an increased invasive phenotype
(A) Wound healing motility assay utilizing the IncuCyte Zoom microscope to monitor rate of wound closure. Shown is the average of four biological replicates analyzed in quadruplicate. Error bars represent the standard error of the mean (SEM). (B) Wound healing invasion assay through 1:10 growth factor reduced Matrigel® utilizing the IncuCyte Zoom microscope to measure the rate of wound closure. Shown is the average of four biological replicates each analyzed in triplicate with error bars representing the SEM. E+cl, E-cl1, E-cl3, and E-cl4 are all significantly more invasive than vector (p < 0.05) by area under the curve analysis followed by one-way ANOVA. (C) Transwell invasion assay through 1:10 Matrigel® with 500 nM LPA in the bottom well as a chemoattractant. The number of migrated cells per 10× field was counted at five random locations per transwell insert. Shown is the average number of invaded cells relative to uninfected in three biological replicates each analyzed in triplicate. Error bars are the SEM with * representing p < 0.05 compared to uninfected. (D) MTS proliferation assay in supplement free media. Shown is the average and SEM absorbance values of four biological replicates each in triplicate. un: uninfected, vec: vector control, E+cl: EBV-positive clone, E-cl1/3/4: EBV-negative transiently infected clones.
Figure 2
Figure 2. EBV-infected cells maintain increased LEF1 and WNT5A levels after loss of the viral genome
mRNA levels for LEF1 (A) and WNT5A (B) were quantified by RT-qPCR relative to a standard curve. mRNA levels were normalized first to the cellular control hHPRT, and compared to the uninfected parental NOK (un). Shown is the average of three biological replicates analyzed in duplicate and SEM. Representative western blot for LEF1 (C) and WNT5A (D). Tubulin is shown as a loading control. The position of the 50 kDa molecular weight marker is shown. Signal intensity was determined on ImageJ software from at least three independent biological replicates normalized to tubulin. Averaged signal intensity values were set relative to the EBV-positive clone (E+cl). un: uninfected, vec: vector control, E+cl: EBV-positive clone, E-cl1/3/4: EBV-negative transiently infected clones (tiEBV), *p value < 0.05 comparing EBV-infected to uninfected NOK controls.
Figure 3
Figure 3. Expression of WNT5A in EBV-negative NOK conferred increased invasion
(A) Representative immunofluorescence for WNT5A (red), LEF1 (green) and DAPI (blue). (B) Representative western blots for WNT5A (top) and LEF1 (bottom) with tubulin shown as a loading control. The average signal intensity of at least three biological replicates normalized to tubulin relative to the EBV-positive (E+) is shown. WNT5A stable cell lines (W), NOK transfected with empty vector (vec), uninfected, parental control NOK (un), EBV-positive NOK (E+) (C) Wound healing motility assay and (D) wound healing invasion assay for WNT5A stable cell lines compared to E+, vec, and un. Shown is the average of six biological replicates run in quadruplicate with error bars representing the SEM. WNT5A and E+ are statistically more invasive that the vector control cell lines (p ≤ 0.04). (E) Chemotactic transwell invasion assay. Shown is the average of six biological replicates analyzed in duplicate with error bars representing the SEM. *p value (p < 0.05) relative to uninfected control (un).
Figure 4
Figure 4. Forced expression of LEF1 variants 1, 2, and 3 enhanced invasion
(A) Representative immunofluorescence for LEF1 and WNT5A. LEF1 is shown in green, WNT5A in red, and DAPI in blue. (B) Representative Western blot for LEF1 (top) and WNT5A (bottom) with tubulin shown as a loading control. Numbers are the average signal intensity of at least three biological replicates normalized to tubulin with E+ set at 1. (C) Wound healing motility assay. Shown is the average of three biological replicates run in quadruplicate with error bars representing the SEM. (D) Wound healing invasion assay. Shown is the average of three biological replicates analyzed in quadruplicate and error bars are the SEM. Using area under the curve analysis, E+ and LEF1 variant 1 were statistically more invasive than vector control cells (p ≤ 0.02). (E) Chemotactic transwell invasion assay. Shown is the average of three biological replicates analyzed in duplicate and error bars are the SEM. *p ≤ 0.008 compared to un. Un: uninfected parental NOK, var1/2/3/4: LEF1 variant 1/2/3/4 transfected NOK, vec: NOK transfected with empty vector, E+: EBV-positive NOK.
Figure 5
Figure 5. Knockdown of LEF1 reverts the EBV-dependent invasive phenotype
(A) Representative western blot for LEF1 knockdown in E+cl cells. Tubulin is shown as a loading control. Numbers represent the average signal intensity of four biological replicates normalized to tubulin with E+cl set to 1. (B) Wound healing motility assay of LEF1 knockdowns in EBV-positive clone (E+cl). Shown is the average of four biological replicates analyzed in duplicate. Error bars are the SEM. (C) Wound healing invasion assay. Shown is the average of four biological replicates analyzed in duplicate. Error bars are the SEM. Area under the curve statistical analysis showed that uninfected and LEF1 siRNA knockdown cells were statistically less invasive than E+cl cells (p ≤ 0.02). (D) Chemotactic transwell invasion assay. Shown is the average of two biological replicates analyzed in duplicate. Invaded cells per 10× field were counted at five fields per insert. Error bars are the SEM. *p ≤ 0.01 compared to un. (E) Representative western blot of WNT5A in E+cl LEF1 knockdown cells. Tubulin is shown as a loading control. Values are the average signal intensity of three biological replicates normalized to tubulin with E+cl set to 1. (F) Representative immunofluorescence of WNT5A (red) and DAPI (blue) in E+cl LEF1 knockdown cells. Un: uninfected parental cells, E+cl: EBV-positive clone, VEH: E+cl treated with transfection reagent alone, siRNA A/B: two independent siRNAs targeting LEF1, siRNA nt: non-target siRNA.
Figure 6
Figure 6. EBV reprogramming of keratinocytes results in alternative response to canonical WNT signaling
Dual luciferase assay for LEF1/β-catenin activity. M50 Super 8× TOPFLASH luciferase plasmid (M50) contains 7 LEF1 response elements and the M51 Super 8× FOPFLASH plasmid (M51) contains 6 mutated LEF1 response elements upstream of luciferase reporter gene. LiCl (lithium chloride) was used to activate β-catenin and NaCl (sodium chloride) was used as a negative control. Values were normalized to renilla as a transfection control. Values are the average of four independent biological replicates and error bars are the SEM. Un: uninfected, E+cl: EBV-positive clone, var1/2/3/4: LEF1 variant 1/2/3/4 overexpressing cells, vec: vector control.
Figure 7
Figure 7. Upregulation of LEF1 in EBV-infected NOK is independent of AKT or NF-kB activity
(A) Analysis of AKT, ERK, and NF-kB activation in EBV-positive NOK in the presence (+GF) or absence (-GF) of growth factors supplements. Representative western blots are shown examining phosphorylation of AKT (P-AKT S473); and ERK (P-ERK T202/Y204). The levels of the IkBα inhibitor of NF-kB is also shown. The total protein levels of AKT, ERK, and p65 are shown. Tubulin served as an additional loading control. (B) The ratio of P-AKT to total AKT (top panels) and total AKT to tubulin (bottom panels) is shown. (C) Effect of the PI3K inhibitor, LY294002, on LEF1 protein levels. Increasing concentration of LY294002 was used and the levels of LEF1 protein were measured. The level of P-AKT was used as an indicator for inhibition of AKT activity. Shown are representative blots for LEF1, P-AKT, AKT, and tubulin. (D) Effect of Bay11 on LEF1 transcript levels. qRT-PCR was used to measure LEF1 transcript levels with 2.5 and 5 uM of Bay11. (E) Immunofluorescence to visualize p65 localization. Un: uninfected, parental NOK, vec: vector control, E+cl: EBV-positive NOK, E-cl: EBV-negative transiently infected cl3.
Figure 8
Figure 8. LEF1 and WNT5A upregulation are late events after EBV infection of keratinocytes
(A) RT-qPCR for LEF1 (blue) and WNT5A (orange) in EBV-infected NOK over serial passages. Values are the average fold increase over uninfected of three biological replicates (except for the final point which is one replicate) run in duplicate. Error bars are the SEM. Representative western blot for (B) LEF1 and (C) WNT5A in EBV-infected NOK over indicated serial passages (numbers). Tubulin is shown as a loading control. Un+EBV: NOK newly infected with EBV, E+: EBV-positive NOK late passage, un: uninfected parental NOK.

Similar articles

Cited by

References

    1. Wei WI, Sham JS. Nasopharyngeal carcinoma. Lancet. 2005;365:2041–54. https://doi.org/10.1016/S0140-6736(05)66698-6 - DOI - PubMed
    1. Chan AS, To KF, Lo KW, Mak KF, Pak W, Chiu B, Tse GM, Ding M, Li X, Lee JC, Huang DP. High frequency of chromosome 3p deletion in histologically normal nasopharyngeal epithelia from southern Chinese. Cancer Res. 2000;60:5365–70. - PubMed
    1. Henle W, Henle G. Evidence for a relation of Epstein-Barr virus to Burkitt's lymphoma and nasopharyngeal carcinoma. Bibl Haematol. 1970. pp. 706–13. - PubMed
    1. Pathmanathan R, Prasad U, Sadler R, Flynn K, Raab-Traub N. Clonal proliferations of cells infected with Epstein-Barr virus in preinvasive lesions related to nasopharyngeal carcinoma. N Engl J Med. 1995;333:693–8. https://doi.org/10.1056/NEJM199509143331103 - DOI - PubMed
    1. zur Hausen H, Schulte-Holthausen H, Klein G, Henle W, Henle G, Clifford P, Santesson L. EBV DNA in biopsies of Burkitt tumours and anaplastic carcinomas of the nasopharynx. Nature. 1970;228:1056–8. - PubMed