. 2018 Mar 9:3:6.
doi: 10.1038/s41392-018-0009-6. eCollection 2018.

Detection of PRMT1 inhibitors with stopped flow fluorescence

Affiliations

Detection of PRMT1 inhibitors with stopped flow fluorescence

Kun Qian et al. Signal Transduct Target Ther. .

Abstract

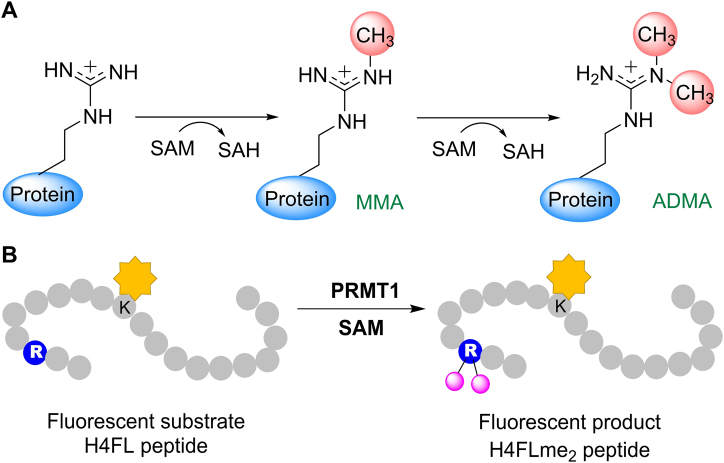
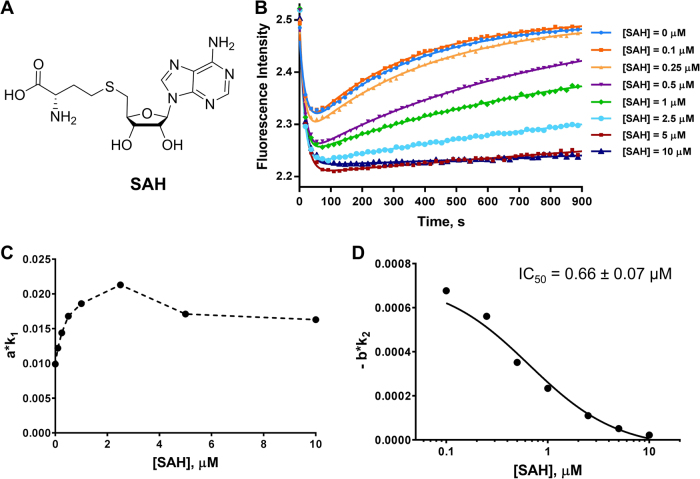
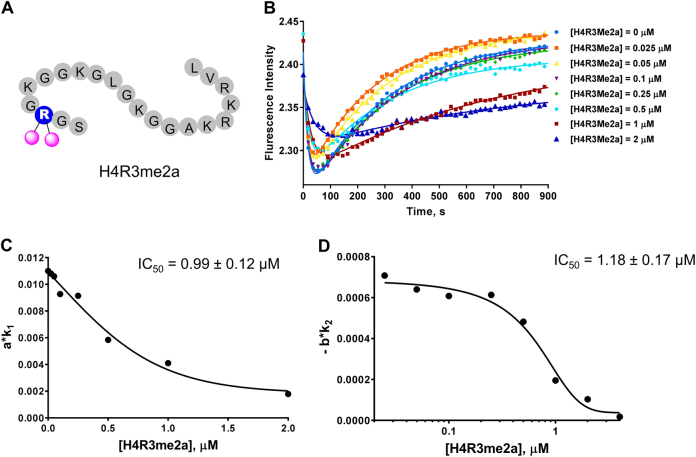
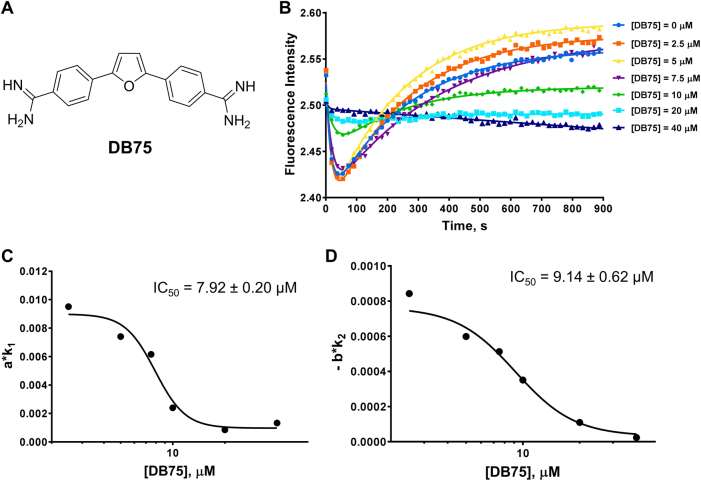
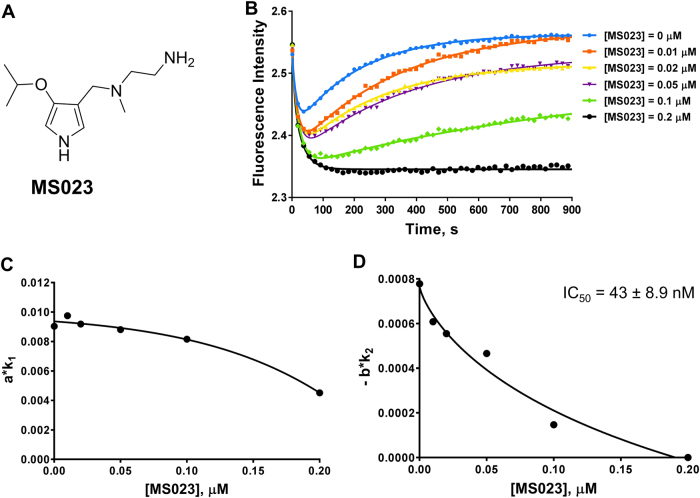
Protein arginine methyltransferases (PRMTs) are crucial epigenetic regulators in eukaryotic organisms that serve as histone writers for chromatin remodeling. PRMTs also methylate a variety of non-histone protein substrates to modulate their function and activity. The development of potent PRMT inhibitors has become an emerging and imperative research area in the drug discovery field to provide novel therapeutic agents for treating diseases and as tools to investigate the biological functions of PRMTs. PRMT1 is the major type I enzyme that catalyzes the formation of asymmetric dimethyl arginine, and PRMT1 plays important regulatory roles in signal transduction, transcriptional activation, RNA splicing, and DNA repair. Aberrant expression of PRMT1 is found in many types of cancers, pulmonary diseases, cardiovascular disease, diabetes, and renal diseases. PRMT1 is a highly promising target for therapeutic development. We created a stopped flow fluorescence-based assay for PRMT1 inhibitor detection and characterization that has the advantages of being homogeneous, nonradioactive, and mix-and-measure in nature, allowing for continuous measurement of the methylation reaction and its inhibition. To our knowledge, this is the first continuous assay for PRMT1 reaction detection and inhibitor characterization. The approach is not only capable of quantitatively determining the potency (IC50) of PRMT1 inhibitors but can also distinguish cofactor-competitive inhibitors, substrate-competitive inhibitors, and mixed-type inhibitors.


Conflict of interest statement

The authors declare no competing financial interests.

Figures

Fig. 1
Fig. 1
Arginine methylation by PRMT1. a PRMT1-mediated methylation reaction. b Use of the fluorescent peptide H4FL to study PRMT1-mediated arginine methylation
Fig. 2
Fig. 2
Time course of PRMT1 methylation (1–900 s). The raw data (total of 10,000 points) are shown as blue dots. The curve fitted by equation 2 is shown as a solid black line, which is the average of 4 or 5 replicates. A magnified view of 1–100 s is shown on the side. The concentrations of the enzyme, cofactor and substrate are as follows: [PRMT1] = 0.2 µM, [SAM] = 3.5 µM, [H4FL] = 0.4 µM
Fig. 3
Fig. 3
Time course of PRMT1 methylation with varied enzyme concentrations. a The curves were fitted with equation 2 to generate the values in Table S1A. Each fitting curve used 10,000 data points, but only 50 data points are shown. Each curve is the average of 4 to 6 replicates. b shows the simulation results from the values in Table S1A at fixed c = 1. c, d represent the relationship of the slope values (a·k1 and b·k2) with varying concentrations of PRMT1 (values listed in Table S1B). The linear fitting curves are shown as solid black lines. The concentrations of the cofactor and the substrate were fixed at [SAM] = 3.5 µM and [H4FL] = 0.4 µM in these experiments
Fig. 4
Fig. 4
Time course of PRMT1 methylation with varied cofactor concentrations. a The curves were fitted with equation 2 to generate the values in Table S2A. Each fitting curve used 10,000 data points, but only 50 data points are shown. Each curve is the average of 4 to 6 replicates. b The simulation results from the values in Table S2A at fixed c = 1. c, d The relationship of slope values (a·k1 and b·k2) with varying concentrations of SAM (values listed in Table S2B). The linear fitting curves are shown as solid black lines. The concentrations of the enzyme and the substrate were fixed at [PRMT1] = 0.4 µM and [H4FL] = 0.4 µM in these experiments
Fig. 5
Fig. 5
Stopped flow fluorescence assay of the cofactor-competitive inhibitor SAH. a Structure of SAH. In b, the curves were fitted with equation 2 to generate the values in Table S3A. Each curve used 10,000 data points, but only 50 data points are shown. Each curve is the average of 4 to 6 replicates. c, d represent the relationships of a·k1 and b·k2 with inhibitor concentrations (values listed in Table S3B). In D, the IC50 was calculated using equation 1. The reaction conditions used for all the experiments were [PRMT1] = 0.2 µM, [SAM] = 3.5 µM, and [H4FL] = 0.4 µM, with varying concentrations of SAH
Fig. 6
Fig. 6
Stopped flow fluorescence assay of the substrate-competitive inhibitor H4R3Me2a. a Illustration of H4R3Me2a. In b, the curves were fitted with equation 2 to generate the values in Table S5A. Each curve used 10,000 data points, but only 50 data points are shown. Each curve is the average of 4 to 6 replicates. c and d represent the relationships of a·k1 and b·k2 with inhibitor concentrations (values listed in Table S5B). In c and d, the IC50 was calculated using equation 1. The reaction conditions used for all experiments were [PRMT1] = 0.2 µM, [SAM] = 3.5 µM, and [H4FL] = 0.4 µM, with varying concentrations of H4R3Me2a
Fig. 7
Fig. 7
Stopped flow fluorescence assay of DB75. a Structure of DB75. In b, the curves were fitted with equation 2 to generate the values in Table S6A. Each curve used 10,000 data points, but only 50 data points are shown. Each curve is the average of 4 to 6 replicates. In c and d, the IC50 was calculated using equation 1. The reaction conditions used for all experiments were [PRMT1] = 0.2 µM, [SAM] = 3.5 µM, and [H4FL] = 0.4 µM, with varying concentrations of DB75
Fig. 8
Fig. 8
Stopped flow fluorescence assay of MS023. a Structure of MS023. In b, the curves were fitted with equation 2 to generate the values in Table S7A. Each curve used 10,000 data points, but only 50 data points are shown. Each curve is the average of 4 to 6 replicates. In c and d, the IC50 was calculated using equation 1. The reaction conditions used for all experiments were [PRMT1] = 0.2 µM, [SAM] = 3.5 µM, and [H4FL] = 0.4 µM, with varying concentrations of MS023

References

    1. Di Lorenzo A, Bedford MT. Histone arginine methylation. FEBS Lett. 2011;585:2024–2031. doi: 10.1016/j.febslet.2010.11.010. - DOI - PMC - PubMed
    1. Morales Y, Cáceres T, May K, Hevel JM. Biochemistry and regulation of the protein arginine methyltransferases (PRMTs) Arch. Biochem. Biophys. 2016;590:138–152. doi: 10.1016/j.abb.2015.11.030. - DOI - PubMed
    1. Bedford MT. Arginine methylation at a glance. J. Cell. Sci. 2007;120:4243–4246. doi: 10.1242/jcs.019885. - DOI - PubMed
    1. Dhar S, et al. Loss of the major Type I arginine methyltransferase PRMT1 causes substrate scavenging by other PRMTs. Sci. Rep. 2013;3:1311. doi: 10.1038/srep01311. - DOI - PMC - PubMed
    1. Yang Y, Bedford MT. Protein arginine methyltransferases and cancer. Nat. Rev. Cancer. 2013;13:37–50. doi: 10.1038/nrc3409. - DOI - PubMed

Publication types

LinkOut - more resources