

Estimation of causal effect measures with the R-package stdReg
- PMID: 29536223
- PMCID: PMC6133040
- DOI: 10.1007/s10654-018-0375-y
Estimation of causal effect measures with the R-package stdReg
Abstract
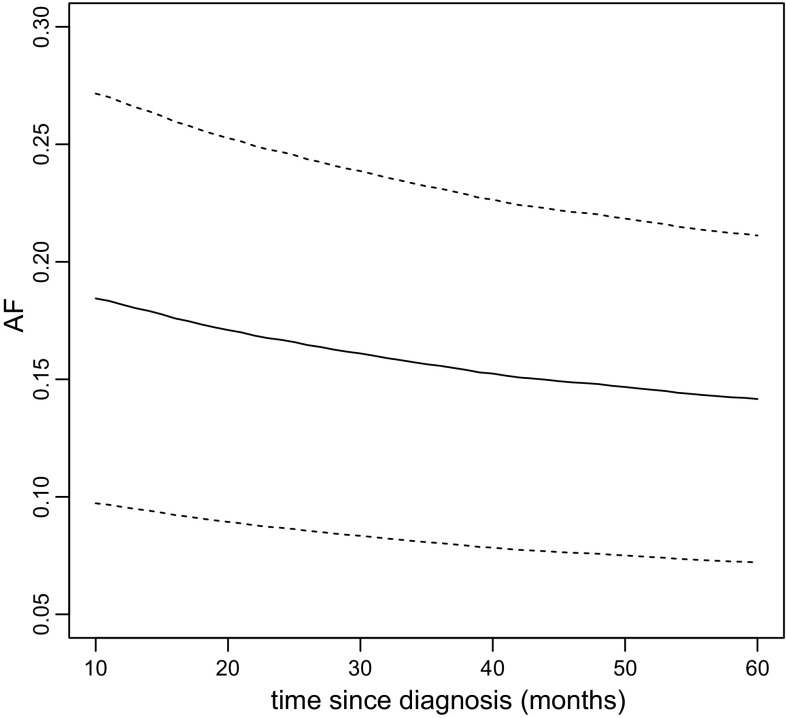
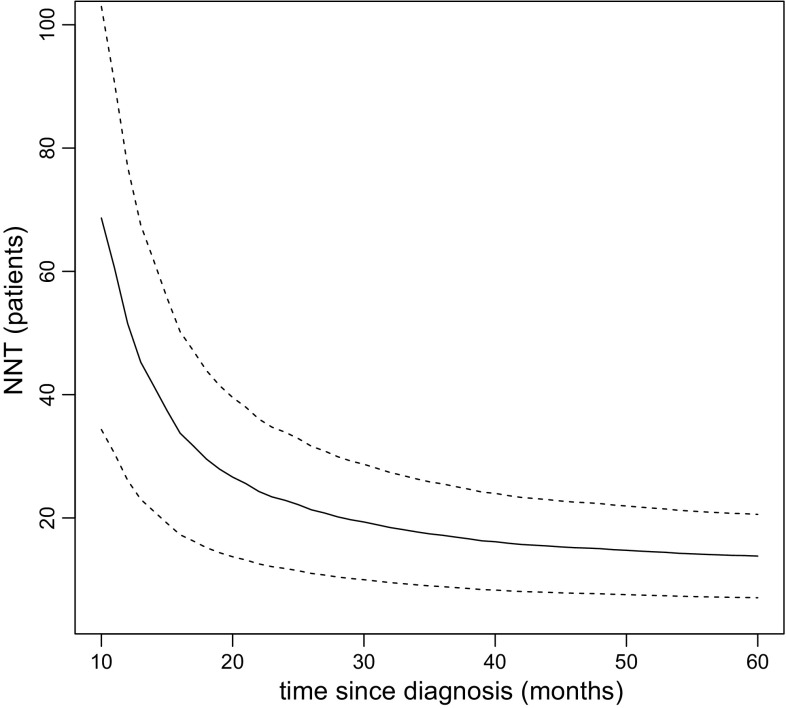
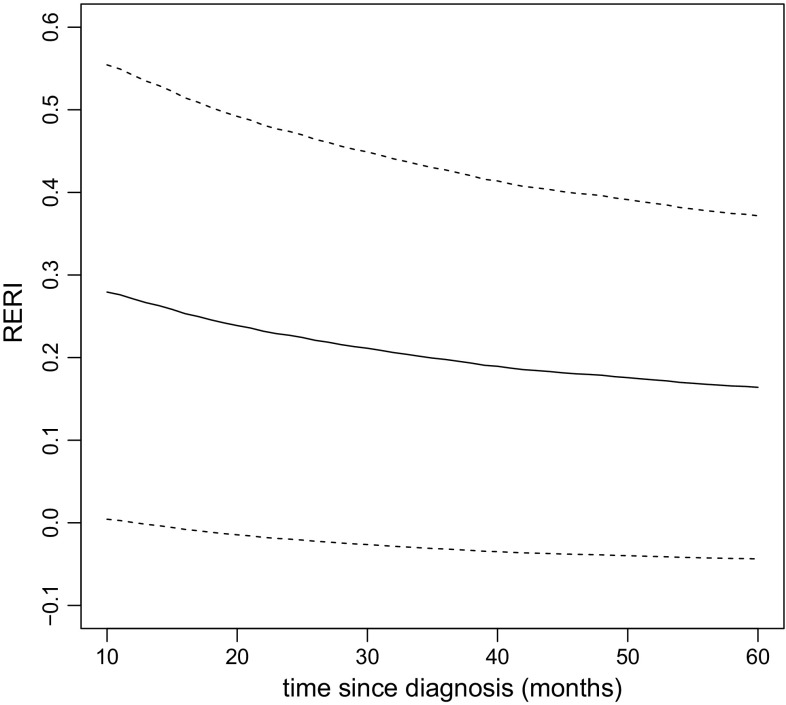
Measures of causal effects play a central role in epidemiology. A wide range of measures exist, which are designed to give relevant answers to substantive epidemiological research questions. However, due to mathematical convenience and software limitations most studies only report odds ratios for binary outcomes and hazard ratios for time-to-event outcomes. In this paper we show how logistic regression models and Cox proportional hazards regression models can be used to estimate a wide range of causal effect measures, with the R-package stdReg. For illustration we focus on the attributable fraction, the number needed to treat and the relative excess risk due to interaction. We use two publicly available data sets, so that the reader can easily replicate and elaborate on the analyses. The first dataset includes information on 487 births among 188 women, and the second dataset includes information on 2982 women diagnosed with primary breast cancer.
Keywords: Attributable fraction; Causal effect; Cox proportional hazards regression; Logistic regression; Number needed to treat; Relative excess risk due to interaction.
Figures
Similar articles
-
Regression standardization with the R package stdReg.Eur J Epidemiol. 2016 Jun;31(6):563-74. doi: 10.1007/s10654-016-0157-3. Epub 2016 May 14. Eur J Epidemiol. 2016. PMID: 27179798
-
Application of Standardization for Causal Inference in Observational Studies: A Step-by-step Tutorial for Analysis Using R Software.J Prev Med Public Health. 2022 Mar;55(2):116-124. doi: 10.3961/jpmph.21.569. Epub 2022 Feb 11. J Prev Med Public Health. 2022. PMID: 35391523 Free PMC article.
-
Model-based estimation of measures of association for time-to-event outcomes.BMC Med Res Methodol. 2014 Aug 9;14:97. doi: 10.1186/1471-2288-14-97. BMC Med Res Methodol. 2014. PMID: 25106903 Free PMC article.
-
[Number needed to treat: Interpretation and estimation in multivariable analyses and censored data].Med Clin (Barc). 2014 May 20;142(10):451-6. doi: 10.1016/j.medcli.2013.05.003. Epub 2013 Jul 11. Med Clin (Barc). 2014. PMID: 23850150 Review. Spanish.
-
Epidemiology of breastfeeding: advances and multidisciplinary applications.Adv Exp Med Biol. 2004;554:45-59. Adv Exp Med Biol. 2004. PMID: 15384566 Review.
Cited by
-
Investigating Modifiable Factors Associated with Cognitive Decline: Insights from the UK Biobank.Biomedicines. 2025 Feb 21;13(3):549. doi: 10.3390/biomedicines13030549. Biomedicines. 2025. PMID: 40149525 Free PMC article.
-
Contribution of causal factors to disease burden: how to interpret attributable fractions.Breathe (Sheff). 2021 Dec;17(4):210086. doi: 10.1183/20734735.0086-2021. Breathe (Sheff). 2021. PMID: 35035565 Free PMC article.
-
Co-benefits from sustainable dietary shifts for population and environmental health: an assessment from a large European cohort study.Lancet Planet Health. 2021 Nov;5(11):e786-e796. doi: 10.1016/S2542-5196(21)00250-3. Epub 2021 Oct 22. Lancet Planet Health. 2021. PMID: 34688354 Free PMC article.
-
Moving beyond risk ratios in sibling analysis: estimating clinically useful measures from family-based analysis.medRxiv [Preprint]. 2025 May 16:2025.05.16.25327702. doi: 10.1101/2025.05.16.25327702. medRxiv. 2025. PMID: 40463571 Free PMC article. Preprint.
-
Effectiveness of nationwide programmatic testing and treatment for latent tuberculosis infection in migrants in England: a retrospective, population-based cohort study.Lancet Public Health. 2022 Apr;7(4):e305-e315. doi: 10.1016/S2468-2667(22)00031-7. Epub 2022 Mar 23. Lancet Public Health. 2022. PMID: 35338849 Free PMC article.
References
-
- Holcomb W, Jr, Chaiworapongsa T, Luke D, Burgdorf K. An odd measure of risk: use and misuse of the odds ratio. Obstet Gynecol. 2001;98(4):685–688. - PubMed
-
- VanderWeele T, Knol M. A tutorial on interaction. Epidemiol Methods. 2014;3(1):33–72.
-
- Rothman K, Greenland S, Lash T. Modern epidemiology. 3. Philadelphia: Lippincott Williams & Wilkins; 2008.
MeSH terms
Grants and funding
LinkOut - more resources
Full Text Sources
Other Literature Sources
