. 2018 May;29(5):1012-1020.
doi: 10.1007/s13361-018-1899-9. Epub 2018 Mar 13.

Single-Cell Mass Spectrometry Reveals Changes in Lipid and Metabolite Expression in RAW 264.7 Cells upon Lipopolysaccharide Stimulation

Affiliations

Single-Cell Mass Spectrometry Reveals Changes in Lipid and Metabolite Expression in RAW 264.7 Cells upon Lipopolysaccharide Stimulation

Bo Yang et al. J Am Soc Mass Spectrom. 2018 May.

Abstract

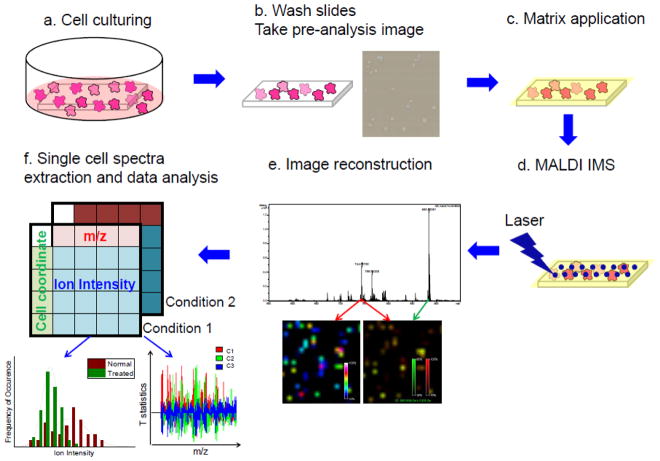
It has been widely recognized that individual cells that exist within a large population of cells, even if they are genetically identical, can have divergent molecular makeups resulting from a variety of factors, including local environmental factors and stochastic processes within each cell. Presently, numerous approaches have been described that permit the resolution of these single-cell expression differences for RNA and protein; however, relatively few techniques exist for the study of lipids and metabolites in this manner. This study presents a methodology for the analysis of metabolite and lipid expression at the level of a single cell through the use of imaging mass spectrometry on a high-performance Fourier transform ion cyclotron resonance mass spectrometer. This report provides a detailed description of the overall experimental approach, including sample preparation as well as the data acquisition and analysis strategy for single cells. Applying this approach to the study of cultured RAW264.7 cells, we demonstrate that this method can be used to study the variation in molecular expression with cell populations and is sensitive to alterations in that expression that occurs upon lipopolysaccharide stimulation. Graphical Abstract.

Keywords: Heterogeneity; Imaging mass spectrometry; Lipids and metabolites; MALDI; Single cell.


Figures

Figure 1
Figure 1
Single cell analysis performed by imaging mass spectrometry. (a) Raw 264.7 cells are grown on glass microscope slides; multiple growth conditions can be used to examine their influence on single cell molecular expression. (b) The glass slide is removed from media, and the adherent cells are washed to remove residual culture media. Cells are imaged in a slide scanner to record their relative position on the plate. (c) MALDI matrix is applied to the sample target. (d) MALDI IMS is performed by rastering the laser across the field of cells, recording mass spectra at each discrete location. (e) Ion abundance data can be extracted to visualize differences in cellular expression across the cell population. MALDI ion images are registered to the optical image. (f) Mass spectra that were acquired from single cells are extracted. The individual ion abundances are extracted to facilitate further analysis and visualization.
Figure 2
Figure 2
Screen capture of the single cell spectra extraction software. (a) Spectrum display of a selected position. (b) Pre-analysis cell image. Green circles are single pixels corresponding to identified cell positions. (c) Coordinates of the 4 corners of analyzed region indicated by the white dashed-line box. (d) Coordinates of pixels.
Figure 3
Figure 3
MALDI IMS of normal RAW 264.7 cells. (a.) High resolution pre-analysis cell image. (b.) Ion image corresponding to m/z = 885.55 of the sample area as in (a). (c.) and (d.) Representative single cell spectra extracted from two individual single cells highlighted in red and green circles in part (a.), respectively. (b)–(d) demonstrate heterogeneous molecular expression of each molecular species.
Figure 4
Figure 4
PCA score plot between the two cell conditions in the third principal component (PC3) (top). PC3 loadings plot of the top 10 most negative and positively loaded peaks (bottom).
Figure 5
Figure 5
Histograms of ion abundances of m/z = 885.55 and 861.55, and 777.56 from normal (n=60) and LPS stimulated (n=70) RAW 264.7 cells. These results show that LPS stimulation selectively influences the expression of selected molecular species (b) m/z 885.55 and (c) m/z 861.55), shifting both the position of the mean and altering the shape of the distribution of ion abundance. The ion at m/z 777.56 shows no evidence of altered expression upon LPS stimulation.

References

    1. Cai L, Friedman N, Xie XS. Stochastic protein expression in individual cells at the single molecule level. Nature. 2006;440:5. - PubMed
    1. Zenobi R. Single-cell metabolomics: analytical and biological perspectives. Science. 2013;342:1243259. - PubMed
    1. Elowitz MB, Levine AJ, Siggia ED, Swain PS. Stochastic gene expression in a single cell. Science. 2002;297:4. - PubMed
    1. Jansson ET, Comi TJ, Rubakhin SS, Sweedler JV. Single Cell Peptide Heterogeneity of Rat Islets of Langerhans. ACS Chem Biol. 2016;11:8. - PMC - PubMed
    1. Lidstrom ME, Konopka MC. The role of physiological heterogeneity in microbial population behavior. Nat Chem Biol. 2010;6:8. - PubMed

LinkOut - more resources