. 2018 Jul;39(7):2842-2858.
doi: 10.1002/hbm.24044. Epub 2018 Mar 13.

Reproducible network and regional topographies of abnormal glucose metabolism associated with progressive supranuclear palsy: Multivariate and univariate analyses in American and Chinese patient cohorts

Affiliations

Reproducible network and regional topographies of abnormal glucose metabolism associated with progressive supranuclear palsy: Multivariate and univariate analyses in American and Chinese patient cohorts

Jingjie Ge et al. Hum Brain Mapp. 2018 Jul.

Abstract

Progressive supranuclear palsy (PSP) is a rare movement disorder and often difficult to distinguish clinically from Parkinson's disease (PD) and multiple system atrophy (MSA) in early phases. In this study, we report reproducible disease-related topographies of brain network and regional glucose metabolism associated with PSP in clinically-confirmed independent cohorts of PSP, MSA, and PD patients and healthy controls in the USA and China. Using 18 F-FDG PET images from PSP and healthy subjects, we applied spatial covariance analysis with bootstrapping to identify a PSP-related pattern (PSPRP) and estimate its reliability, and evaluated the ability of network scores for differential diagnosis. We also detected regional metabolic differences using statistical parametric mapping analysis. We produced a highly reliable PSPRP characterized by relative metabolic decreases in the middle prefrontal cortex/cingulate, ventrolateral prefrontal cortex, striatum, thalamus and midbrain, covarying with relative metabolic increases in the hippocampus, insula and parieto-temporal regions. PSPRP network scores correlated positively with PSP duration and accurately discriminated between healthy, PSP, MSA and PD groups in two separate cohorts of parkinsonian patients at both early and advanced stages. Moreover, PSP patients shared many overlapping areas with abnormal metabolism in the same cortical and subcortical regions as in the PSPRP. With rigorous cross-validation, this study demonstrated highly comparable and reproducible PSP-related metabolic topographies at network and regional levels across different patient populations and PET scanners. Metabolic brain network activity may serve as a reliable and objective marker of PSP, although cross-validation applying recent diagnostic criteria and classification is warranted.

Keywords: PET; differential diagnosis; disease-related brain network markers; movement disorders; multivariate and univariate brain mapping methods; parkinsonism.


Conflict of interest statement

D. E. serves on the scientific advisory board for and has received honoraria from the Michael J. Fox Foundation for Parkinson's Research; serves on the editorial board of Annals of Neurology and Journal of Nuclear Medicine and as Associate Editor for The Journal of Neuroscience; and is listed as coinventor of patents re: Markers for use in screening patients for nervous system dysfunction and a method and apparatus for using same, without financial gain; and has received research support from the NIH (NINDS, NIDCD, NIAID), the Dana Foundation, the Bachmann‐Strauss Dystonia and Parkinson Foundation, and CHDI Foundation. Y. M. has received research funding from the NIH. All other authors have no disclosures/conflicts to report.

Figures

Figure 1
Figure 1
PSP‐related pattern (PSPRP) identified by spatial covariance analysis of 18F‐FDG PET scans from PSP patients and healthy controls in both American and Chinese cohorts. (a) This pattern was characterized by decreased (blue) metabolic activity in the bilateral middle prefrontal cortex (PFC)/cingulate, ventrolateral prefrontal cortex (VLPFC), striatum, thalamus and midbrain, covarying with increased (red) metabolic activity in the hippocampus/parahippocampus and parieto‐temporal cortices. The overlays are depicted in neurological orientation. The thresholds of the color bars represent Z‐values. (b) The topography of PSPRP was reliable as estimated by a voxelwise bootstrapping algorithm in conjunction with spatial covariance analysis in the combined cohort. The displays represent the maps of inverse coefficient of variation (ICV) thesholded at < .001 following 1,000 iterations over the whole brain. (c) The expression of PSPRP discriminated the PSP patients from the healthy controls (i.e., NL) as well as from the MSA and PD patients (< .0001; post‐hoc tests). Network scores were also elevated in the MSA patients compared with the healthy controls and PD patients, but much lower than those in the PSP patients (< .0001). The error bars represent standard deviations. (d) Receiver operating characteristic (ROC) analysis revealed different levels of group discrimination by subject scores of PSPRP. The graph displays the fitted ROC curves for improved visualization
Figure 2
Figure 2
Differential diagnosis by subject scores of PSPRP in an independent Chinese cohort of healthy controls and parkinsonian patients at early stages. (a) The expression of PSPRP discriminated the PSP patients from the healthy controls (i.e., NL) as well as from the MSA and PD patients (< .0001; post‐hoc tests). There were no differences in network scores between the MSA and PD patients or compared with the healthy controls. (b) Receiver operating characteristic (ROC) analysis revealed different levels of group discrimination by subject scores of PSPRP. The graph displayed the fitted ROC curves for improved visualization. The error bars represented standard deviations [Color figure can be viewed at http://wileyonlinelibrary.com]
Figure 3
Figure 3
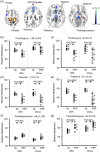
Brain regions with significant metabolic differences in PSP patients compared with healthy controls detected by SPM analysis of 18F‐FDG PET scans in both American and Chinese cohorts. (a) Normalized glucose metabolism in the PSP patients decreased (blue) in the middle prefrontal cortex (PFC)/cingulate, ventrolateral prefrontal cortex, striatum, thalamus and midbrain, but increased (red) in the hippocampus/parahippocampus and parieto‐temporal regions compared to normal (NL) subjects (< .001). The overlays are depicted in neurological orientation. The thresholds of the color bars represent t values. (b–g) Group differences in relative metabolic values in select cortical and subcortical regions, obtained post‐hoc in spherical volumes of interest (4 mm radius) centered at the peak coordinates of clusters deemed significant from the prior SPM analysis on a voxel‐by‐voxel basis. The metabolic values in the healthy controls or the PSP patients were separated into different sites so as to visualize their reproducibility across both cohorts. The error bars represent standard deviations [Color figure can be viewed at http://wileyonlinelibrary.com]
Figure 4
Figure 4
PSP‐related pattern (PSPRP) identified by spatial covariance analysis of 18F‐FDG PET scans from PSP patients and healthy controls in the American cohort. (a) This pattern was characterized bilaterally by decreased (blue) metabolic activity in the middle prefrontal cortex (PFC)/cingulate, ventrolateral prefrontal cortex (VLPFC), striatum, thalamus and midbrain, along with increased (red) metabolic activity in the hippocampus/parahippocampus and parieto‐temporal cortices. The overlays are depicted in neurological orientation. The thresholds of the color bars represent Z‐values. (b) The expression of PSPRP discriminated the PSP patients from the healthy controls (i.e., NL) in both American and Chinese cohorts (< .0001; post‐hoc tests). The error bars represent standard deviations. (c) Individual scores in the same cohort correlated highly across both healthy controls and PSP patients used for the identification of PSPRP in the USA and for the validation of PSPRP in China
Figure 5
Figure 5
PSP‐related pattern (PSPRP) identified by spatial covariance analysis of 18F‐FDG PET scans from PSP patients and healthy controls in the Chinese cohort. (a) This pattern was characterized bilaterally by decreased (blue) metabolic activity in the middle prefrontal cortex (PFC)/cingulate, ventrolateral prefrontal cortex (VLPFC), striatum, thalamus and midbrain, associated with increased (red) metabolic activity in the hippocampus/parahippocampus and parieto‐temporal cortices. The overlays are depicted in neurological orientation. The thresholds of the color bars represent Z‐values. (b) The expression of PSPRP discriminated the PSP patients from the healthy controls (i.e., NL) in both American and Chinese cohorts (< .0001; post‐hoc tests). The error bars represent standard deviations. (c) Individual scores in the same cohort correlated highly across both healthy controls and PSP patients used for the identification of PSPRP in China and for the validation of PSPRP in the USA
Figure 6
Figure 6
Brain regions with similar abnormal metabolism in PSP patients relative to healthy controls detected by conjunction analysis of 18F‐FDG PET scans with SPM across the American and Chinese cohorts. (a) Metabolism in the PSP patients decreased (blue) in the middle prefrontal cortex (PFC)/cingulate, ventrolateral prefrontal cortex (VLPFC), striatum, thalamus and midbrain, but increased (red) in the hippocampus as well as parieto‐temporal regions compared to normal (NL) subjects (< .001). The thresholds of the color bars represent t values. (b–g) Group differences in relative metabolic values in select cortical and subcortical regions, obtained post‐hoc in spherical volumes of interest (4 mm radius) centered at the peak coordinates of clusters deemed significant from the prior SPM analysis on a voxel‐by‐voxel basis. The error bars represent standard deviations [Color figure can be viewed at http://wileyonlinelibrary.com]
Figure 7
Figure 7
Brain regions with different abnormal metabolism in PSP patients relative to healthy controls detected by interaction analysis of 18F‐FDG PET scans with SPM across the American and Chinese cohorts. (a) Metabolism in the PSP patients increased (red) in the middle occipital gyrus/cuneus versus normal subjects (NL) in the American cohort (< .001) compared to the group difference in the Chinese cohort. The thresholds of the color bars represent t values. (b) Group differences in relative metabolic values in this region, obtained post‐hoc in spherical volumes of interest (4 mm radius) centered at the peak coordinates of clusters deemed significant from the prior SPM analysis on a voxel‐by‐voxel basis. The error bars represent standard deviations [Color figure can be viewed at http://wileyonlinelibrary.com]

Similar articles

Cited by

References

    1. Agosta, F. , Kostic, V. S. , Galantucci, S. , Mesaros, S. , Svetel, M. , Pagani, E. , … Filippi, M. (2010). The in vivo distribution of brain tissue loss in Richardson's syndrome and PSP‐parkinsonism: A VBM‐DARTEL study. The European Journal of Neuroscience, 32(4), 640–647. 10.1111/j.1460-9568.2010.07304.x - DOI - PubMed
    1. Albin, R. L. , Young, A. B. , & Penney, J. B. (1989). The functional anatomy of basal ganglia disorders. Trends in Neurosciences, 12(10), 366–375. - PubMed
    1. Amtage, F. , Maurer, C. , Hellwig, S. , Tuscher, O. , Kreft, A. , Weiller, C. , … Meyer, P. T. (2014). Functional correlates of vertical gaze palsy and other ocular motor deficits in PSP: An FDG‐PET study. Parkinsonism & Related Disorders, 20(8), 898–906. 10.1016/j.parkreldis.2014.05.013 - DOI - PubMed
    1. Anderson, T. J. , Jenkins, I. H. , Brooks, D. J. , Hawken, M. B. , Frackowiak, R. S. , & Kennard, C. (1994). Cortical control of saccades and fixation in man. A PET study. Brain, 117(5), 1073–1084. - PubMed
    1. Asanuma, K. , Tang, C. , Ma, Y. , Dhawan, V. , Mattis, P. , Edwards, C. , … Eidelberg, D. (2006). Network modulation in the treatment of Parkinson's disease. Brain: A Journal of Neurology, 129(Pt 10), 2667–2678. 10.1093/brain/awl162 - DOI - PMC - PubMed

Publication types

MeSH terms