. 2018 Mar;6(5):e13641.
doi: 10.14814/phy2.13641.

Most bicarbonate secretion by Calu-3 cells is mediated by CFTR and independent of pendrin

Affiliations

Most bicarbonate secretion by Calu-3 cells is mediated by CFTR and independent of pendrin

Junwei Huang et al. Physiol Rep. 2018 Mar.

Abstract

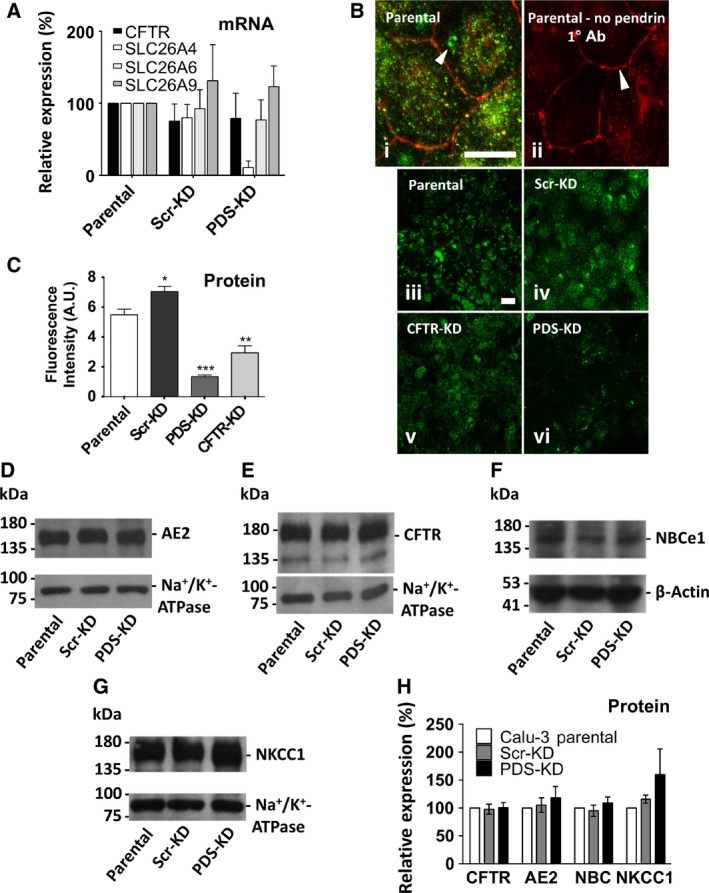
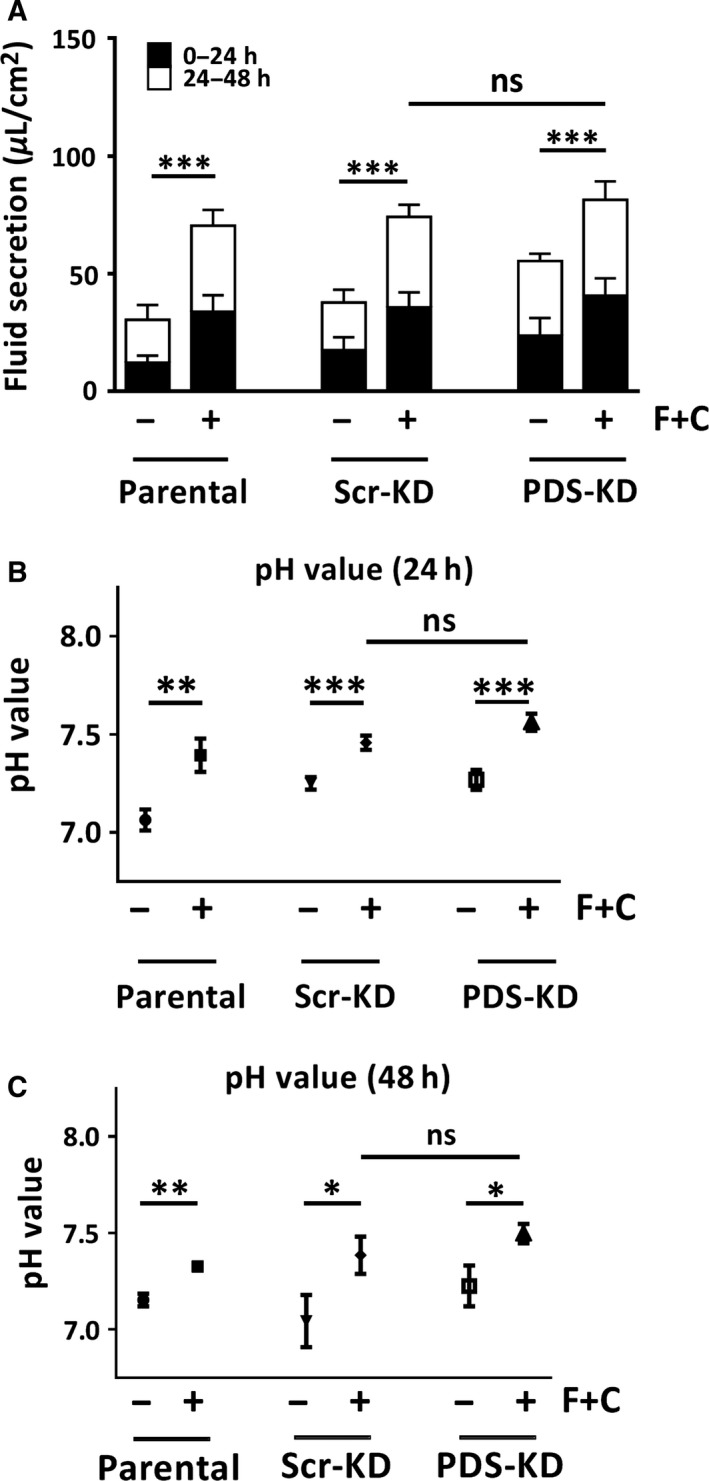
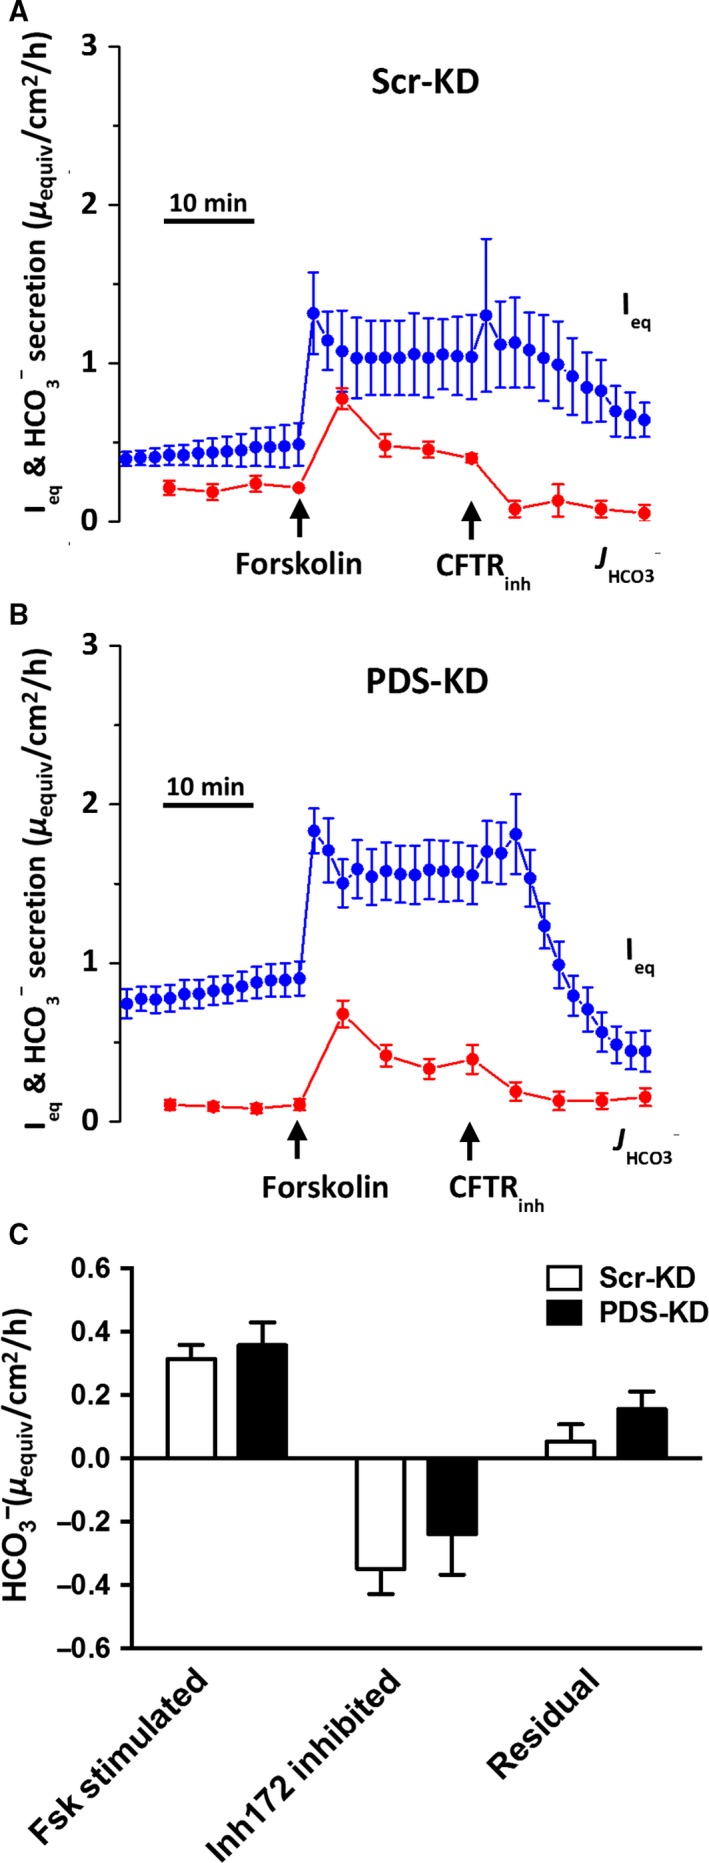
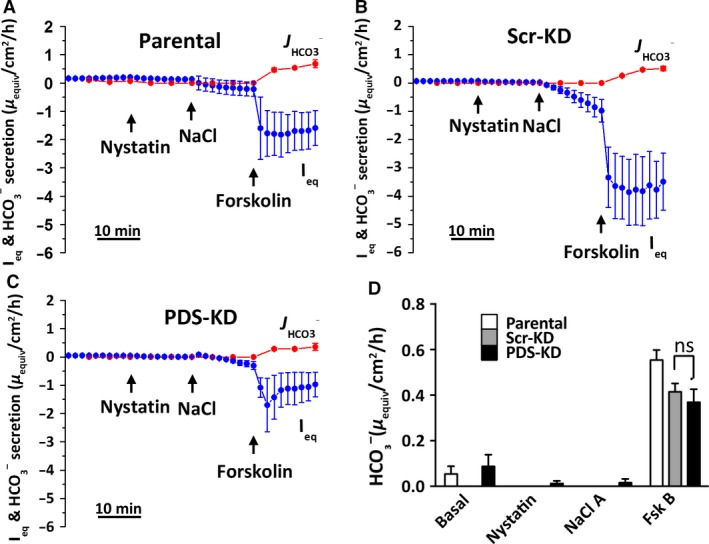
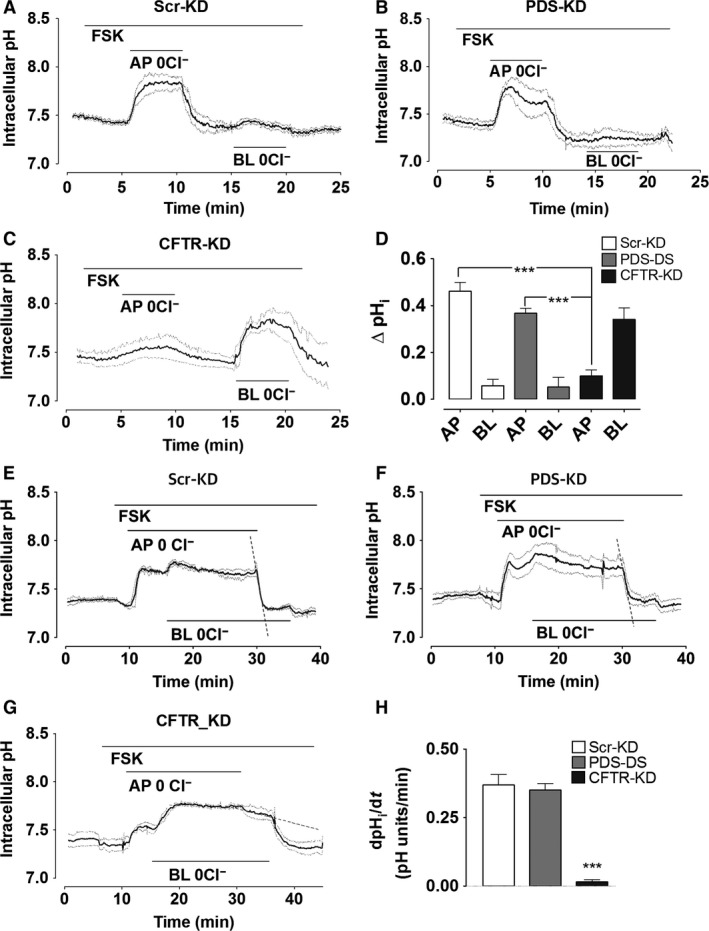
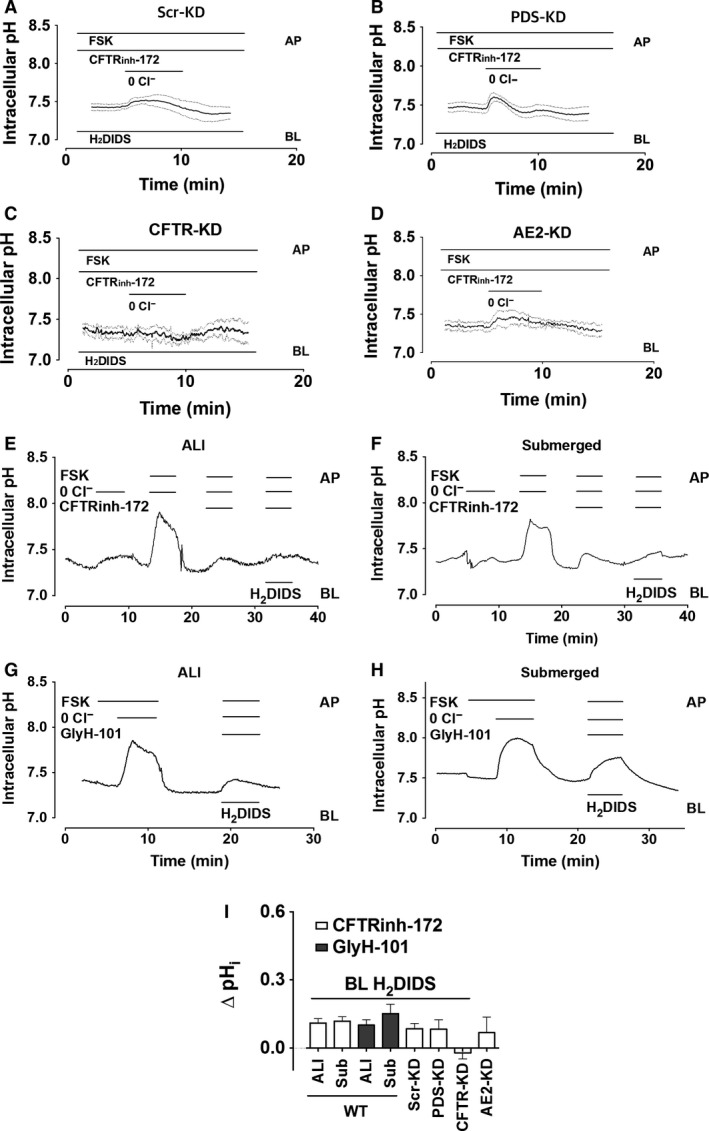
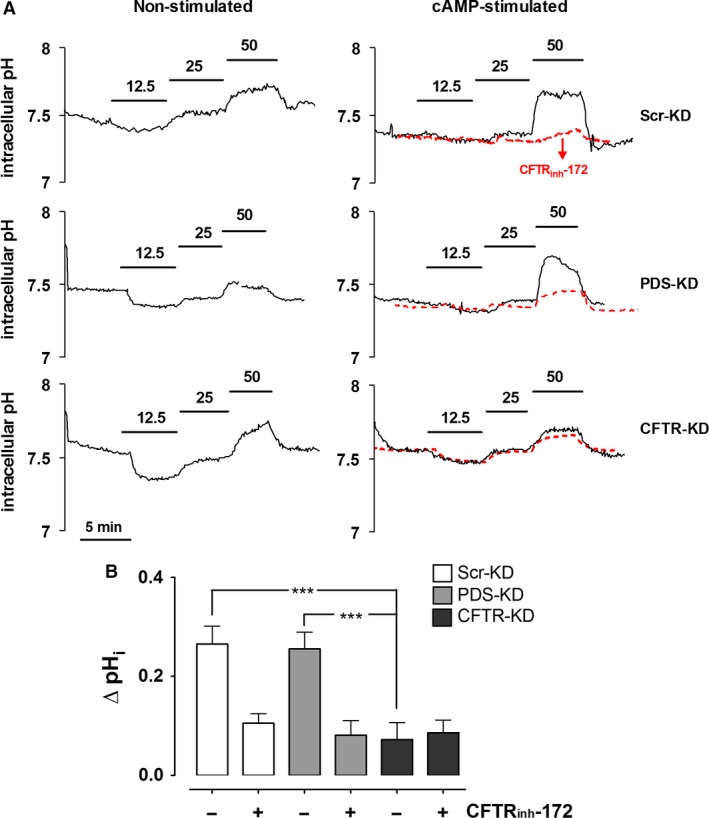
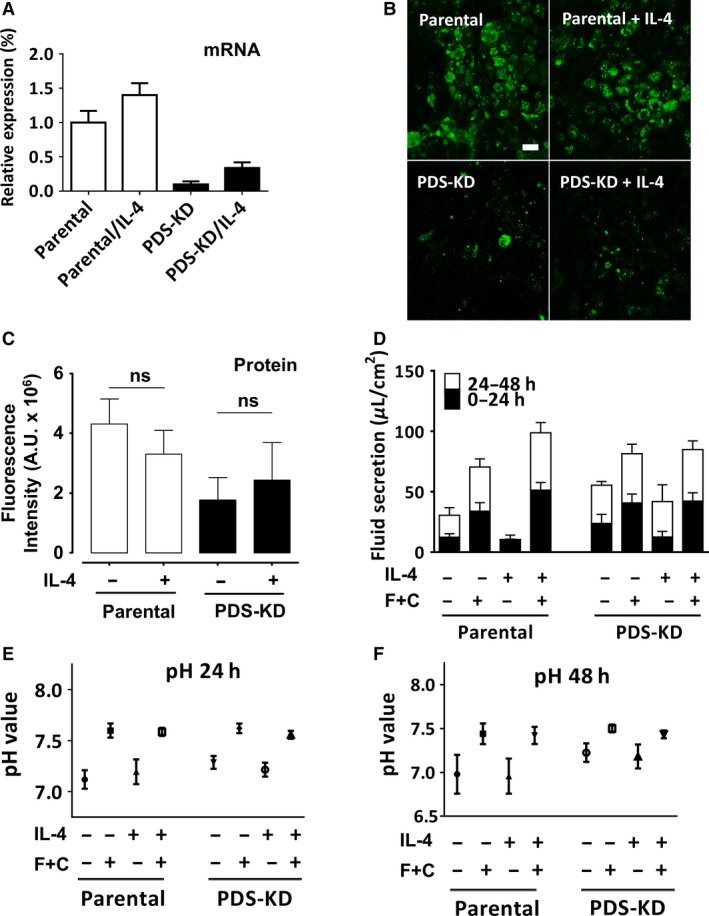
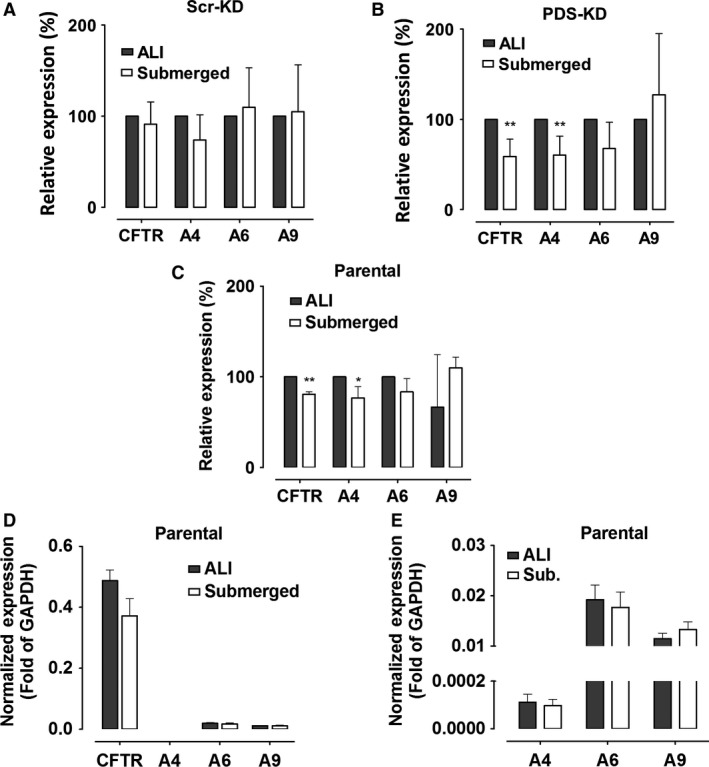
Bicarbonate plays an important role in airway host defense, however, its transport mechanisms remain uncertain. Here we examined the relative contributions of the anion channel CFTR (cystic fibrosis transmembrane conductance regulator, ABCC7) and the anion exchanger pendrin (SLC26A4) to HCO3- secretion by the human airway cell line Calu-3. Pendrin and CFTR were both detected in parental Calu-3 cells, although mRNA and protein expression appeared higher for CFTR than for pendrin. Targeting pendrin transcripts with lentiviral shRNA reduced pendrin detection by immunofluorescence staining but did not alter the rates of HCO3- or fluid secretion, HCO3- transport under pH-stat conditions, or net HCO3- flux across basolaterally permeabilized monolayers. Intracellular pH varied with step changes in apical Cl- and HCO3- concentrations in control and pendrin knockdown Calu-3 cells, but not in CFTR deficient cells. Exposure to the proinflammatory cytokine IL-4, which strongly upregulates pendrin expression in airway surface epithelia, had little effect on Calu-3 pendrin expression and did not alter fluid or HCO3- secretion. Similar results were obtained using air-liquid interface and submerged cultures, although CFTR and pendrin mRNA expression were both lower when cells were cultured under submerged conditions. While the conclusions cannot be extrapolated to other airway epithelia, the present results demonstrate that most HCO3- secretion by Calu-3 cells is mediated by CFTR.

Keywords: Airway epithelial cells; SLC26A4; cystic fibrosis; pendrin.


Figures

Figure 1
Figure 1
Pendrin expression and generation of pendrin knockdown (PDS‐KD) Calu‐3 cell lines. (A) CFTR, SLC26A4, SLC26A6, and SLC26A9 mRNA expression in Scr‐KD (control) and PDS‐KD (pendrin knockdown) cells. mRNA levels were measured using qRT‐PCR, normalized to GAPDH, and plotted relative to the corresponding value in parental Calu‐3 cells. PDS mRNA expression was unchanged in Scr‐KD cells and was reduced ~90% in the PDS‐KD line transduced with sh‐PDS‐5 (n = 5, P < 0.0001). CFTR, SCL26A6, and A9 mRNA levels were not altered significantly in pendrin knockdown cells. (B) (i) immunstaining ZO‐1 (red) and pendrin (green) in parental Calu‐3 (WT) cells, (ii) same as (i) but omitting antipendrin primary antibody, panels (iii)–(vi) pendrin immunostaining in WT cells, scrambled control shRNA cells, CFTR knockdown cells, and pendrin knockdown cells, respectively. All images were taken using the same illumination intensity and laser power. Scale bars: 20 μm. Images are representative of n = 4–5 cultures/cell line. (C) summary of pendrin fluorescence intensity in parental (WT), Scr‐KD (shRNA scrambled control cells), PDS‐KD (pendrin knockdown cells) and CFTR‐KD cells (CFTR knockdown cells, n = 4–5, ± SEM). Pendrin staining was reduced ~80% in PDS‐KD compared to parental and scrambled shRNA control cells. Unpaired Student's t tests show *< 0.05, **< 0.01, ***< 0.001. (D–G) immunoblots of Calu‐3 parental, Scr‐KD, and PDS‐KD cells. 20 μg total protein was probed with antibody against: (D) AE2 and Na+/K+‐ATPase α‐subunit; (E) CFTR and Na+/K+‐ATPase a‐subunit; (F) NBCe1 and β‐actin, and (G) NKCC1 and Na+/K+‐ATPase α‐subunit. (H) summary of expression of different transporters in parental, scrambled shRNA control, and pendrin knockdown cell lines. Each protein was corrected for loading using β‐actin or Na+/K+‐ATPase, and normalized to the expression in parental Calu‐3 cells.
Figure 2
Figure 2
Fluid secretion volume and pH are similar in control and PDS‐KD Calu‐3 cells. Air–liquid interface cultures were exposed to basolateral DMSO vehicle or cAMP + forskolin (C + F). Apical fluid was collected at 24 h intervals for 2 days and plotted cumulatively. Apical pH was measured using a mini‐pH electrode. (A) fluid volume secreted during first and second day. (B and C) pH of the apical fluid after 24 and 48 h, respectively. Means ± SEM, *P < 0.1, **P < 0.05, ***P < 0.01.
Figure 3
Figure 3
Pendrin knockdown does not affect forskolin‐stimulated HCO3 secretion under open‐circuit, pH stat conditions. Forskolin and CFTRInh‐172 were added sequentially to the basolateral and apical sides, respectively. I eq (blue symbols) and HCO3 secretion (red symbols) were monitored across (A) Scr‐KD, and (B) PDS‐KD monolayers. (C) net HCO3 secretion rates. There was no difference in forskolin‐stimulated or residual HCO3 ‐secretion rates after CFTRInh‐172 when comparing Scr‐KD and PDS‐KD cells (mean ± SEM, n = 4–9; *P < 0.05).
Figure 4
Figure 4
No evidence for pendrin‐dependent, apical Cl/HCO3 exchange in basolaterally permeabilized Calu‐3 monolayers. (A–C) cultures were bathed initially in symmetrical Cl‐free solutions and permeabilized basolaterally using nystatin (360 μg·mL−1). Apical HCO3 efflux was monitored using pH stat. 30 mmol/L NaCl was added on the apical side to establish an apical‐to‐basolateral Cl gradient and 10 μmol/L forskolin was added to stimulate CFTR. (D) summary of HCO3 secretion rates under each condition (mean ± SEM, n = 4–9). HCO3 secretion by Calu‐3 Scr‐KD and PDS‐KD monolayers was negligible in unstimulated monolayers with Cl gradient, and similar after forskolin addition (ns, not significant, P > 0.2).
Figure 5
Figure 5
pHi responses to extracellular Cl substitution. Calu‐3 monolayers were stimulated with forskolin in HCO3 ‐buffered solution and Cl was replaced with gluconate on the apical, basolateral or both sides as indicated by horizontal bars. Continuous traces in each show the mean pHi and dashed traces show ± SEM for all experiments (n = 4–5). (A) Scr‐KD cells, (B) PDS‐KD cells, (C) CFTR‐KD cells. (D) mean change in pHi induced by Cl substitution on the apical (AP) or basolateral (BL) side. Alkalinizations were similar in Scr‐KD and PDS‐KD cells (means ± SEM, n = 4–5, P > 0.2) but greatly reduced in CFTR‐KD cells (***P < 0.001). (E) initial rate of re‐acidification (dashed line) when 124 mmol/L Cl was restored on the apical side of forskolin‐stimulated monolayers (after bilateral Cl‐free perfusion for >15 min to eliminate basolateral exchange). Apparent anion exchange at the apical membrane was similar in (E) control Scr‐KD and (F) PDS‐KD cells, but greatly reduced in CFTR‐KD cells (G). (H) summary of reacidification rates in different cell lines challenged with apical low‐Cl solution.
Figure 6
Figure 6
Anion exchange in cAMP‐stimulated Calu‐3 monolayers exposed to basolateral H2DIDS and apical CFTRinh‐172. Polarized cells were superfused with HCO3 ‐buffered solution and apical Cl was replaced with gluconate during stimulation with 10 μmol/L forskolin and exposure to basolateral 500 μmol/L H2DIDS as indicated. Continuous traces show the mean pHi and the dashed lines indicate ± SEM, n = 4–7. (A) SCR‐KD (control) cells, (B) Pendrin‐KD cells, (C) CFTR‐KD cells, and (D) AE2‐ KD cells. (I) summary of alterations in pHi induced by apical Cl substitution using parental (WT) Calu‐3 cells that had been cultured under air–liquid interface (ALI) or submerged (Sub) conditions and exposed acutely to CFTR inhibitors on the apical side and to basolateral H2DIDS to minimize HCO3 flux through non‐pendrin transporters. Also shown are the responses to apical Cl substitution together with basolateral H2DIDS from experiments in (A–D) using Scr‐KD (control) and knockdown cell lines deficient in PDS, CFTR, and AE2.
Figure 7
Figure 7
Effects of altering apical HCO3 concentration on pHi in control, pendrin knockdown, and CFTR knockdown Calu‐3 cell lines. (A) intracellular pH was measured in Scr‐KD, PDS‐KD, and CFTR‐KD monolayers bathed basolaterally with HCO3 ‐buffered solution (25 mmol/L) and H2‐DIDS, and challenged with the apical [HCO3 ] shown. Recordings on the left were obtained without forskolin stimulation, those on the right with forskolin. Also shown with red dashed lines are the mean responses when 10 μmol/L CFTRinh‐172 was added to assess the dependence on CFTR under these conditions. (B) summary of pHi changes in stimulated cells induced by exposure to high apical [HCO3 ] (50 mmol/L) in the absence (−) or presence (+) of CFTRinh‐172 (mean ± SEM, n = 4; ***P < 0.001).
Figure 8
Figure 8
IL‐4 effects on pendrin expression in Calu‐3 cells, fluid secretion rate, and pH of secretions. (A) relative pendrin mRNA expression in cell lines measured using quantitative real‐time PCR and normalized to GAPDH after 48 h treatment with IL‐4 (10 ng/mL) at the air–liquid interface. (B) background‐subtracted images of parental (WT) and pendrin knockdown (PDS‐KD) cells immunostained for pendrin with or without 48 h pretreatment with IL‐4 (10 ng/mL). (C) summary of image fluorescence intensities in arbitrary units (A.U.). ns, not significant. (P > 0.05). Pendrin protein staining was not increased significantly in Calu‐3 cells treated with IL‐4. (D) cumulative fluid secretion after 2 day pretreatment with DMSO (vehicle) or IL‐4 (10 ng/mL). Fluid was collected at 24 h intervals. cAMP + forskolin (C+F; or vehicle control) was added in some experiments to activate CFTR. (E and F) pH of the fluid secreted in panels (C) 0–24 h, and (D) 24–48 h, respectively.
Figure 9
Figure 9
Comparison of CFTR, pendrin, SLC26A6, and SLC26A9 expression in cultures at the air–liquid interface (ALI) versus submerged conditions. qRT‐PCR was performed using (A) Scr‐KD (control) cells, (B) PDS‐KD, and (C) parental cells (WT), normalized to the levels in ALI cultures. (mean ± SEM, n = 3–5; *P < 0.05, **P < 0.01, one‐tailed Student's t test). (D) comparison of qRT‐PCR results for the four genes examined, each normalized to GAPDH expression, showing relative levels of CFTR and SLC26A transporters. (E) relative expression of SLC26A transporters, rescaled to enable comparison. Note that after normalization to GAPDH, the qRT‐PCR signals for SLC26A6 and SLC26A9 were >100‐fold higher than for pendrin.

Similar articles

Cited by

References

    1. Adams, K. M. , Abraham V., Spielman D., Kolls J. K., Rubenstein R. C., Conner G. E., et al. 2014. IL‐17A induces Pendrin expression and chloride‐bicarbonate exchange in human bronchial epithelial cells. PLoS ONE 9:e103263. - PMC - PubMed
    1. Alesutan, I. , Daryadel A., Mohebbi N., Pelzl L., Leibrock C., Voelkl J., et al. 2011. Impact of bicarbonate, ammonium chloride, and acetazolamide on hepatic and renal SLC26A4 expression. Cell. Physiol. Biochem. 28:553–558. - PubMed
    1. Alper, S. L. , and Sharma A. K.. 2013. The SLC26 gene family of anion transporters and channels. Mol. Aspects Med. 34:494–515. - PMC - PubMed
    1. Bertrand, C. A. , Zhang R., Pilewski J. M., and Frizzell R. A.. 2009. SLC26A9 is a constitutively active, CFTR‐regulated anion conductance in human bronchial epithelia. J. Gen. Physiol. 133:421–438. - PMC - PubMed
    1. Bidart, J. M. , Lacroix L., Evain‐Brion D., Caillou B., Lazar V., Frydman R., et al. 2000. Expression of Na+/I‐ symporter and Pendred syndrome genes in trophoblast cells. J. Clin. Endocrinol. Metab. 85:4367–4372. - PubMed

Publication types

MeSH terms

Substances

LinkOut - more resources