. 2018 Mar;6(5):e13646.
doi: 10.14814/phy2.13646.

Influence of organ donor attributes and preparation characteristics on the dynamics of insulin secretion in isolated human islets

Affiliations

Influence of organ donor attributes and preparation characteristics on the dynamics of insulin secretion in isolated human islets

Jean-Claude Henquin. Physiol Rep. 2018 Mar.

Abstract

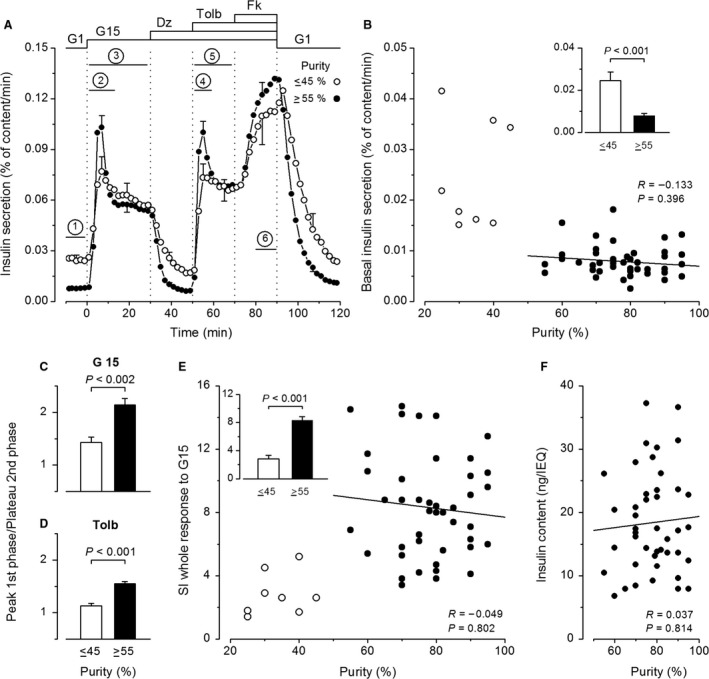
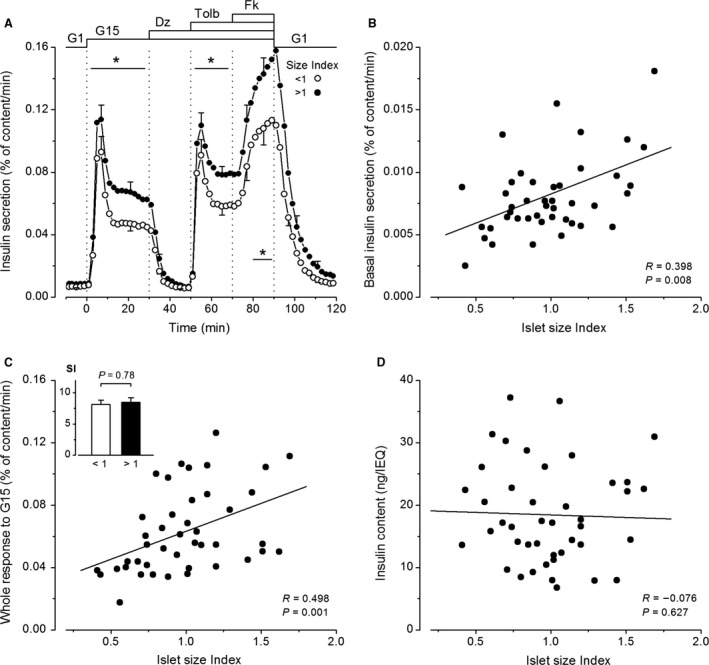
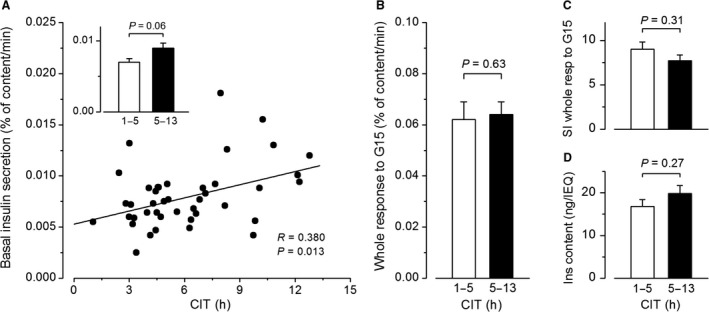
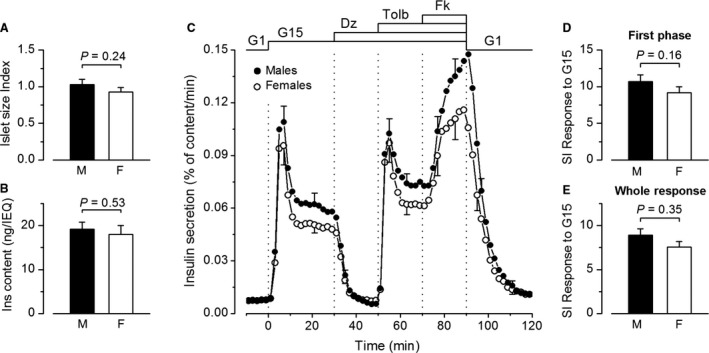
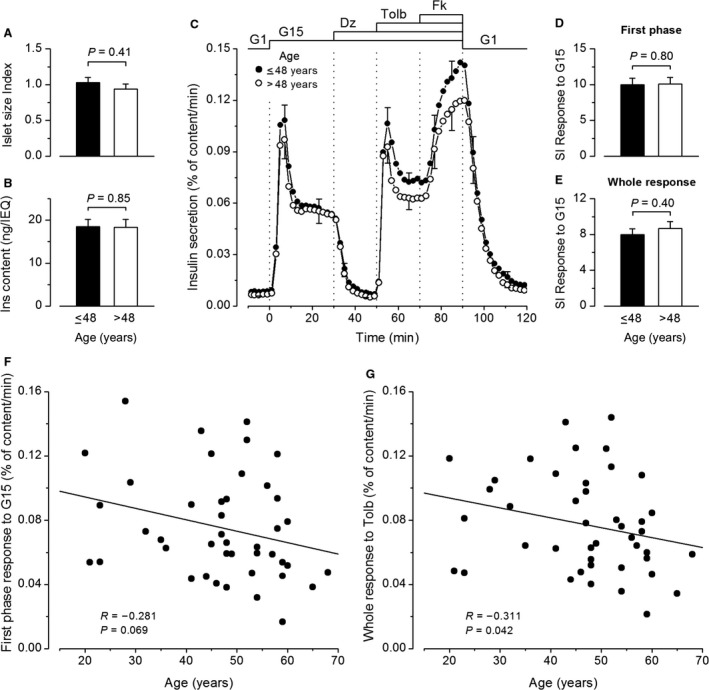
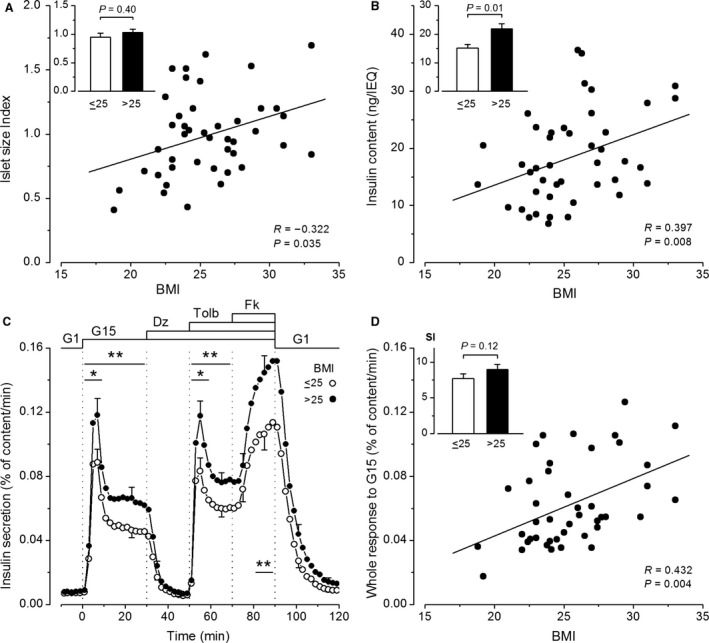
In vitro studies of human pancreatic islets are critical for understanding normal insulin secretion and its perturbations in diabetic β-cells, but the influence of islet preparation characteristics and organ donor attributes in such experiments is poorly documented. Preparations from normal donors were tested with a standardized protocol evaluating dynamic insulin secretion induced by glucose, tolbutamide, and cAMP (forskolin). Secretion rates, normalized to insulin content (fractional insulin secretion), were analyzed as a function of preparation and donor characteristics. Low purity (25-45%) of the preparation (n = 8) blunted the first phase of insulin secretion induced by glucose or tolbutamide and increased basal secretion, resulting in threefold lower stimulation index than in more pure (55-95%) preparations (n = 43). In these more pure preparations, cold ischemia time (1-13 h) before pancreas digestion did not impact insulin secretion. Islet size (estimated by the islet size index) did not influence the dynamics of secretion, but fractional insulin secretion rates were greater in large than small islets, and positively correlated with islet size. Age of the donors (20-68 years) had no influence on islet size and insulin content or on dynamics and amplitude of insulin secretion, which were also similar in islets from male and female donors. In contrast, islet size and islet insulin content (normalized for size), and basal or stimulated insulin secretion positively correlated with Body-Mass Index (19-33). These results contradict previous reports on the impact of donor age and islet size and point to possible confounding effects of donor BMI in insulin secretion studies with isolated human islets.

Keywords: Human islets; insulin secretion; islet donor BMI; islet donor age; islet size.


Figures

Figure 1
Figure 1
Influence of the purity of human islet preparations on insulin secretion. (A) Dynamics of insulin secretion in preparations with purities ≤45% or ≥55% (n = 8 and 43, respectively). Experiments started with a 60‐min stabilization period, of which only the last 10 min are shown. Between 0 and 90 min, the concentration of glucose was increased from 1 (G1) to 15 mmol/L (G15). Diazoxide (Dz; 100 μmol/L), tolbutamide (Tolb; 100 μmol/L), and forskolin (Fk; 1 μmol/L) were added and withdrawn as indicated. Bars labeled 1–6 show time periods over which insulin secretion rates were averaged for subsequent analyses as described in Results. (B) Basal insulin secretion rate in G1. (C–D) Ratio of secretion rates at peak of first phase and plateau of second phase of responses to G15 (C) and Tolb (D). (E) Stimulation index (SI) for the whole insulin response to G15. (F) Islet insulin content normalized to islet equivalents (IEQ). A, C and D, and insets in B and E compare means ± SE for preparations with low and high purity. P values were calculated by Mann–Whitney test. B, E and F show individual values as a function of the purity of each islet preparation. Correlation coefficients were calculated by the test of Spearman for the group of high purity only.
Figure 2
Figure 2
Influence of islet size (expressed as islet size index of the preparation) on insulin secretion by isolated human islets. (A) Dynamics of insulin secretion in islet preparations with a size index lower or higher than 1.0. Values are means ± SE for 21 and 22 islet preparations. Significant differences between the two groups during reference periods are denoted by *(P < 0.05) (Mann–Whitney test). (B–D) Basal insulin secretion rate in G1 (B), whole insulin response to G15 (C) and normalized islet insulin content (D), as a function of the islet size index. Correlation coefficients were calculated by the test of Spearman. (C) The inset compares stimulation index (SI) for whole insulin responses to G15 (means ± SE) in islet preparations with an islet size index below or above 1.
Figure 3
Figure 3
Influence of cold ischemia time (CIT) on insulin secretion by isolated human islets. (A) Basal insulin secretion rates in G1 as a function of CIT. The correlation coefficient was calculated by the test of Spearman. (B) Whole insulin response to G15. (C) Stimulation index (SI) for the whole response to G15. (D) Normalized islet insulin content. The inset in A, and B–D compare means ± SE for 20 preparations with short (1–5 h) and 22 preparations with longer (5–13 h) CIT (Mann–Whitney test).
Figure 4
Figure 4
Influence of donor sex on insulin secretion by isolated human islets. (A) Islet size index. (B) Normalized islet insulin content. (C) Dynamics of insulin secretion. (D–E) Stimulation index (SI) for the first phase and the whole response to G15. Values are means ± SE for 24 islet preparations from male donors and 19 preparations from female donors. All comparisons by Mann–Whitney test.
Figure 5
Figure 5
Influence of donor age on insulin secretion by isolated human islets. (A) Islet size index. (B) Normalized islet insulin content. (C) Dynamics of insulin secretion. (D–E) Stimulation index (SI) for the first phase and the whole response to G15. Values are means ± SE for 23 islet preparations from donors aged ≤48 years and 20 preparations from donors aged >48 years. All comparisons by Mann–Whitney test. (F–G) First phase insulin response to G15 (F) and whole insulin response to tolbutamide (G) as a function of donor age. Correlation coefficients were calculated by the test of Spearman.
Figure 6
Figure 6
Influence of donor BMI on insulin secretion by isolated human islets. (A) Islet size index. (B) Normalized islet insulin content. (C) Dynamics of insulin secretion. (D) Whole insulin response to G15 and stimulation index (SI) for this response (inset). A, B and D show individual values as a function of donor BMI. Correlation coefficients were calculated by the test of Spearman. C and insets in A, B, and D compare means ± SE for preparations from 22 donors with BMI ≤25 and 21 donors with BMI >25. All comparisons by Mann–Whitney test. In C, significant differences during reference periods are denoted by *(P < 0.05) and **(< 0.02).

References

    1. Almaça, J. , Molina J., e Drigo R. A., Abdulreda M. H., Jeon W. B., Berggren P. O., et al. 2014. Young capillary vessels rejuvenate aged pancreatic islets. Proc. Natl Acad. Sci., 111:17612–17617. - PMC - PubMed
    1. Amisten, S. , Atanes P., Hawkes R., Ruz‐Maldonado I., Liu B., Parandeh F., et al. 2017. A comparative analysis of human and mouse islet G‐protein coupled receptor expression. Sci. Rep. 7:46600. - PMC - PubMed
    1. Balamurugan, A. N. , Naziruddin B., Lockridge A., Tiwari M., Loganathan G., Takita M., et al. 2014. Islet product characteristics and factors related to successful human islet transplantation from the Collaborative Islet Transplant Registry (CITR) 1999–2010. Am. J. Transplant. 14:2595–2606. - PMC - PubMed
    1. Chang, A. M. , and Halter J. B.. 2003. Aging and insulin secretion. Am. J. Physiol. Endocrinol. Metab. 284:E7–E12. - PubMed
    1. Detimary, P. , Jonas J. C., and Henquin J. C.. 1996. Stable and diffusible pools of nucleotides in pancreatic islet cells. Endocrinology 137:4671–4676. - PubMed

LinkOut - more resources