. 2018 Apr 3;57(13):2044-2057.
doi: 10.1021/acs.biochem.8b00186. Epub 2018 Mar 22.

Insights into the Active Site of Coproheme Decarboxylase from Listeria monocytogenes

Affiliations

Insights into the Active Site of Coproheme Decarboxylase from Listeria monocytogenes

Lisa Milazzo et al. Biochemistry. .

Abstract

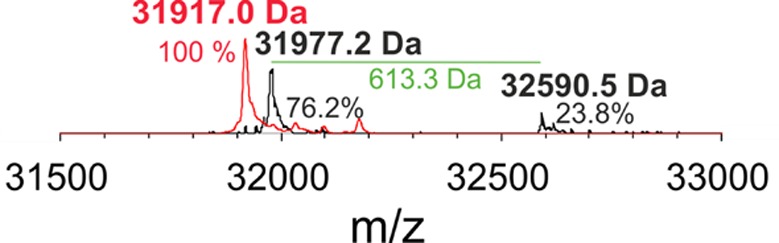
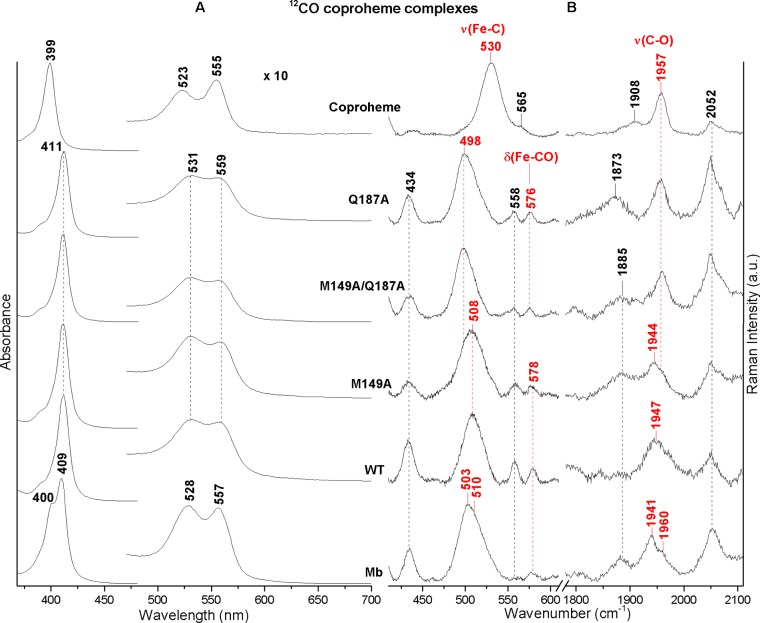
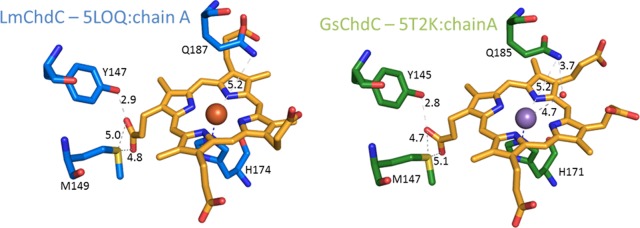
Coproheme decarboxylases (ChdC) catalyze the hydrogen peroxide-mediated conversion of coproheme to heme b. This work compares the structure and function of wild-type (WT) coproheme decarboxylase from Listeria monocytogenes and its M149A, Q187A, and M149A/Q187A mutants. The UV-vis, resonance Raman, and electron paramagnetic resonance spectroscopies clearly show that the ferric form of the WT protein is a pentacoordinate quantum mechanically mixed-spin state, which is very unusual in biological systems. Exchange of the Met149 residue to Ala dramatically alters the heme coordination, which becomes a 6-coordinate low spin species with the amide nitrogen atom of the Q187 residue bound to the heme iron. The interaction between M149 and propionyl 2 is found to play an important role in keeping the Q187 residue correctly positioned for closure of the distal cavity. This is confirmed by the observation that in the M149A variant two CO conformers are present corresponding to open (A0) and closed (A1) conformations. The CO of the latter species, the only conformer observed in the WT protein, is H-bonded to Q187. In the absence of the Q187 residue or in the adducts of all the heme b forms of ChdC investigated herein (containing vinyls in positions 2 and 4), only the A0 conformer has been found. Moreover, M149 is shown to be involved in the formation of a covalent bond with a vinyl substituent of heme b at excess of hydrogen peroxide.


Conflict of interest statement

The authors declare no competing financial interest.

Figures

Figure 1
Figure 1
Cross-linking of heme b to LmChdC mediated by excess hydrogen peroxide. Mass spectrometric analysis of the entire protein of LmChdC WT (apo-form 31 977.2 Da; cross-linked 32 590.5 Da, black) and LmChdC M149A (31 917.0 Da, red). The green line with its label shows the mass difference between apo-LmChd WT and holo-LmChdC WT. The Coproheme-LmChdC complexes were titrated with H2O2 up to a 2-fold excess; subsequently, the mass spectroscopic measurements were performed on heme b-LmChdC WT and heme b-LmChdC M149A.
Figure 2
Figure 2
UV–vis absorption and second derivative (D2) spectra of coproheme and the coproheme complexes with LmChdC WT, its M149A mutant, and Mb. The band wavelengths assigned to 5cHS, 5cQS, 6cHS, and 6cLS species are indicated in orange, olive green, blue, and magenta, respectively, (see text). The spectra have been shifted along the ordinate axis to allow better visualization. The 450–700 nm region of coproheme and the coproheme complexes spectra is expanded 20- and 9-fold, respectively. The excitation wavelengths used for the RR experiments are also shown in light violet (the 356.4 nm line) and in violet (the 406.7 nm line).
Figure 3
Figure 3
High frequency region RR spectra obtained at room temperature, with the 356.4 (Panel A) and 406.7 nm (Panel B) excitation wavelengths, of coproheme, and the coproheme complexes of LmChdC WT, its M149A mutant, and Mb. The band wavenumbers assigned to 5cHS, 5cQS, 6cHS, and 6cLS species are indicated in orange, olive green, blue, and magenta, respectively (see text). The spectra have been shifted along the ordinate axis to allow better visualization. Experimental conditions: (A) laser power at the sample 5 mW, average of 10 spectra with 120 min integration time (Coproheme); laser power at the sample 2 mW; average of 7 spectra with 70 min integration time (WT), 8 spectra with 80 min integration time (M149A), and 24 spectra with 240 min integration time (Mb). (B) laser power at the sample 5 mW; average of 2 spectra with 10 min integration time with 1800 grating (Coproheme), 9 spectra with 90 min integration time (WT), 4 spectra with 40 min integration time (M149A), and 6 spectra with 60 min integration time (Mb).
Figure 4
Figure 4
UV–vis absorption and second derivative spectra (D2) (Panel A) and RR spectra in the high frequency region (Panel B) of the coproheme complexes of WT and Mb with and without the addition of imidazole (ImH). The band wavelengths and wavenumbers assigned to 5cHS, 5cQS, 6cHS, and 6cLS species are indicated in orange, olive green, blue, and magenta, respectively (see text). The spectra have been shifted along the ordinate axis to allow better visualization. The 450–700 nm region of the spectra in Panel A is expanded 10-fold. Experimental conditions of the RR spectra: 406.7 nm excitation wavelength, laser power at the sample 5 mW; average of 9 spectra with 90 min integration time (WT), 10 spectra with 100 min integration time (WT + ImH), 5 spectra with 50 min integration time (Mb + ImH), and 6 spectra with 60 min integration time (Mb).
Figure 5
Figure 5
UV–vis absorption and second derivative (D2) spectra (Panel A) and RR spectra in the high frequency region (Panel B) of the coproheme complexes with WT and the Q187A, M149A/Q187A, and M149A mutants. The band wavelengths and wavenumbers assigned to 5cHS, 5cQS, 6cHS, and 6cLS species are indicated in orange, olive green, blue, and magenta, respectively. The spectra have been shifted along the ordinate axis to allow better visualization. The 450–700 nm region of the spectra in Panel A is expanded 9-fold. Experimental conditions of the RR spectra: 406.7 nm excitation wavelength, laser power at the sample of 5 mW, average of 9 spectra with a 90 min integration time (WT), 14 spectra with a 140 min integration time (Q187A), 10 spectra with a 100 min integration time (M149A/Q187A), and 4 spectra with a 40 min integration time (M149A).
Figure 6
Figure 6
Heme coordination for the coproheme complexes of LmChdC, its M149A mutant, and Mb determined by RR and EPR spectroscopy at room and low temperatures..
Figure 7
Figure 7
UV–vis (panel A) and RR (panel B) spectra in the low (left) and high (right) frequency regions of the 12CO adducts of the coproheme complexes of Mb, WT, M149A, M149A/Q187A, Q187A, and coproheme. The frequencies of the ν(FeC), δ(FeCO), and ν(CO) modes are indicated in red. The spectra have been shifted along the ordinate axis to allow better visualization. Panel A: the 480–700 nm region is expanded 10-fold. Panel B: experimental conditions: Mb and coproheme: λexc 406.7 nm, laser power at the sample 5 mW, average of 4 spectra with 40 min integration time and 10 spectra with 100 min integration time in the low and high frequency regions, respectively (Mb), average of 6 spectra with 60 min integration time and 12 spectra with 120 min integration time in the low and high frequency regions, respectively (coproheme); WT and its mutants, λexc 413.1 nm, laser power at the sample 1–3 mW; average of 28 spectra with 280 min integration time and 22 spectra with 220 min integration time in the low and high frequency regions, respectively (WT), average of 6 spectra with 60 min integration time and 18 spectra with 180 min integration time in the low and high frequency regions, respectively (M149A), average of 6 spectra with 60 min integration time and 15 spectra with 150 min integration time in the low and high frequency regions, respectively (M149A/Q187A), and average of 9 spectra with 90 min integration time and 15 spectra with 150 min integration time in the low and high frequency regions, respectively (Q187A).
Figure 8
Figure 8
Back-bonding correlation line of the ν(Fe–C) and ν(C–O) stretching frequencies of the coproheme-CO complexes of Mb (blue solid squares), SaChdC WT, and selected mutants (green solid triangles), LmChdC WT and selected mutants (red solid circles), heme, and coproheme. The three conformers of SWMb (heme b) are also reported (black solid squares). The dotted lines indicate the approximate delineation between the frequency zones of the A0, A1, and A3 states discussed in the text. The frequencies and references of the ν(Fe–C) and ν(C–O) stretching modes of the various CO adducts are reported in Table 2.
Figure 9
Figure 9
Active site architecture of LmChdC and GsChdC. LmChdC is depicted in blue and GsChdC in green. Distances are shown as gray dashes and labeled in black.

Similar articles

Cited by

References

    1. Dailey T. A.; Boynton T. O.; Albetel A. N.; Gerdes S.; Johnson M. K.; Dailey H. A. (2010) Discovery and Characterization of HemQ: an essential heme biosynthetic pathway component. J. Biol. Chem. 285, 25978–25986. 10.1074/jbc.M110.142604. - DOI - PMC - PubMed
    1. Dailey H. A.; Gerdes S.; Dailey T. A.; Burch J. S.; Phillips J. D. (2015) Noncanonical coproporphyrin-dependent bacterial heme biosynthesis pathway that does not use protoporphyrin. Proc. Natl. Acad. Sci. U. S. A. 112, 2210–2215. 10.1073/pnas.1416285112. - DOI - PMC - PubMed
    1. Dailey H. A.; Dailey T. A.; Gerdes S.; Jahn D.; Jahn M.; O’Brian M. R.; Warren M. J. (2017) Prokaryotic Heme Biosynthesis: Multiple Pathways to a Common Essential Product. Microbiol. Mol. Biol. Rev. 81 (1), e00048–16. 10.1128/MMBR.00048-16. - DOI - PMC - PubMed
    1. Kosugi N.; Araki T.; Fujita J.; Tanaka S.; Fujiwara T. (2017) Growth phenotype analysis of heme synthetic enzymes in a halophilic archaeon, Haloferax volcanii. PLoS One 12, e0189913. 10.1371/journal.pone.0189913. - DOI - PMC - PubMed
    1. Pfanzagl V.; Holcik L.; Maresch D.; Gorgone G.; Michlits H.; Furtmüller P. G.; Hofbauer S. (2018) Coproheme decarboxylases - Phylogenetic prediction versus biochemical experiments. Arch. Biochem. Biophys. 640, 27–36. 10.1016/j.abb.2018.01.005. - DOI - PMC - PubMed

Publication types

MeSH terms

LinkOut - more resources