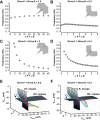
Corrigendum
- PMID: 29537355
- PMCID: PMC6541767
- DOI: 10.1152/jn.z9k-4583-corr.2018
Corrigendum
Figures


Erratum for
-
State-dependent rhythmogenesis and frequency control in a half-center locomotor CPG.J Neurophysiol. 2018 Jan 1;119(1):96-117. doi: 10.1152/jn.00550.2017. Epub 2017 Oct 4. J Neurophysiol. 2018. PMID: 28978767 Free PMC article.
Similar articles
-
Corrigendum: Corrigendum for: Disorders of sex development: The evolving role of genomics in diagnosis and gene discovery, 108:337-350 (10.1002/bdrc.21148).Birth Defects Res. 2017 Jul 3;109(11):869-871. doi: 10.1002/bdr2.1056. Epub 2017 Jun 12. Birth Defects Res. 2017. PMID: 28670874 No abstract available.
-
Corrigendum: Corrigendum to 'Tenacious goal pursuit and flexible goal adjustment in older people over 5 years: a latent profile transition analysis'.Age Ageing. 2016 Sep;45(5):741. doi: 10.1093/ageing/afw113. Epub 2016 Jul 11. Age Ageing. 2016. PMID: 27496926 No abstract available.
-
Corrigendum: Corrigendum to 'Self and informant memory concerns align in healthy memory complainers and in early stages of mild cognitive impairment but separate with increasing cognitive impairment'.Age Ageing. 2016 Sep;45(5):742. doi: 10.1093/ageing/afw117. Epub 2016 Jul 11. Age Ageing. 2016. PMID: 27646269 No abstract available.
-
Corrigendum: Risks, precipitants and clinical presentation of gastro-oesophageal reflux disease at the Kilimanjaro Christian Medical Centre in Tanzania.Pan Afr Med J. 2015 Apr 13;20:351. doi: 10.11604/pamj.2015.20.351.6805. eCollection 2015. Pan Afr Med J. 2015. PMID: 25918578 Free PMC article.
-
Corrigendum.Mult Scler. 2016 Oct;22(12):NP7. doi: 10.1177/1352458511436287. Epub 2012 Jan 13. Mult Scler. 2016. PMID: 27742917
Publication types
LinkOut - more resources
Full Text Sources
Other Literature Sources

