. 2018 Apr 19;63(8):085014.
doi: 10.1088/1361-6560/aab68d.

Low dose CBCT reconstruction via prior contour based total variation (PCTV) regularization: a feasibility study

Affiliations

Low dose CBCT reconstruction via prior contour based total variation (PCTV) regularization: a feasibility study

Yingxuan Chen et al. Phys Med Biol. .

Abstract

Purpose: compressed sensing reconstruction using total variation (TV) tends to over-smooth the edge information by uniformly penalizing the image gradient. The goal of this study is to develop a novel prior contour based TV (PCTV) method to enhance the edge information in compressed sensing reconstruction for CBCT.

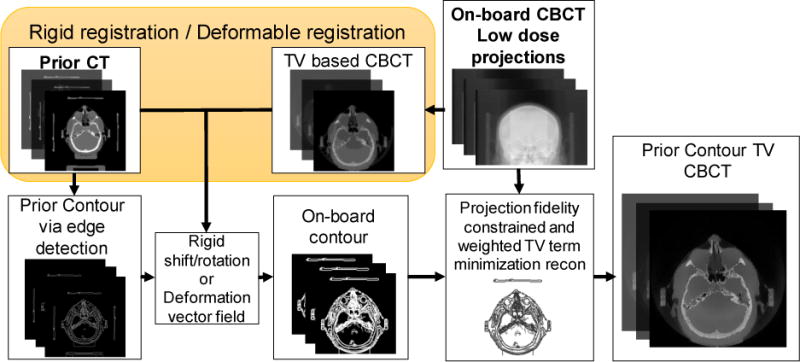
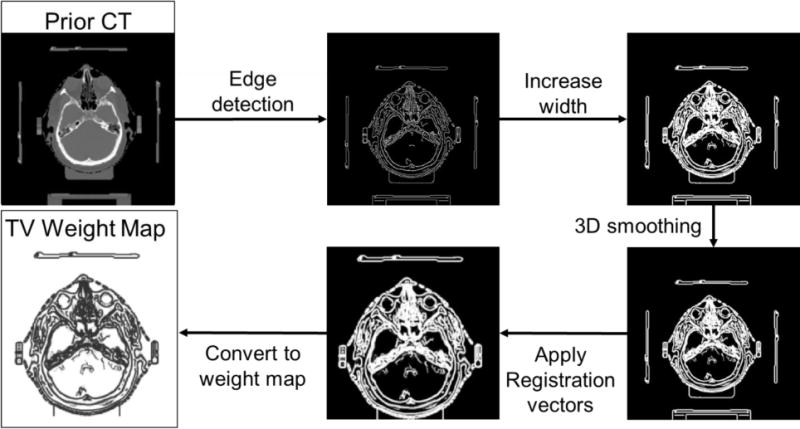
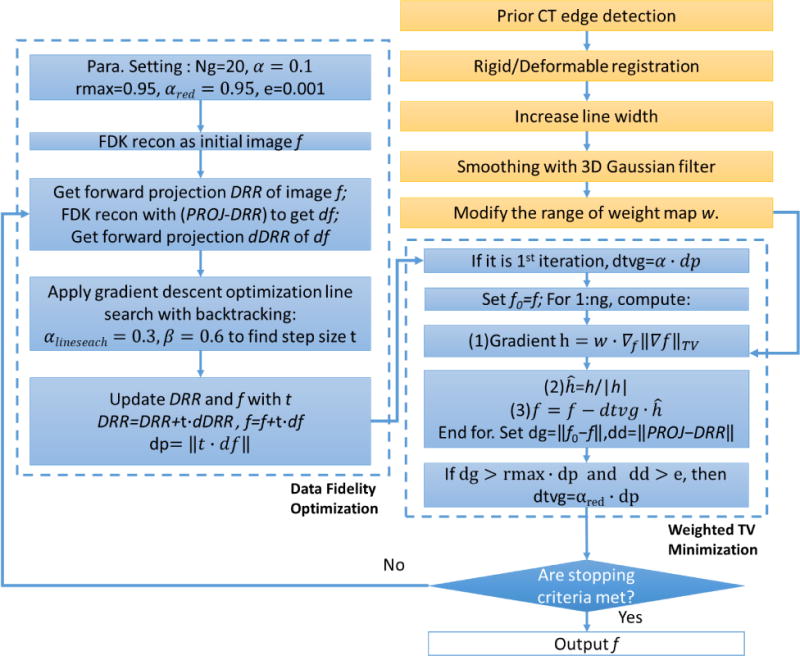
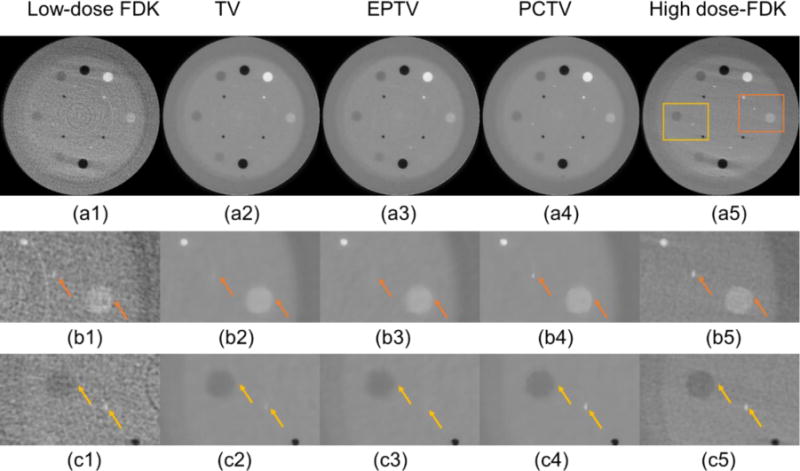
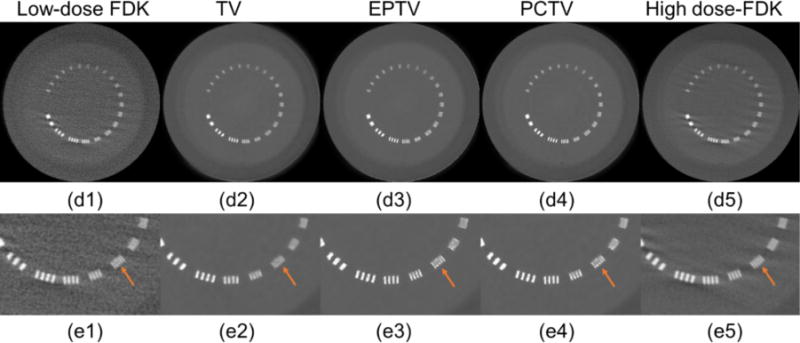
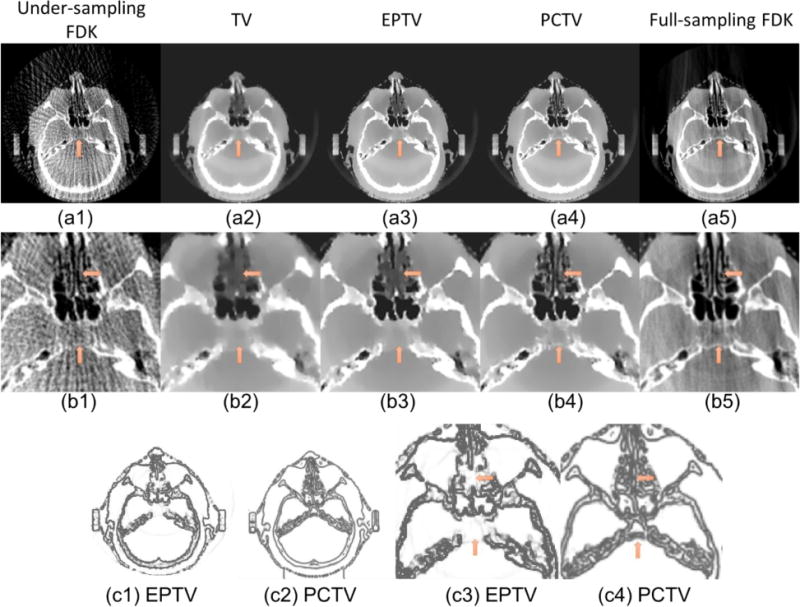
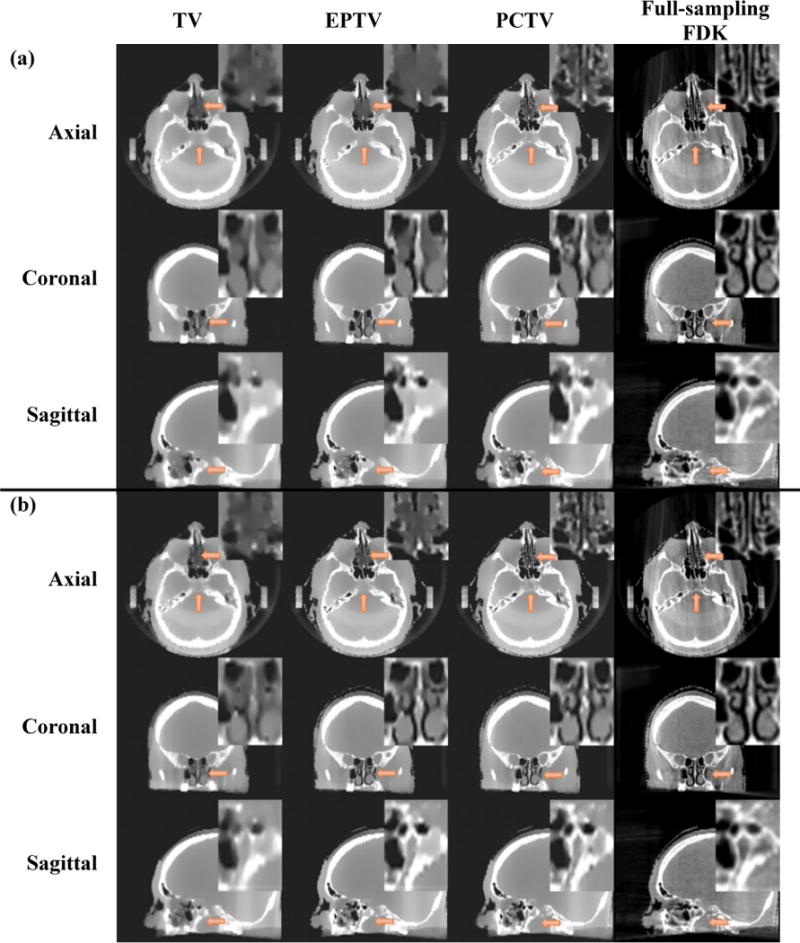
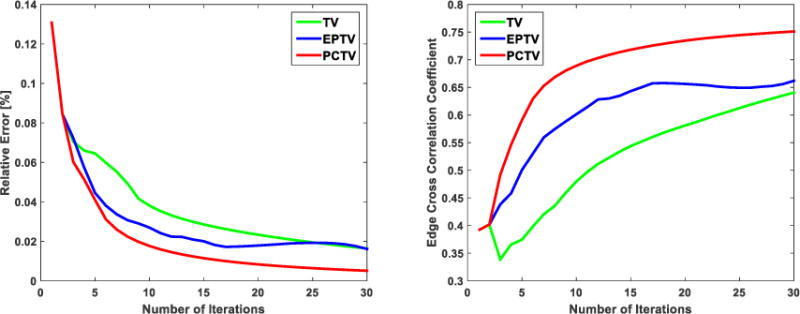
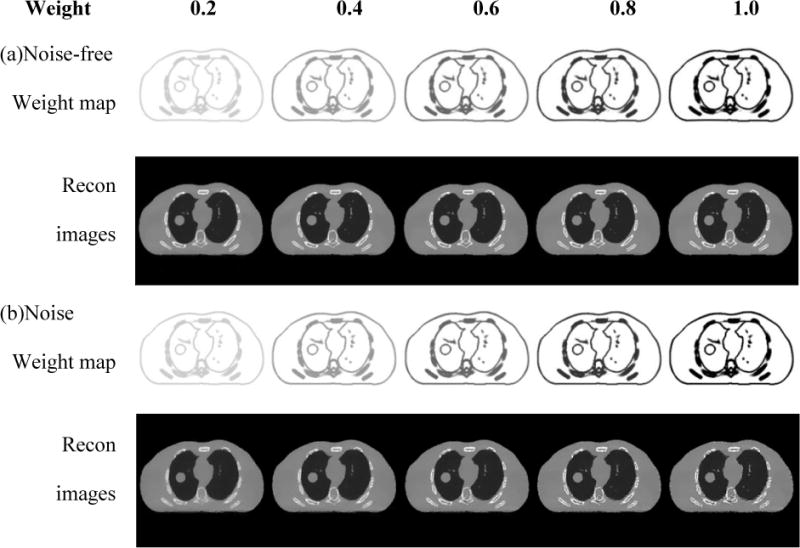
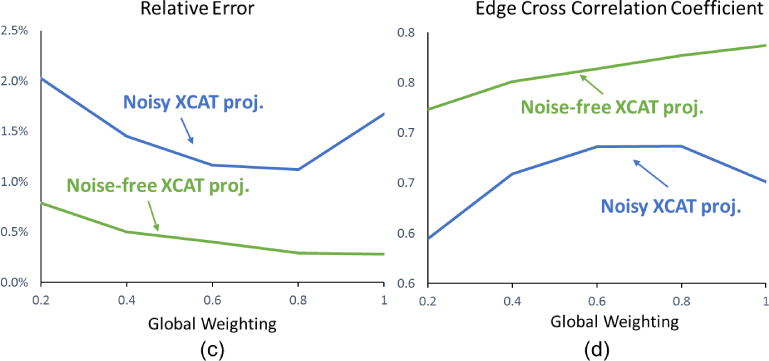
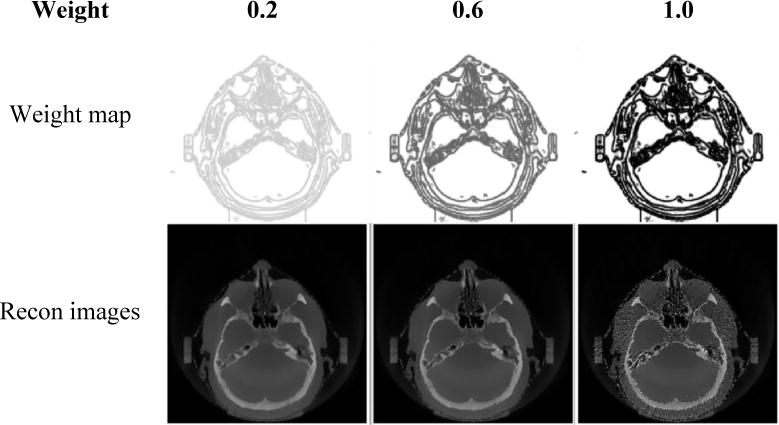
Methods: the edge information is extracted from prior planning-CT via edge detection. Prior CT is first registered with on-board CBCT reconstructed with TV method through rigid or deformable registration. The edge contours in prior-CT is then mapped to CBCT and used as the weight map for TV regularization to enhance edge information in CBCT reconstruction. The PCTV method was evaluated using extended-cardiac-torso (XCAT) phantom, physical CatPhan phantom and brain patient data. Results were compared with both TV and edge preserving TV (EPTV) methods which are commonly used for limited projection CBCT reconstruction. Relative error was used to calculate pixel value difference and edge cross correlation was defined as the similarity of edge information between reconstructed images and ground truth in the quantitative evaluation.

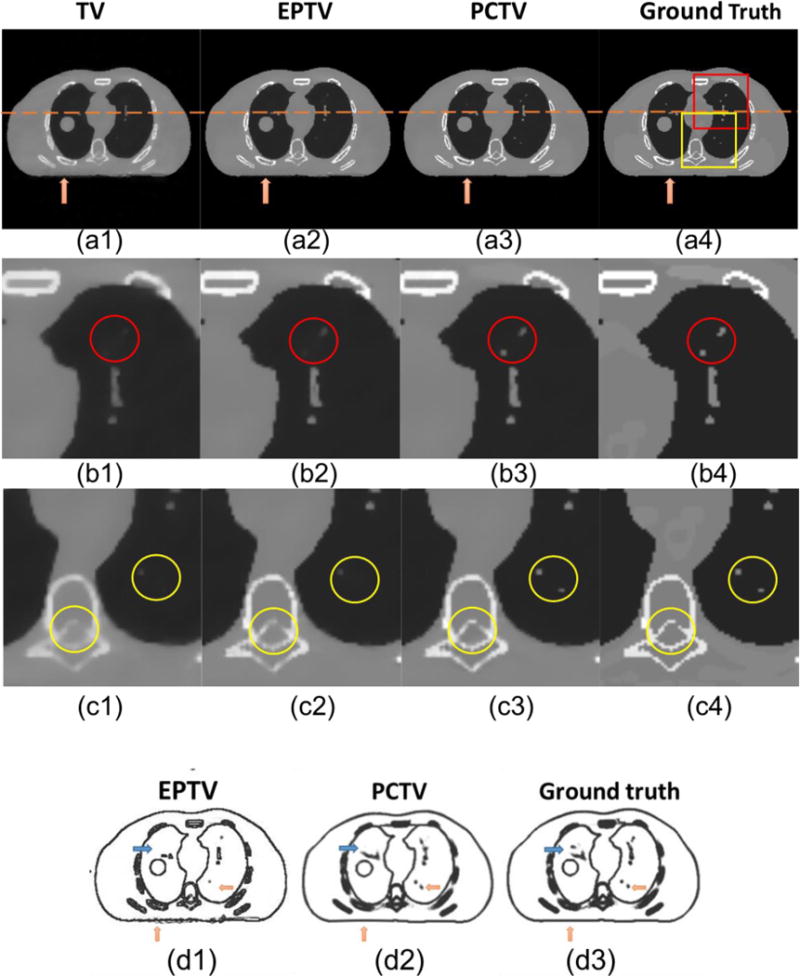
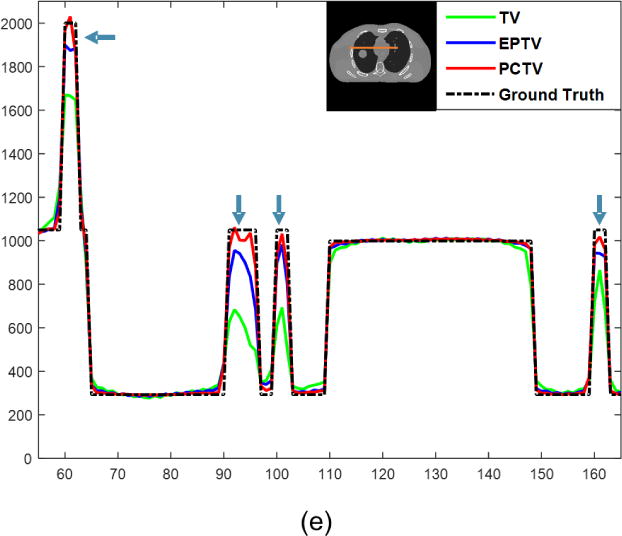
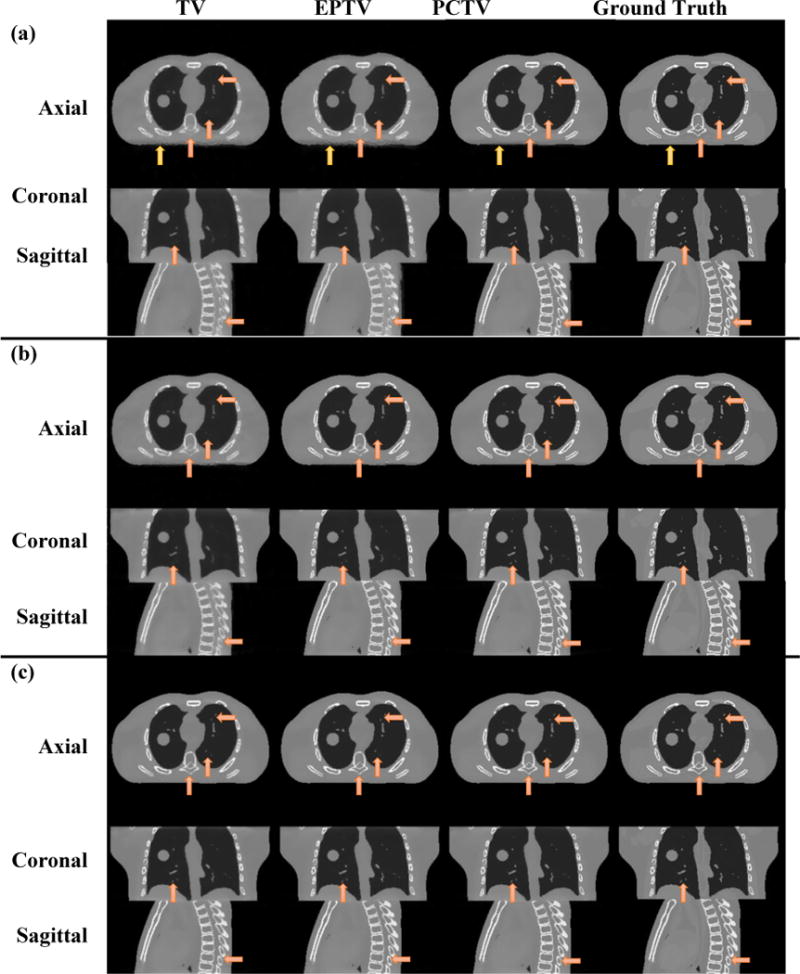
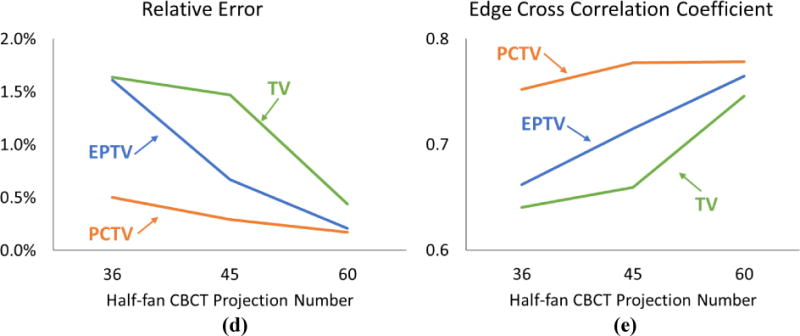
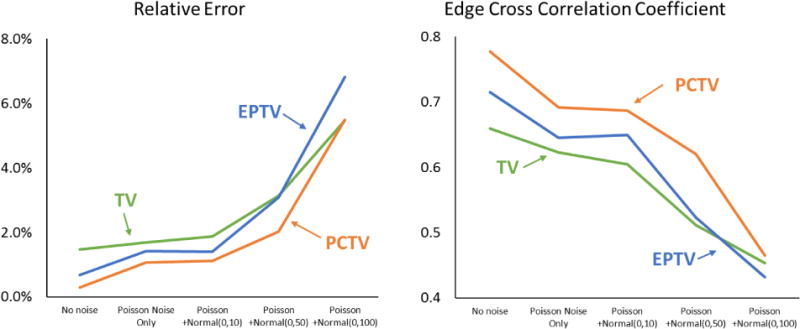
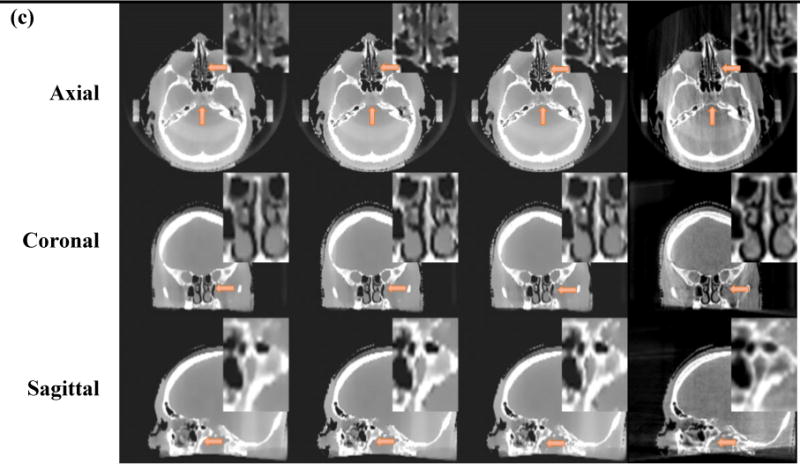
Results: compared to TV and EPTV, PCTV enhanced the edge information of bone, lung vessels and tumor in XCAT reconstruction and complex bony structures in brain patient CBCT. In XCAT study using 45 half-fan CBCT projections, compared with ground truth, relative errors were 1.5%, 0.7% and 0.3% and edge cross correlations were 0.66, 0.72 and 0.78 for TV, EPTV and PCTV, respectively. PCTV is more robust to the projection number reduction. Edge enhancement was reduced slightly with noisy projections but PCTV was still superior to other methods. PCTV can maintain resolution while reducing the noise in the low mAs CatPhan reconstruction. Low contrast edges were preserved better with PCTV compared with TV and EPTV.

Conclusion: PCTV preserved edge information as well as reduced streak artifacts and noise in low dose CBCT reconstruction. PCTV is superior to TV and EPTV methods in edge enhancement, which can potentially improve the localization accuracy in radiation therapy.


Figures

Figure 1
Figure 1
Flowchart of the PCTV method.
Figure 2
Figure 2
Flowchart of weight map generation.
Figure 3
Figure 3
Detailed PCTV reconstruction algorithm.
Figure 4
Figure 4
(a1)–(a4) show reconstructed 45 noise-free projections of XCAT with different breath amplitudes between prior images and on-board CBCT. (b1)–(b4) are the zoomed in images of red square in (a4) and (c1)–(c4) show the zooming in images of yellow square. Both red and yellow circles point that PCTV is superior to other methods in edge enhancement and small structures recovery. From left to right columns: TV, EPTV, PCTV and ground truth. In the fourth row, edge map were compared using 45 half-fan projections as shown in: (d1) weight map of last reconstruction iteration in EPTV, (d2) weight map used in PCTV and (d3) weight map extracted by edge detection on the ground truth images. (e) shows the profiles along the orange line of ground true image shown in (e).
Figure 4
Figure 4
(a1)–(a4) show reconstructed 45 noise-free projections of XCAT with different breath amplitudes between prior images and on-board CBCT. (b1)–(b4) are the zoomed in images of red square in (a4) and (c1)–(c4) show the zooming in images of yellow square. Both red and yellow circles point that PCTV is superior to other methods in edge enhancement and small structures recovery. From left to right columns: TV, EPTV, PCTV and ground truth. In the fourth row, edge map were compared using 45 half-fan projections as shown in: (d1) weight map of last reconstruction iteration in EPTV, (d2) weight map used in PCTV and (d3) weight map extracted by edge detection on the ground truth images. (e) shows the profiles along the orange line of ground true image shown in (e).
Figure 5
Figure 5
Comparisons of XCAT CBCT reconstructed via TV, EPTV and PCTV using a) 36projections, b) 45 projections and c) 60 projections. Ground truth are listed at the right column as the reference. In the quantitative evaluation, relative error and edge cross correlation for TV, EPTV and PCTV as functions of the number of CBCT projection number were plotted in (d) and (e), respectively.
Figure 5
Figure 5
Comparisons of XCAT CBCT reconstructed via TV, EPTV and PCTV using a) 36projections, b) 45 projections and c) 60 projections. Ground truth are listed at the right column as the reference. In the quantitative evaluation, relative error and edge cross correlation for TV, EPTV and PCTV as functions of the number of CBCT projection number were plotted in (d) and (e), respectively.
Figure 6
Figure 6
Relative error (left) and edge cross correlation (right) for TV, EPTV and PCTV as functions of noise level of 45 half-fan CBCT projections.
Figure 7
Figure 7
Reconstructed images of Catphan Phantom. (1)–(4) show the images reconstruction by FDK, TV, EPTV, PCTV, respectively at 25mAs (250 projections, 10 mA/10ms per projections). (5) shows high dose FDK at 200mAs((250 projections, 53 mA/15 ms per projections). (a)–(c) show the reconstructed images of Catphan multi-contrast slice.(b1)–(b5) Zoom in the right block shown in (a5). (c1)–(c5) Zoom in the left block shown in (a5). Arrows in (b) and (c) show that PCTV is superior to EPTV and TV in the low contrast edge enhancement. (d)–(e) show the reconstructed images of Catphan resolution slice. (e1)–(e5) Zoom in the corresponding part in the first-row images. Arrows in (e) show that PCTV and EPTV can achieve 6 lp/cm while reduce noise, which is superior to TV.
Figure 7
Figure 7
Reconstructed images of Catphan Phantom. (1)–(4) show the images reconstruction by FDK, TV, EPTV, PCTV, respectively at 25mAs (250 projections, 10 mA/10ms per projections). (5) shows high dose FDK at 200mAs((250 projections, 53 mA/15 ms per projections). (a)–(c) show the reconstructed images of Catphan multi-contrast slice.(b1)–(b5) Zoom in the right block shown in (a5). (c1)–(c5) Zoom in the left block shown in (a5). Arrows in (b) and (c) show that PCTV is superior to EPTV and TV in the low contrast edge enhancement. (d)–(e) show the reconstructed images of Catphan resolution slice. (e1)–(e5) Zoom in the corresponding part in the first-row images. Arrows in (e) show that PCTV and EPTV can achieve 6 lp/cm while reduce noise, which is superior to TV.
Figure 8
Figure 8
(a1)–(a5) Reconstructed images of patient head. From left to right: FDK (50proj.), TV, EPTV, PCTV and full sampling FDK (500proj.). (b1)–(b5) Zoom in reconstruction images of clinical patient head on the first row. Edge map comparisons: (c1) is the weight map of last reconstruction iteration in EPTV while (c2) is the weight map used in PCTV. (c3) and (c4) are the zooming in of (c1) and (c2) respectively. Arrows point out the differences between weight map in EPTV and PCTV.
Figure 9
Figure 9
Comparisons of brain CBCT reconstructed via TV, EPTV and PCTV using a) 41 projections, b) 50 projection and c) 62 projections. Full sampling FDK using 500 projections are listed at the right column as the reference. Zooming in images are listed in the right and upper corner.
Figure 9
Figure 9
Comparisons of brain CBCT reconstructed via TV, EPTV and PCTV using a) 41 projections, b) 50 projection and c) 62 projections. Full sampling FDK using 500 projections are listed at the right column as the reference. Zooming in images are listed in the right and upper corner.
Figure 10
Figure 10
Left and right figures show the revolution curve of the relative error and edge cross correlation during 30 iteration using 36 half-fan XCAT projections
Figure 11
Figure 11
Comparisons of XCAT CBCT reconstructed via PCTV using different weighting factors and 45 projections. Weighting factors are increased from 0.2 to 1.0 from left to right columns in the (a) and (b). (a) shows weight map and reconstructed images using noise-free CBCT projections while (b) shows weight map and reconstructed images using CBCT projections with Poisson noise and normal noise (mean is 0 and standard deviation is 10). Relative error and edge cross correlation for TV, EPTV and PCTV as the function of the weighting factor for 45 half-fan CBCT projections with/without noise reconstruction were shown in the (c) and (d), respectively.
Figure 11
Figure 11
Comparisons of XCAT CBCT reconstructed via PCTV using different weighting factors and 45 projections. Weighting factors are increased from 0.2 to 1.0 from left to right columns in the (a) and (b). (a) shows weight map and reconstructed images using noise-free CBCT projections while (b) shows weight map and reconstructed images using CBCT projections with Poisson noise and normal noise (mean is 0 and standard deviation is 10). Relative error and edge cross correlation for TV, EPTV and PCTV as the function of the weighting factor for 45 half-fan CBCT projections with/without noise reconstruction were shown in the (c) and (d), respectively.
Figure 12
Figure 12
Comparisons of clinical head images reconstructed via PCTV using different weighting factors using 50 half-fan projections. Weighting factors are increased from 0.2, 0.6 to 1.0 from left to right columns. First row is weight map while the second row is reconstructed images with corresponding upper map.

References

    1. Yan D, et al. Adaptive radiation therapy. Physics in medicine and biology. 1997;42(1):123. - PubMed
    1. Létourneau D, et al. Cone-beam-CT guided radiation therapy: technical implementation. Radiotherapy and oncology. 2005;75(3):279–286. - PubMed
    1. Dawson LA, Jaffray DA. Advances in image-guided radiation therapy. Journal of clinical oncology. 2007;25(8):938–946. - PubMed
    1. Sonke JJ, et al. Frameless stereotactic body radiotherapy for lung cancer using four-dimensional cone beam CT guidance. International Journal of Radiation Oncology* Biology* Physics. 2009;74(2):567–574. - PubMed
    1. Harris W, et al. Estimating 4D-CBCT from prior information and extremely limited angle projections using structural PCA and weighted free-form deformation for lung radiotherapy. Medical physics. 2017;44(3):1089–1104. - PMC - PubMed

Publication types

MeSH terms

LinkOut - more resources