. 2018 Jun 1;119(6):2186-2193.
doi: 10.1152/jn.00766.2017. Epub 2018 Mar 14.

Contribution from motor unit firing adaptations and muscle coactivation during fatigue

Affiliations

Contribution from motor unit firing adaptations and muscle coactivation during fatigue

Paola Contessa et al. J Neurophysiol. .

Abstract

The control of motor unit firing behavior during fatigue is still debated in the literature. Most studies agree that the central nervous system increases the excitation to the motoneuron pool to compensate for decreased force contributions of individual motor units and sustain muscle force output during fatigue. However, some studies claim that motor units may decrease their firing rates despite increased excitation, contradicting the direct relationship between firing rates and excitation that governs the voluntary control of motor units. To investigate whether the control of motor units in fact changes with fatigue, we measured motor unit firing behavior during repeated contractions of the first dorsal interosseous (FDI) muscle while concurrently monitoring the activation of surrounding muscles, including the flexor carpi radialis, extensor carpi radialis, and pronator teres. Across all subjects, we observed an overall increase in FDI activation and motor unit firing rates by the end of the fatigue task. However, in some subjects we observed increases in FDI activation and motor unit firing rates only during the initial phase of the fatigue task, followed by subsequent decreases during the late phase of the fatigue task while the coactivation of surrounding muscles increased. These findings indicate that the strategy for sustaining force output may occasionally change, leading to increases in the relative activation of surrounding muscles while the excitation to the fatiguing muscle decreases. Importantly, irrespective of changes in the strategy for sustaining force output, the control properties regulating motor unit firing behavior remain unchanged during fatigue. NEW & NOTEWORTHY This work addresses sources of debate surrounding the manner in which motor unit firing behavior is controlled during fatigue. We found that decreases in the motor unit firing rates of the fatiguing muscle may occasionally be observed when the contribution of coactive muscles increases. Despite changes in the strategy employed to sustain the force output, the underlying control properties regulating motor unit firing behavior remain unchanged during muscle fatigue.

Keywords: firing rates; force-twitch; motor units; muscle coactivation; muscle fatigue.


Figures

Fig. 1.
Fig. 1.
Association between first dorsal interosseous (FDI) motor unit firing rates and activation of the FDI, flexor carpi radialis (FCR), extensor carpi radialis (ECR), and pronator teres (PT) muscles during the fatigue protocol. A: contractions performed by 1 subject at the beginning (left), middle (middle), and end (right) of the fatigue protocol. The solid black lines show the index finger abduction force. The time-varying mean firing rates of 86 motor units obtained from the 3 contractions are calculated using a 2-s Hanning window and shown in faded colors. The firing rates of motor units with similar motor unit action potential (MUAP) amplitude are shown in colored lines. Note the increase in mean firing rates from early-fatigue (left) to mid-fatigue (middle), and the decrease from mid-fatigue to late-fatigue (right). B: surface electromyographic (sEMG) signals recorded from the FDI muscle during the 3 contractions. The sEMG signal root mean square (RMS) amplitude during the analysis interval was 0.762 in the early-fatigue, 2.308 mV in the mid-fatigue, and 1.749 mV in the late-fatigue contractions. C: sEMG signals recorded from the FCR, ECR, and PT muscles during the 3 contractions. The sEMG signal RMS amplitude during the analysis interval was 0.113, 0.026, and 0.034 mV in the early-fatigue; 0.108, 0.060, and 0.042 mV in the mid-fatigue; and 0.204, 0.068, and 0.117 mV in the late-fatigue contraction for the FCR, ECR, and PT muscles, respectively.
Fig. 2.
Fig. 2.
First dorsal interosseous (FDI) motor unit firing rates increase, recruitment threshold decrease, and more motor units are recruited by the end of the fatigue task. A: subject-specific relation between average motor unit firing rate and motor unit action potential (MUAP) amplitude during the first (red) and last (blue) contractions of the series. Data were fit with exponential functions of the form y = A + Be−Cx. B: R2 of the regressions. C: the average firing rates of motor units with similar MUAP amplitude increase for all subjects at the completion of the fatigue task. D: the average recruitment threshold (rec thr) of motor units with similar MUAP amplitude increase for all subjects at the completion of the fatigue task. *Change is significant based on the 2-sample t-statistic using a threshold α = 0.05.
Fig. 3.
Fig. 3.
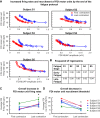
Association between changes in first dorsal interosseous (FDI) activation and motor unit firing rates throughout the fatigue protocol for all subjects. A: average firing rate of motor units with similar motor unit action potential (MUAP) amplitude in each contraction repetition. Larger-size data points indicate the first contraction, the mid-fatigue contraction where the highest average motor unit firing rates were observed, and the last contraction of the series, respectively. B: surface electromyographic (sEMG) signal root-mean-square (RMS) amplitude of the FDI muscle in each contraction repetition. The black dashed and continuous regression lines in A and B quantify the increasing and decreasing trend in FDI motor unit firing rates and FDI sEMG signal amplitude in the initial and late phase of the fatigue protocol, respectively. C: change in average motor unit firing rate between the beginning and end of the two phases. For each phase, different bars indicate individual subjects S1–S5. D: change in sEMG signal RMS amplitude of the FDI muscle between the beginning and end of the two phases. For each phase, different bars indicate individual subjects S1–S5. E: P values and slopes of the regression lines in A and B. *Slope is significantly different from the value 0 according to the 2-tailed t-statistic using a threshold α = 0.05.
Fig. 4.
Fig. 4.
Association between changes in first dorsal interosseous (FDI) motor unit firing rates and extensor carpi radialis (ECR), flexor carpi radialis (FCR), and pronator teres (PT) muscle activation during the late phase of the fatigue protocol. A: average firing rate of motor units with similar motor unit action potential (MUAP) amplitude in each contraction repetition during the late phase of the fatigue protocol. Larger-size data points indicate the first and last contractions of the phase. B: surface electromyographic (sEMG) signal root-mean-square (RMS) amplitude of the FCR, ECR, and PT muscles in each contraction repetition during the late phase of the fatigue protocol. Total sEMG RMS amplitude contribution from all muscles is presented as indication of overall muscle coactivation. The black regression lines in A and B quantify the progressive decrease in motor unit firing rates and the concurrent increase in FCR, ECR, and PT muscle activation. C: change in average motor unit firing rate between the beginning and end of the late phase. For each phase, different bars indicate individual subjects S1–S4. D: change in sEMG signal RMS amplitude of the FCR, ECR, and PT muscles between the beginning and end of the late phases. For each phase, different bars indicate individual subjects S1–S4. E: P values and slopes of the regression lines in A and B. *Slope is different from the value 0 according to the 2-tailed t-statistic using a threshold α = 0.05.
Fig. 5.
Fig. 5.
Adaptations in first dorsal interosseous (FDI) motor unit firing rates during the two phases of the fatigue protocol. A: subject-specific relation between average firing rate and motor unit action potential (MUAP) amplitude for motor units obtained from the beginning (red) and end (green) of the initial phase of the contraction (contr) series. B: subject-specific relation between average firing rate and MUAP amplitude for motor units obtained from the beginning (green) and end (blue) of the late phase of the contraction series. Data were fit with exponential functions of the form y = A + Be−Cx.

References

    1. Adam A, De Luca CJ. Firing rates of motor units in human vastus lateralis muscle during fatiguing isometric contractions. J Appl Physiol (1985) 99: 268–280, 2005. doi:10.1152/japplphysiol.01344.2004. - DOI - PubMed
    1. Bigland-Ritchie B, Cafarelli E, Vøllestad NK. Fatigue of submaximal static contractions. Acta Physiol Scand Suppl 556: 137–148, 1986a. - PubMed
    1. Bigland-Ritchie BR, Dawson NJ, Johansson RS, Lippold OC. Reflex origin for the slowing of motoneurone firing rates in fatigue of human voluntary contractions. J Physiol 379: 451–459, 1986b. doi:10.1113/jphysiol.1986.sp016263. - DOI - PMC - PubMed
    1. Contessa P, De Luca CJ, Kline JC. The compensatory interaction between motor unit firing behavior and muscle force during fatigue. J Neurophysiol 116: 1579–1585, 2016. doi:10.1152/jn.00347.2016. - DOI - PMC - PubMed
    1. D’Amico JM, Yavuz SU, Saraçoglu A, Atiş ES, Gorassini MA, Türker KS. Activation properties of trigeminal motoneurons in participants with and without bruxism. J Neurophysiol 110: 2863–2872, 2013. doi:10.1152/jn.00536.2013. - DOI - PMC - PubMed

Publication types

LinkOut - more resources