

Transcriptome Analysis Identifies a 140 kb Region of Chromosome 3B Containing Genes Specific to Fusarium Head Blight Resistance in Wheat
- PMID: 29538315
- PMCID: PMC5877713
- DOI: 10.3390/ijms19030852
Transcriptome Analysis Identifies a 140 kb Region of Chromosome 3B Containing Genes Specific to Fusarium Head Blight Resistance in Wheat
Abstract
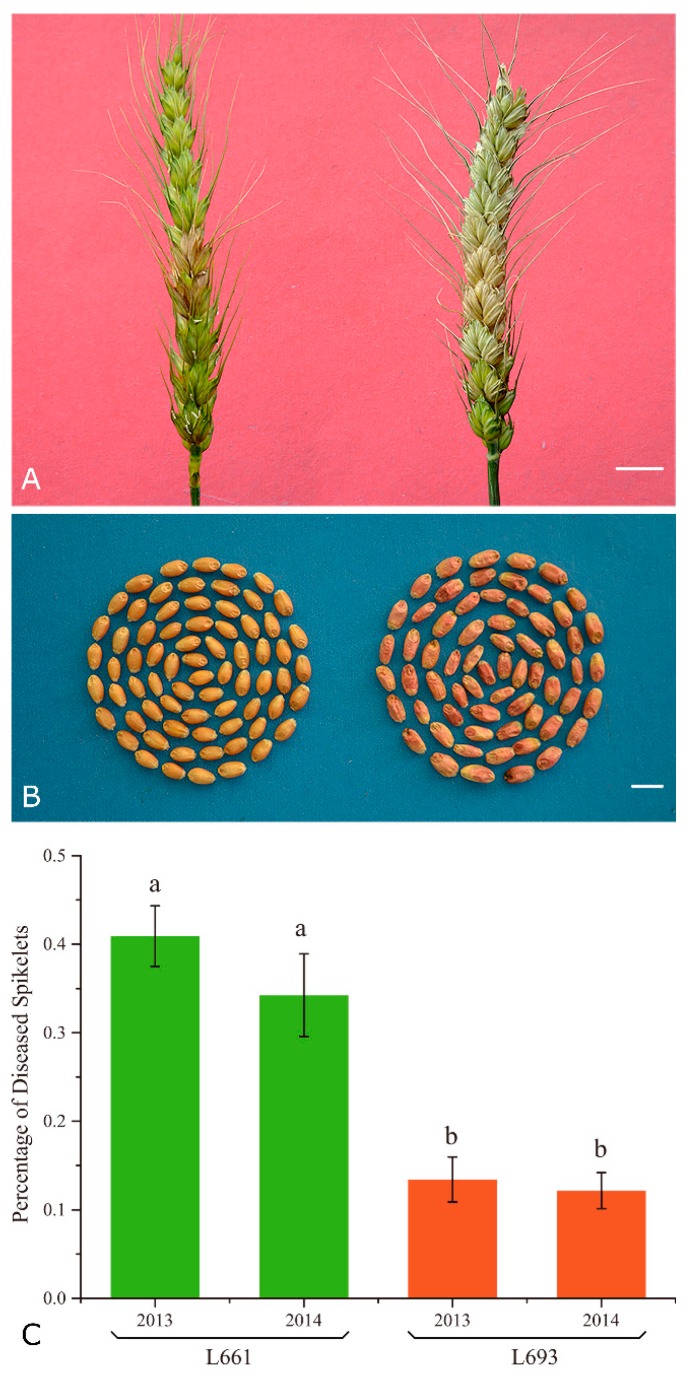
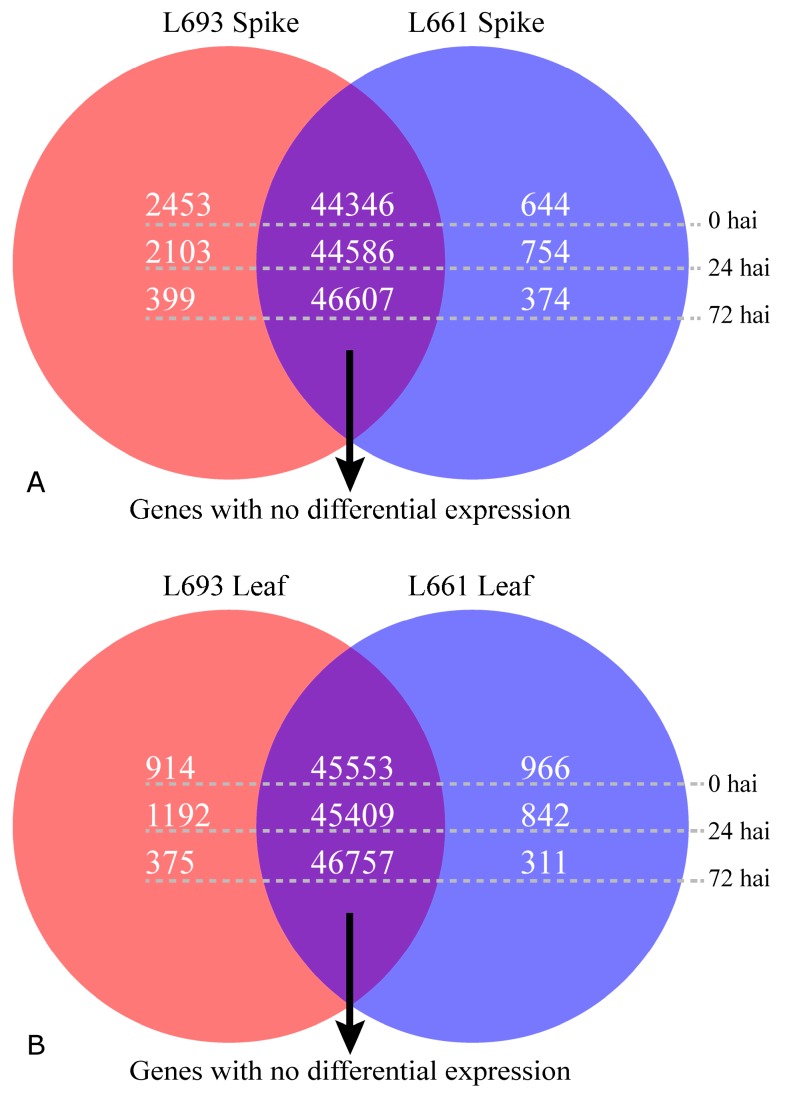
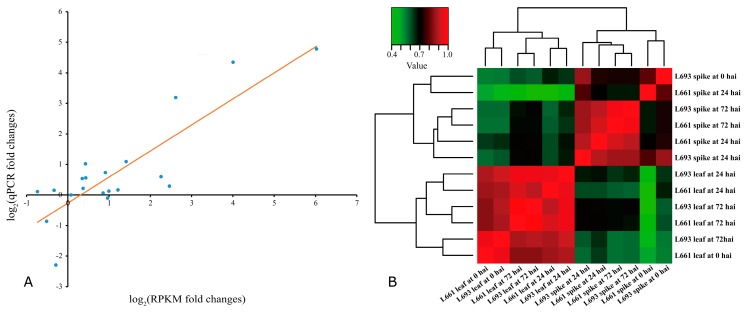
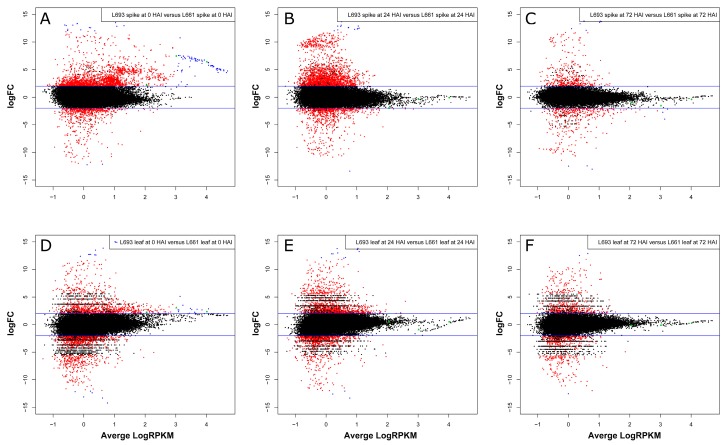
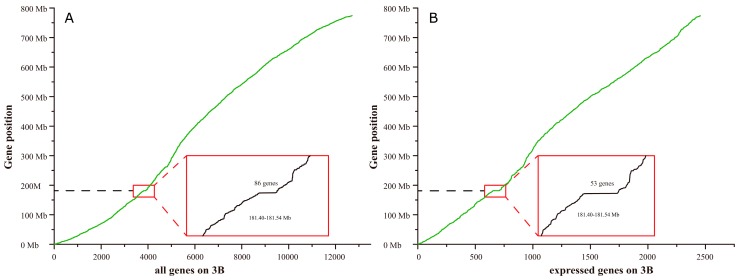
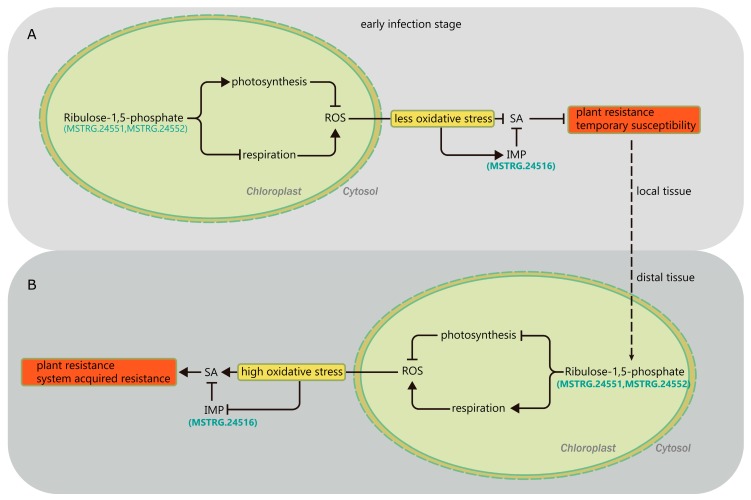
Fusarium head blight (FHB), mainly caused by Fusarium graminearum, is one of the most destructive fungal diseases of wheat (Triticum aestivum L.). Because of the quantitative nature of FHB resistance, its mechanism is poorly understood. We conducted a comparative transcriptome analysis to identify genes that are differentially expressed in FHB-resistant and FHB-susceptible wheat lines grown under field conditions for various periods after F. graminearum infection and determined the chromosomal distribution of the differentially expressed genes (DEGs). For each line, the expression in the spike (which exhibits symptoms in the infected plants) was compared with that in the flag leaves (which do not exhibit symptoms in the infected plants). We identified an island of 53 constitutive DEGs in a 140 kb region with high homology to the FhbL693b region on chromosome 3B. Of these genes, 13 were assigned to specific chloroplast-related pathways. Furthermore, one gene encoded inositol monophosphate (IMPa) and two genes encoded ribulose-1,5-bisphosphate carboxylase/oxygenase (RuBisCO). Our findings suggest that the temporary susceptibility in locally infected spikes results from the cross-talk between RuBisCO and IMPa, which blocks secondary signaling pathways mediated by salicylic acid and induces a systemic acquired resistance in the distant leaf tissue.
Keywords: fusarium head blight; gene island; photosynthesis; transcriptome; wheat.
Conflict of interest statement
The authors declare no conflict of interest.
Figures
Similar articles
-
Identification, characterization and mapping of differentially expressed genes in a winter wheat cultivar (Centenaire) resistant to Fusarium graminearum infection.Mol Biol Rep. 2012 Oct;39(10):9583-600. doi: 10.1007/s11033-012-1823-5. Epub 2012 Jun 21. Mol Biol Rep. 2012. PMID: 22718510
-
Transcriptome dynamics associated with resistance and susceptibility against fusarium head blight in four wheat genotypes.BMC Genomics. 2018 Aug 29;19(1):642. doi: 10.1186/s12864-018-5012-3. BMC Genomics. 2018. PMID: 30157778 Free PMC article.
-
Integrated metabolo-transcriptomics and functional characterization reveals that the wheat auxin receptor TIR1 negatively regulates defense against Fusarium graminearum.J Integr Plant Biol. 2021 Feb;63(2):340-352. doi: 10.1111/jipb.12992. Epub 2020 Aug 12. J Integr Plant Biol. 2021. PMID: 32678930
-
Fusarium Head Blight in Durum Wheat: Recent Status, Breeding Directions, and Future Research Prospects.Phytopathology. 2019 Oct;109(10):1664-1675. doi: 10.1094/PHYTO-03-19-0095-RVW. Epub 2019 Sep 3. Phytopathology. 2019. PMID: 31369363 Review.
-
Linking Multi-Omics to Wheat Resistance Types to Fusarium Head Blight to Reveal the Underlying Mechanisms.Int J Mol Sci. 2022 Feb 18;23(4):2280. doi: 10.3390/ijms23042280. Int J Mol Sci. 2022. PMID: 35216395 Free PMC article. Review.
Cited by
-
Plant Defense Genes against Biotic Stresses.Int J Mol Sci. 2018 Aug 19;19(8):2446. doi: 10.3390/ijms19082446. Int J Mol Sci. 2018. PMID: 30126226 Free PMC article. No abstract available.
-
Potential Role of Photosynthesis in the Regulation of Reactive Oxygen Species and Defence Responses to Blumeria graminis f. sp. tritici in Wheat.Int J Mol Sci. 2020 Aug 11;21(16):5767. doi: 10.3390/ijms21165767. Int J Mol Sci. 2020. PMID: 32796723 Free PMC article.
-
Molecular evidence of the avocado defense response to Fusarium kuroshium infection: a deep transcriptome analysis using RNA-Seq.PeerJ. 2021 Apr 14;9:e11215. doi: 10.7717/peerj.11215. eCollection 2021. PeerJ. 2021. PMID: 33954045 Free PMC article.
-
Transcriptome Dynamic Analysis Reveals New Candidate Genes Associated with Resistance to Fusarium Head Blight in Two Chinese Contrasting Wheat Genotypes.Int J Mol Sci. 2023 Feb 20;24(4):4222. doi: 10.3390/ijms24044222. Int J Mol Sci. 2023. PMID: 36835630 Free PMC article.
-
Transcriptome-based analysis of resistance mechanism to black point caused by Bipolaris sorokiniana in wheat.Sci Rep. 2021 Mar 25;11(1):6911. doi: 10.1038/s41598-021-86303-1. Sci Rep. 2021. PMID: 33767270 Free PMC article.
References
-
- Nigro D., Giove S., Fortunato S., Incerti O., Zacheo S., Blanco A., Gadaleta A. Allelic variation of wheat flour allergens in a collection of wheat genotypes. J. Chem. 2014;2014 doi: 10.1155/2014/629379. - DOI
-
- Gilbert J., Haber S. Overview of some recent research developments in fusarium head blight of wheat. Can. J. Plant Pathol. 2013;35:149–174. doi: 10.1080/07060661.2013.772921. - DOI
MeSH terms
Substances
LinkOut - more resources
Full Text Sources
Other Literature Sources
