. 2018 Mar 14;19(3):853.
doi: 10.3390/ijms19030853.

Impairment of Meristem Proliferation in Plants Lacking the Mitochondrial Protease AtFTSH4

Affiliations

Impairment of Meristem Proliferation in Plants Lacking the Mitochondrial Protease AtFTSH4

Alicja Dolzblasz et al. Int J Mol Sci. .

Abstract

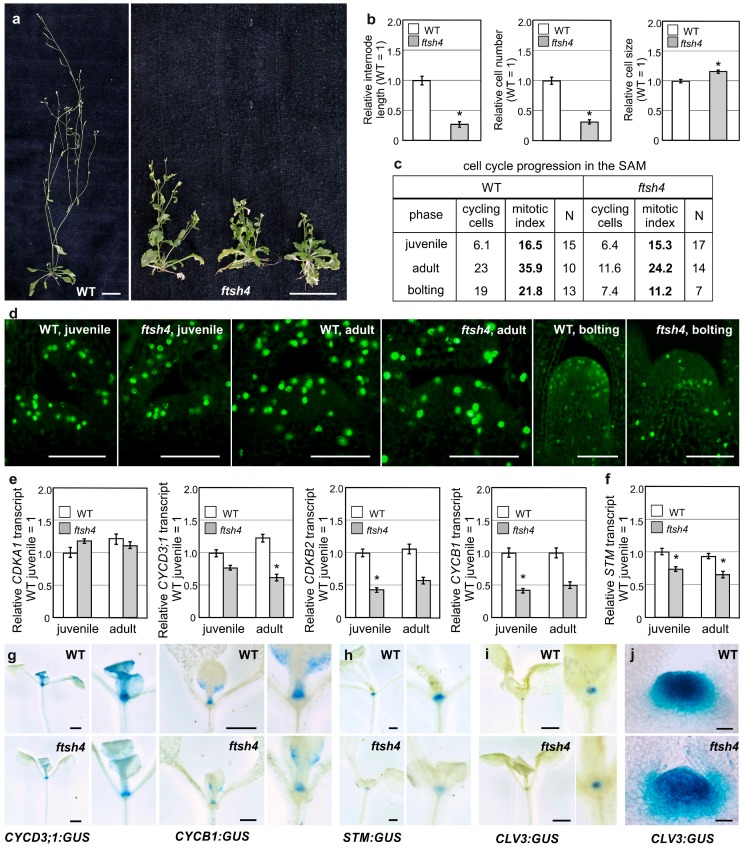
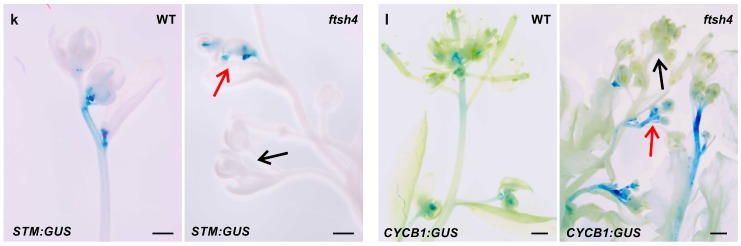
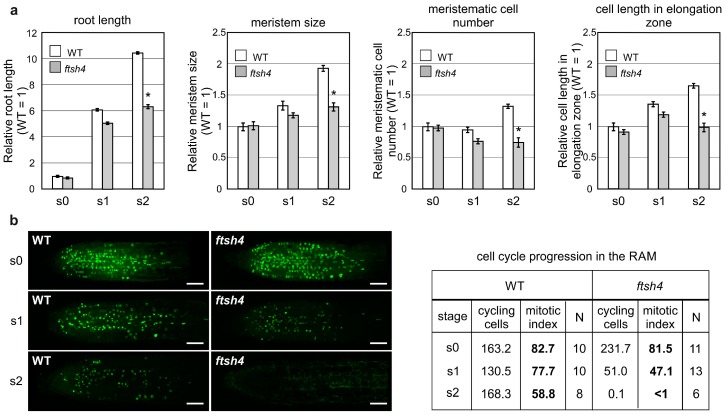
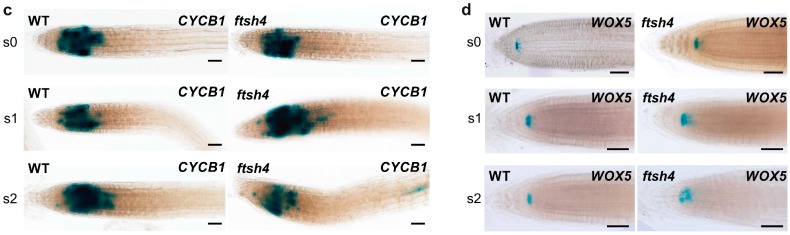
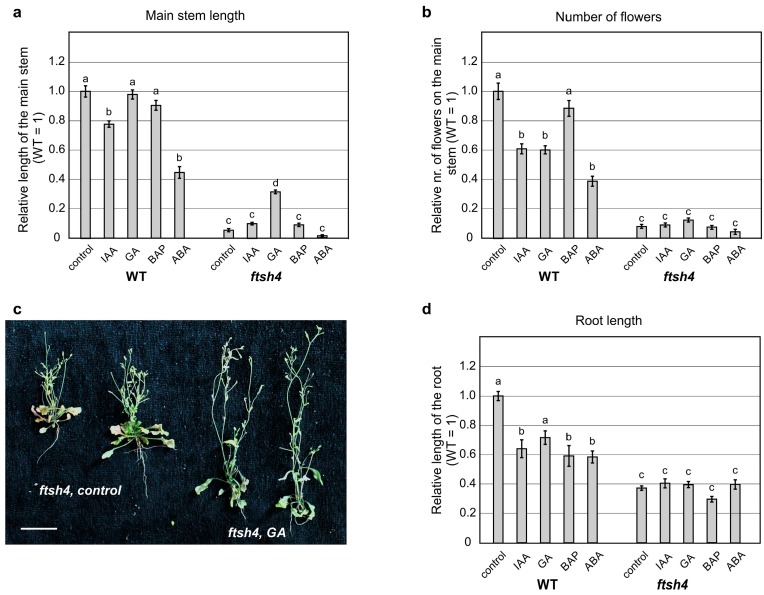
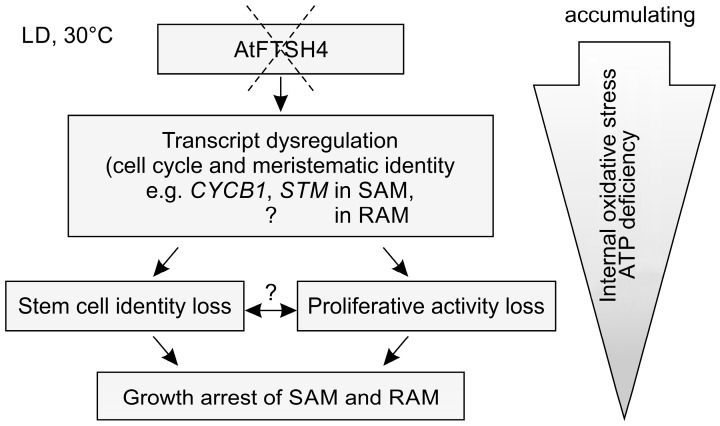
Shoot and root apical meristems (SAM and RAM, respectively) are crucial to provide cells for growth and organogenesis and therefore need to be maintained throughout the life of a plant. However, plants lacking the mitochondrial protease AtFTSH4 exhibit an intriguing phenotype of precocious cessation of growth at both the shoot and root apices when grown at elevated temperatures. This is due to the accumulation of internal oxidative stress and progressive mitochondria dysfunction. To explore the impacts of the internal oxidative stress on SAM and RAM functioning, we study the expression of selected meristem-specific (STM, CLV3, WOX5) and cell cycle-related (e.g., CYCB1, CYCD3;1) genes at the level of the promoter activity and/or transcript abundance in wild-type and loss-of-function ftsh4-1 mutant plants grown at 30 °C. In addition, we monitor cell cycle progression directly in apical meristems and analyze the responsiveness of SAM and RAM to plant hormones. We show that growth arrest in the ftsh4-1 mutant is caused by cell cycle dysregulation in addition to the loss of stem cell identity. Both the SAM and RAM gradually lose their proliferative activity, but with different timing relative to CYCB1 transcriptional activity (a marker of G2-M transition), which cannot be compensated by exogenous hormones.

Keywords: Arabidopsis; cell divisions; mitochondria; oxidative stress; root apical meristem; shoot apical meristem.


Conflict of interest statement

The authors declare no conflict of interest.

Figures

Figure 1
Figure 1
Impairment of proliferative activity and stem cell identity in shoots of ftsh4-1 mutants grown at 30 °C. (a) Phenotypes of adult wild-type (WT) and ftsh4-1 mutant plants grown under long day photoperiod (LD) conditions at 30 °C. The ftsh4-1 mutants show a different degree of shortening of the main inflorescence stem and branching prior to growth cessation (note the drying rosette leaves). Scale bar: 20 mm; (b) lengths of the first internode and the number and size of cells in the first internode of WT and ftsh4-1 mutant plants grown under LD conditions at 30 °C. The results are shown as relative to the WT samples (average values for WT plants are as follow: internode length 18.5 mm, cell number 54.3, elongation zone cells size 298.7 μm). Internode length and cell number strongly decreases, while cell size is less affected in the ftsh4-1 mutants. Two biological replicates of the experiment were performed. The internode length and number of cells was measured in 10 plants of each genotype; average cell size was estimated from randomly measured 10 cells per internode. Mean values (±SE) are shown and significant differences between bars at p < 0.05 are denoted by asterisks; (c,d) comparison of S-phase progression (cell division) directly in the meristems of juvenile vegetative, adult vegetative and bolting wild-type and ftsh4-1 mutants grown at 30 °C. The table shows the total number of cycling cells (i.e., in S-phase) and the mitotic index (percentage of cycling cells relative to the total number of SAM cells) in juvenile vegetative, adult vegetative and bolting wild-type and ftsh4-1 mutant plants (c). In comparison to WT plants, a decrease in the number of S-phase cells (green signal) was detected only in adult and bolting ftsh4-1 mutant plants. Scale bars: 50 μm (d); (e) comparison of AtCDKA1, AtCYCD3;1, AtCYCB1 and AtCDKB2;1 transcript levels analyzed in juvenile and adult vegetative shoot apices of WT and ftsh4-1 mutant plants grown under LD conditions at 30 °C. Abundance of transcripts in each case is expressed relative to the juvenile WT tissue samples. Results from three experiments are shown; (f) the comparison of AtSTM transcript level analyzed in juvenile and adult vegetative shoot apices of WT and ftsh4-1 mutant plants grown under LD conditions at 30 °C. Abundance of transcripts is expressed relative to the juvenile WT tissue samples. Results from three experiments are shown; (g,h) activity of the AtCYCD3;1 and AtCYCB1 (g) as well as AtSTM (h) promoters visualized by the activity of the GUS reporter protein (blue). Transgenic plants were grown under LD conditions at 30 °C and expression levels were analyzed during the juvenile vegetative stage of development of the WT (upper panels) and ftsh4-1 mutants (lower panels). In each case, ftsh4-1 mutants were characterized by weaker GUS activity. Scale bars: 3 mm; (i,j) activity of the AtCLV3 promoter visualized by the activity of the GUS reporter protein (blue). At 30 °C, in the juvenile SAM, GUS activity accumulates similarly in both genotypes (i), but in adult vegetative SAM (prepared with vibratome sections), ftsh4-1 mutants are characterized by weaker and more diffusible GUS activity in comparison to the WT (j). Scale bars: 3 mm (i) and 20 μm (j); (k,l) activity of the AtSTM (k) and AtCYCB1 (l) promoters visualized by the activity of the GUS reporter protein (blue). Plants were grown under LD conditions at 30 °C and expression levels were analyzed during the generative stage of development. After transition to flowering, GUS activity in adult ftsh4-1 mutant plants grown is variable (in terms of the strength of the signal) in the inflorescence apices (black arrows point exemplary shoot apices without GUS signal, red arrows—exemplary shoot apices with GUS signal). Scale bar: 15 mm.
Figure 1
Figure 1
Impairment of proliferative activity and stem cell identity in shoots of ftsh4-1 mutants grown at 30 °C. (a) Phenotypes of adult wild-type (WT) and ftsh4-1 mutant plants grown under long day photoperiod (LD) conditions at 30 °C. The ftsh4-1 mutants show a different degree of shortening of the main inflorescence stem and branching prior to growth cessation (note the drying rosette leaves). Scale bar: 20 mm; (b) lengths of the first internode and the number and size of cells in the first internode of WT and ftsh4-1 mutant plants grown under LD conditions at 30 °C. The results are shown as relative to the WT samples (average values for WT plants are as follow: internode length 18.5 mm, cell number 54.3, elongation zone cells size 298.7 μm). Internode length and cell number strongly decreases, while cell size is less affected in the ftsh4-1 mutants. Two biological replicates of the experiment were performed. The internode length and number of cells was measured in 10 plants of each genotype; average cell size was estimated from randomly measured 10 cells per internode. Mean values (±SE) are shown and significant differences between bars at p < 0.05 are denoted by asterisks; (c,d) comparison of S-phase progression (cell division) directly in the meristems of juvenile vegetative, adult vegetative and bolting wild-type and ftsh4-1 mutants grown at 30 °C. The table shows the total number of cycling cells (i.e., in S-phase) and the mitotic index (percentage of cycling cells relative to the total number of SAM cells) in juvenile vegetative, adult vegetative and bolting wild-type and ftsh4-1 mutant plants (c). In comparison to WT plants, a decrease in the number of S-phase cells (green signal) was detected only in adult and bolting ftsh4-1 mutant plants. Scale bars: 50 μm (d); (e) comparison of AtCDKA1, AtCYCD3;1, AtCYCB1 and AtCDKB2;1 transcript levels analyzed in juvenile and adult vegetative shoot apices of WT and ftsh4-1 mutant plants grown under LD conditions at 30 °C. Abundance of transcripts in each case is expressed relative to the juvenile WT tissue samples. Results from three experiments are shown; (f) the comparison of AtSTM transcript level analyzed in juvenile and adult vegetative shoot apices of WT and ftsh4-1 mutant plants grown under LD conditions at 30 °C. Abundance of transcripts is expressed relative to the juvenile WT tissue samples. Results from three experiments are shown; (g,h) activity of the AtCYCD3;1 and AtCYCB1 (g) as well as AtSTM (h) promoters visualized by the activity of the GUS reporter protein (blue). Transgenic plants were grown under LD conditions at 30 °C and expression levels were analyzed during the juvenile vegetative stage of development of the WT (upper panels) and ftsh4-1 mutants (lower panels). In each case, ftsh4-1 mutants were characterized by weaker GUS activity. Scale bars: 3 mm; (i,j) activity of the AtCLV3 promoter visualized by the activity of the GUS reporter protein (blue). At 30 °C, in the juvenile SAM, GUS activity accumulates similarly in both genotypes (i), but in adult vegetative SAM (prepared with vibratome sections), ftsh4-1 mutants are characterized by weaker and more diffusible GUS activity in comparison to the WT (j). Scale bars: 3 mm (i) and 20 μm (j); (k,l) activity of the AtSTM (k) and AtCYCB1 (l) promoters visualized by the activity of the GUS reporter protein (blue). Plants were grown under LD conditions at 30 °C and expression levels were analyzed during the generative stage of development. After transition to flowering, GUS activity in adult ftsh4-1 mutant plants grown is variable (in terms of the strength of the signal) in the inflorescence apices (black arrows point exemplary shoot apices without GUS signal, red arrows—exemplary shoot apices with GUS signal). Scale bar: 15 mm.
Figure 2
Figure 2
Impairment of proliferative activity and quiescence center (QC) cell identity in ftsh4-1 mutant roots. (a) The length of the root and root apical meristem (RAM), the number of the RAM cells and the size of the cells in the elongation zone of wild-type (WT) and ftsh4-1 mutant plants grown under long day photoperiod (LD) conditions at 30 °C. Seeds were germinated and grown for three days at 22 °C, and then transferred to 30 °C (S0) to continue growing for three days (S1) and six days (S2). Results are expressed relative to the WT S0 sample (average values for WT plants from S0 are as follow: root length 2.6 mm, meristem size 164 μm, meristematic cells number 14.4, cell length in elongation zone 127 μm). WT and mutant plants are comparable at S0 and S1 time-point, but then root and RAM size, RAM cell number and elongation cells size decreases in the ftsh4-1 mutant S2 sample in comparison to the WT S2 sample. Two biological replicates of the experiment were performed. The root length, meristem length and meristematic cells number was measured in at least 10 plants of each genotypes; average size of cells in the elongation zone was estimated from randomly measured three cells per root. Mean values (±SE) are shown and significant differences between bars at p < 0.05 are denoted by asterisks; (b) comparison of S-phase progression (cell division) directly in the meristems of S0 (at the time of transfer), S1 and S2 RAM of wild-type and ftsh4-1 mutants grown at 30 °C. A decreased in the number of S-phase cells (green signal) was detected in the S1 ftsh4-1 mutant plants in comparison to WT plants. Scale bars: 40 μm. The table shows the total number of cycling cells (i.e., in S-phase) and the mitotic index (percentage of cycling cells relative to the total number of SAM cells) in S0, S1 and S2 wild-type and ftsh4-1 mutant plants grown at 30 °C; (c,d) activity of the AtCYCB1 (c) and AtWOX5 (d) promoters visualized by the activity of the GUS reporter protein (blue). Transgenic plants were grown as described in (a) and expression levels were analyzed during the S0, S1 and S2 stages of development in the WT and ftsh4-1 mutants. ftsh4-1 mutants were characterized by comparable GUS activity for both promoters at S0 and S1 stages, only slightly weaker activity (not fully penetrant phenotype) in case of the AtCYCB1 promoter (c) and much weaker and diffusible in case of the AtWOX5 promoter (d) in the S2 stage. Scale bars: 40 μm.
Figure 2
Figure 2
Impairment of proliferative activity and quiescence center (QC) cell identity in ftsh4-1 mutant roots. (a) The length of the root and root apical meristem (RAM), the number of the RAM cells and the size of the cells in the elongation zone of wild-type (WT) and ftsh4-1 mutant plants grown under long day photoperiod (LD) conditions at 30 °C. Seeds were germinated and grown for three days at 22 °C, and then transferred to 30 °C (S0) to continue growing for three days (S1) and six days (S2). Results are expressed relative to the WT S0 sample (average values for WT plants from S0 are as follow: root length 2.6 mm, meristem size 164 μm, meristematic cells number 14.4, cell length in elongation zone 127 μm). WT and mutant plants are comparable at S0 and S1 time-point, but then root and RAM size, RAM cell number and elongation cells size decreases in the ftsh4-1 mutant S2 sample in comparison to the WT S2 sample. Two biological replicates of the experiment were performed. The root length, meristem length and meristematic cells number was measured in at least 10 plants of each genotypes; average size of cells in the elongation zone was estimated from randomly measured three cells per root. Mean values (±SE) are shown and significant differences between bars at p < 0.05 are denoted by asterisks; (b) comparison of S-phase progression (cell division) directly in the meristems of S0 (at the time of transfer), S1 and S2 RAM of wild-type and ftsh4-1 mutants grown at 30 °C. A decreased in the number of S-phase cells (green signal) was detected in the S1 ftsh4-1 mutant plants in comparison to WT plants. Scale bars: 40 μm. The table shows the total number of cycling cells (i.e., in S-phase) and the mitotic index (percentage of cycling cells relative to the total number of SAM cells) in S0, S1 and S2 wild-type and ftsh4-1 mutant plants grown at 30 °C; (c,d) activity of the AtCYCB1 (c) and AtWOX5 (d) promoters visualized by the activity of the GUS reporter protein (blue). Transgenic plants were grown as described in (a) and expression levels were analyzed during the S0, S1 and S2 stages of development in the WT and ftsh4-1 mutants. ftsh4-1 mutants were characterized by comparable GUS activity for both promoters at S0 and S1 stages, only slightly weaker activity (not fully penetrant phenotype) in case of the AtCYCB1 promoter (c) and much weaker and diffusible in case of the AtWOX5 promoter (d) in the S2 stage. Scale bars: 40 μm.
Figure 3
Figure 3
Lack of responsiveness to exogenous hormones in the shoots and roots of the ftsh4-1 mutants grown at 30 °C. (a,b) Height of the main inflorescence (a) and the number of flowers on the main inflorescence (b) of wild-type (WT) and ftsh4-1 mutant plants grown under long day photoperiod (LD) conditions at 30 °C. The results are expressed relative to the WT control sample (plants without exogenous hormone application). Average values for WT control plants are as follow: main stem length 35.6 mm, number of flowers 21. The main inflorescence height of the ftsh4-1 mutants increases after gibberellic acid (GA3) application (a), but the number of flowers is not significantly changed (b). Mean values (±SE) are shown; (c) the phenotype of adult (when rosette leaves are drying) ftsh4-1 mutant plants grown under LD conditions at 30 °C. ftsh4-1 mutants without exogenous hormone application are shown on the left, and those after gibberellic acid application are shown on the right. Scale bar: 20 mm; (d) the length of the main root of WT and ftsh4-1 mutant plants, grown under LD conditions at 30 °C. Seeds were germinated and grown for three days at 22 °C, transferred to 30 °C to continue the growth for six days and then analyzed. The results are shown relative to the WT control sample (without exogenous hormone application). Mean values (±SE) are shown and significant differences in the WT and ftsh4-1 mutant plants after various hormones application in comparison to their control plants (WT or ftsh4-1), at p < 0.05, are indicated with different letters: a and b between treated and not-treated WT plants; c and d between treated and not-treated ftsh4-1 plants.
Figure 4
Figure 4
Developmental impairment of meristem proliferation and stem cell identity in plants lacking the mitochondrial protease AtFTSH4. In stress-inducing conditions of mildly elevated temperature of 30 °C, absence of AtFTSH4 in mitochondria (shown as dashed X) results in progressive accumulation of internal oxidative stress (ROS, carbonylated proteins, AOX transcripts) with time/plant age and ATP deficiency [22,24,25]. Stem cells within the meristems lose their meristematic characteristics and ability to proliferate. In the shoot apical meristem (SAM), this relates to the transcript dysregulation of cell cycle-related genes and those sustaining meristematic identity. Ultimately, growth of the SAM and RAM in the ftsh4-1 mutant plants is precociously arrested. Question marks refer to probable, but not yet proven experimentally correlations.

References

    1. Aichinger E., Kornet N., Friedrich T., Laux T. Plant Stem Cell Niches. Annu. Rev. Plant Biol. 2012;63:615–636. doi: 10.1146/annurev-arplant-042811-105555. - DOI - PubMed
    1. Gaillochet C., Lohmann J.U. The Never-ending Story: From Pluripotency to Plant Developmental Plasticity. Development. 2015;142:2237–2249. doi: 10.1242/dev.117614. - DOI - PMC - PubMed
    1. Evert R.F., Eichhorn S.E., editors. Esau’s Plant Anatomy: Meristems, Cells, and Tissues of the Plant Body: Their Structure, Function, and Development. 3rd ed. John Wiley & Sons; New York, NY, USA: 2007.
    1. Den Boer B.G., Murray J.A. Triggering the Cell Cycle in Plants. Trends Cell Biol. 2000;10:245–250. doi: 10.1016/S0962-8924(00)01765-7. - DOI - PubMed
    1. Donnelly P.M., Bonetta D., Tsukaya H., Dengler R.E., Dengler N.G. Cell Cycling and Cell Enlargement in Developing Leaves of Arabidopsis. Dev. Biol. 1999;215:407–419. doi: 10.1006/dbio.1999.9443. - DOI - PubMed

LinkOut - more resources