. 2018 Mar 14;16(3):e2004248.
doi: 10.1371/journal.pbio.2004248. eCollection 2018 Mar.

Modifying and reacting to the environmental pH can drive bacterial interactions

Affiliations

Modifying and reacting to the environmental pH can drive bacterial interactions

Christoph Ratzke et al. PLoS Biol. .

Abstract

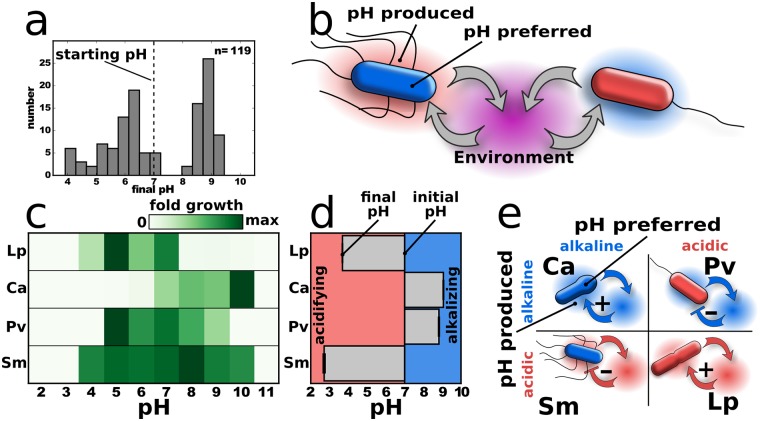
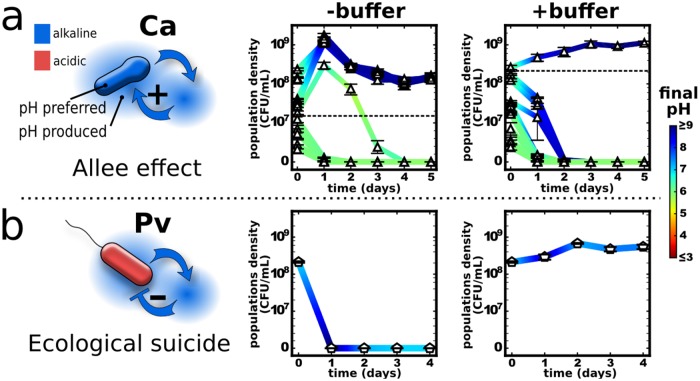
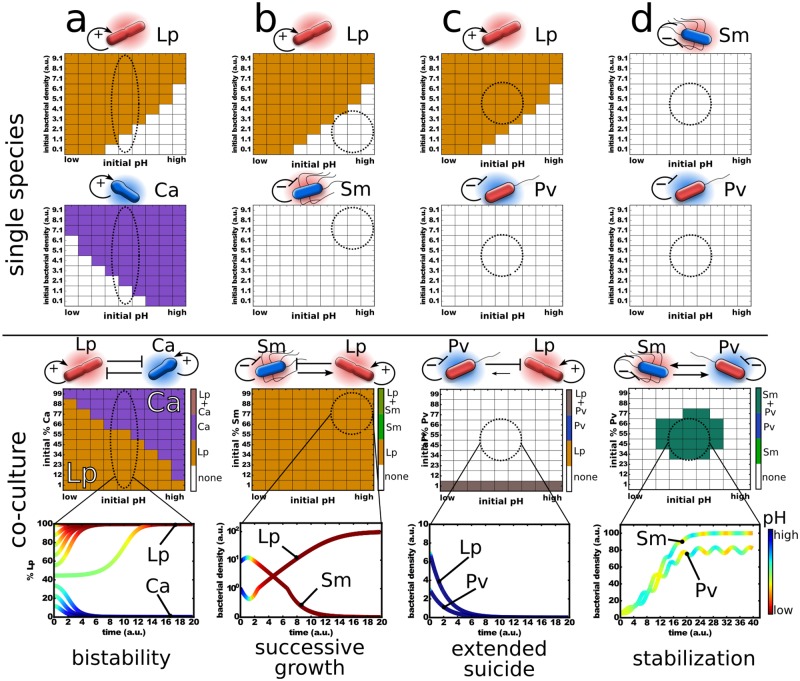
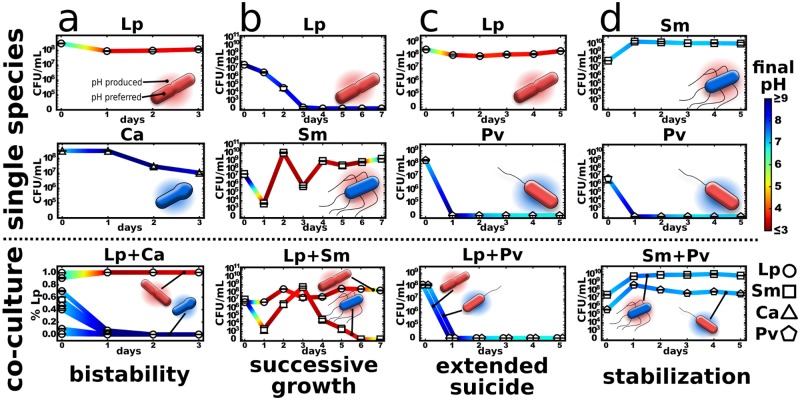
Microbes usually exist in communities consisting of myriad different but interacting species. These interactions are typically mediated through environmental modifications; microbes change the environment by taking up resources and excreting metabolites, which affects the growth of both themselves and also other microbes. We show here that the way microbes modify their environment and react to it sets the interactions within single-species populations and also between different species. A very common environmental modification is a change of the environmental pH. We find experimentally that these pH changes create feedback loops that can determine the fate of bacterial populations; they can either facilitate or inhibit growth, and in extreme cases will cause extinction of the bacterial population. Understanding how single species change the pH and react to these changes allowed us to estimate their pairwise interaction outcomes. Those interactions lead to a set of generic interaction motifs-bistability, successive growth, extended suicide, and stabilization-that may be independent of which environmental parameter is modified and thus may reoccur in different microbial systems.


Conflict of interest statement

The authors have declared that no competing interests exist.

Figures

Fig 1
Fig 1. Bacteria modify the environment and react to it.
(a) A collection of soil bacteria grown in a medium that contains urea and glucose can lower or increase the pH (initially set to pH 7, dashed line). The soil the microbes were isolated from has a buffer capacity similar to the experimental medium (S2 Fig). Also, growing the soil bacteria in Luria-Bertani medium causes pH changes (S2 Fig). (b) By changing the environment, bacteria influence themselves but also other microbes in the community. (c) Lactobacillus plantarum and Pseudomonas veronii prefer acidic, Corynebacterium ammoniagenes prefers alkaline, and Serratia marcescens has a slight preference towards alkaline environments. Fold growth in 24 h is shown. The bacteria were grown on buffered medium with low nutrients to minimize pH change during growth (Materials and methods and S2 Fig). (d) Starting at pH 7, L. plantarum and S. marcescens decrease and C. ammoniagenes and P. veronii increase the pH. Only little buffering, 10 g/L glucose and 8 g/L urea as substrates were used in (d). (e) Microbes can increase or decrease the pH (blue environment is alkaline, and red environment is acidic) and thus produce a more or less suitable environment for themselves. Blue bacteria prefer and/or tolerate alkaline and red acidic conditions. The soil bacteria in (a) were isolated from local soil, whereas the 4 species in (c) to (e) were obtained from a strain library (see Materials and methods for details). The data for this figure can be found in S1 Data. Ca, Corynebacterium ammoniagenes; Lp, Lactobacillus plantarum; Pv, Pseudomonas veronii; Sm, Serratia marcescens.
Fig 2
Fig 2. Single species can enhance or inhibit their own growth via changing the pH.
The curves show bacterial density over time, and the color shows the pH. (a) C. ammoniagenes increases the pH and also prefers these higher pH values, leading to a minimal viable cell density required for survival. Increasing the buffer concentration from 10 mM (−buffer) to 100 mM (+buffer) phosphate makes it more difficult for C. ammoniagenes to alkalize the environment and therefore increases the minimal viable cell density. (b) P. veronii also increases the pH yet prefers low pH values. Indeed, P. veronii populations can change the environment so drastically that it causes the population to go extinct. Adding buffer tempers the pH change and thus allows for the survival of P. veronii. An Allee effect can also be found in L. plantarum and ecological suicide in S. marcescens (S8 Fig). Note that buffering often just slightly affects the final pH values (S2 Fig) but saves the population by delaying the pH change (as shown in S4 Fig and discussed in more detail in [35]). Linlog scale is used for the y-axis. The data for this figure can be found in S1 Data. Ca, Corynebacterium ammoniagenes; CFU, colony-forming unit; Pv, Pseudomonas veronii.
Fig 3
Fig 3. The metabolic properties of the different species may allow estimation of their interactions.
A simple model based on differential equations was set up to qualitatively simulate the bacterial growth (see main text). The survival of the species at the end of the simulation for different initial parameter values are plotted as follows. A species that is extinct at the end of the simulation run either did not grow under these conditions, was outcompeted by another species, or went extinct by ecological suicide. The upper two rows of panels show the simulation outcome for the single species. The third row of panels shows the outcomes of the cocultures, for which representative time series of the phase diagrams marked by the dashed circles are shown in the bottom row. The “pH” scale reaches from low to high, which corresponds to a “proton concentration” of 10 to 0. σ was set to 4 and δ to 0.5. ca/b was set to +/− 0.1, b to 5, and d as described in the S1 Text. (a) L. plantarum and C. ammoniagenes show bistability in coculture depending on the initial fraction and pH. (b) L. plantarum and S. marcescens show successive growth at high initial pH values, for which L. plantarum can only survive if the pH was first lowered by S. marcescens. Note that a high percentage of S. marcescens in the coculture panel (dashed circle) means low S. marcescens and high L. plantarum in the upper panels. (c) If P. veronii lowers the proton concentration by enough, it can kill itself and also L. plantarum, resulting in extended suicide. The coexistence at initial low ratios of P. veronii is caused by oscillatory dynamics as shown in S12 Fig. (d) S. marcescens and P. veronii can protect each other from ecological suicide and coexist, whereas they cannot survive on their own. The effect of varying interaction strength and initial conditions are shown in S11 Fig. We use the words bistability, successive growth, extended suicide, and stabilization merely to characterize the interaction outcomes and not any “intentions” of the bacteria. Linlog scale is used for the y-axis. Ca, Corynebacterium ammoniagenes; Lp, Lactobacillus plantarum; Pv, Pseudomonas veronii; Sm, Serratia marcescens.
Fig 4
Fig 4. Modifying the environment drives interactions between microbes.
Four different interaction types can be found depending on how the environmental changes act on the organisms themselves and each other. (a) L. plantarum and C. ammoniagenes produce bistability. (b) S. marcescens and L. plantarum show successive growth. (c) P. veronii commits extended suicide on L. plantarum. (d) S. marcescens can stabilize P. veronii when the medium is sufficiently buffered. For a more detailed description of the different interactions cases, see the main text. The media composition and protocols are slightly different for the different cases. See Materials and methods for details. We use the words bistability, successive growth, extended suicide, and stabilization merely to characterize the interactions outcomes and not any “intentions” of the bacteria. Linlog scale is used for the y-axis. The bacteria were diluted every 24 h into fresh media with a dilution factor of 1/100x (a and b) or 1/10x (c and d). The data for this figure can be found in S1 Data. Ca, Corynebacterium ammoniagenes; CFU, colony-forming unit; Lp, Lactobacillus plantarum; Pv, Pseudomonas veronii; Sm, Serratia marcescens.

References

    1. Atlas RM, Bartha R. Microbial ecology: Fundamentals and applications. 1986. [Cited 16 February 2017]. https://www.osti.gov/scitech/biblio/5758135.
    1. Faust K, Raes J. Microbial interactions: from networks to models. Nat Rev Microbiol. 2012;10: 538–550. doi: 10.1038/nrmicro2832 - DOI - PubMed
    1. Fuhrman JA. Microbial community structure and its functional implications. Nature. 2009;459: 193–199. doi: 10.1038/nature08058 - DOI - PubMed
    1. Raes J, Bork P. Molecular eco-systems biology: towards an understanding of community function. Nat Rev Microbiol. 2008;6: 693–699. doi: 10.1038/nrmicro1935 - DOI - PubMed
    1. Strom SL. Microbial Ecology of Ocean Biogeochemistry: A Community Perspective. Science. 2008;320: 1043–1045. doi: 10.1126/science.1153527 - DOI - PubMed

Publication types