. 2018 Apr 1;141(4):1201-1217.
doi: 10.1093/brain/awy049.

FDG-PET in tau-negative amnestic dementia resembles that of autopsy-proven hippocampal sclerosis

Affiliations

FDG-PET in tau-negative amnestic dementia resembles that of autopsy-proven hippocampal sclerosis

Hugo Botha et al. Brain. .

Abstract

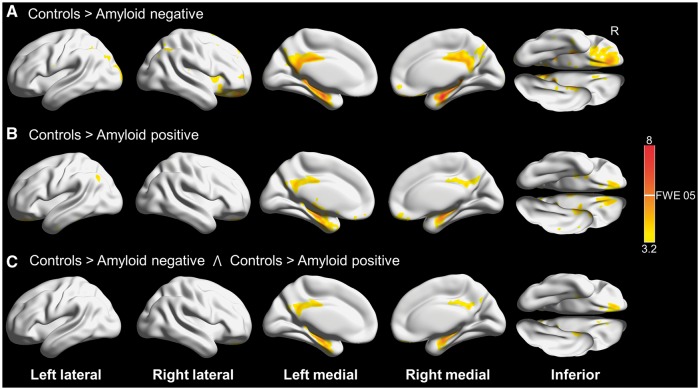
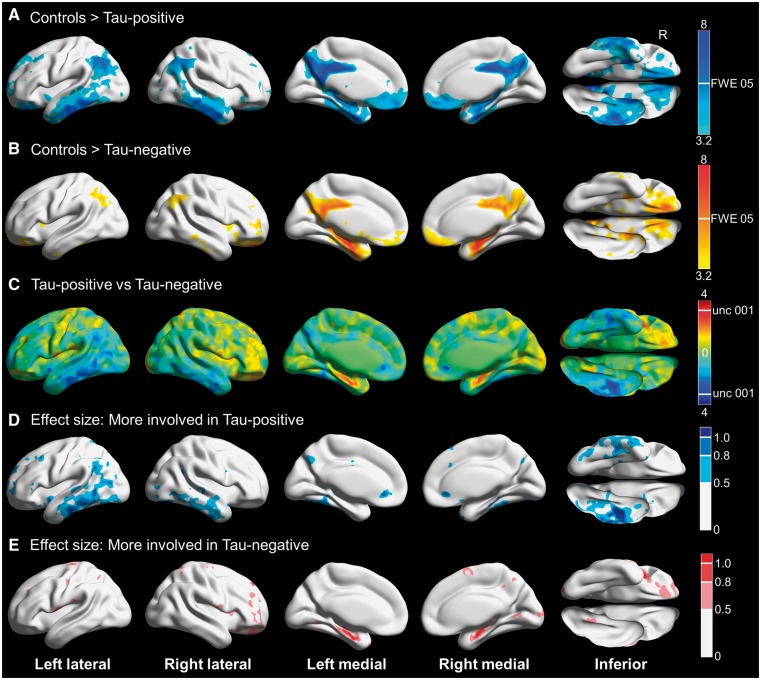
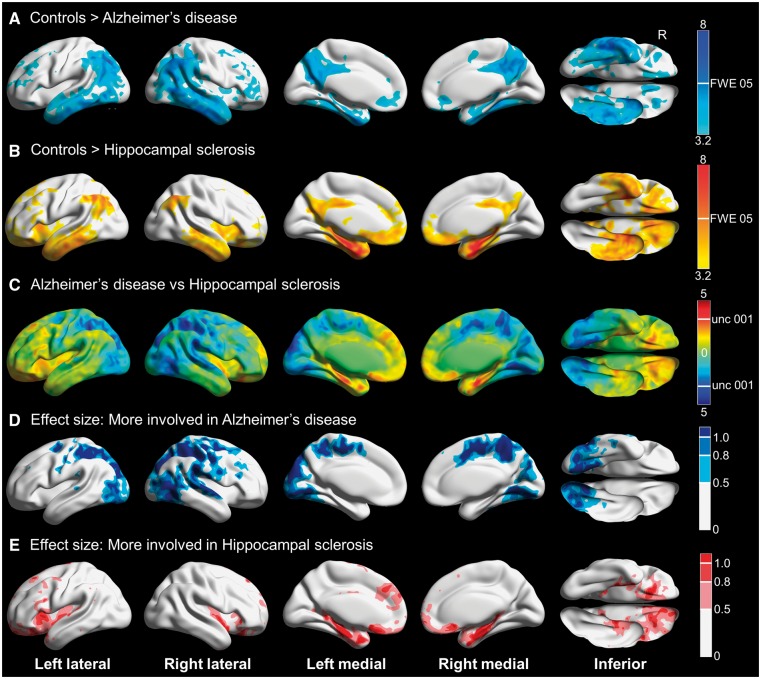
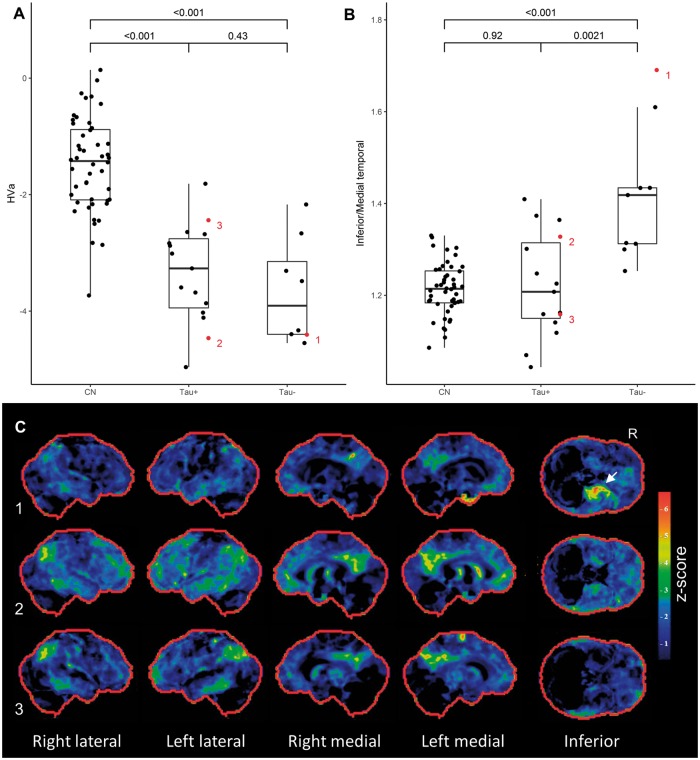
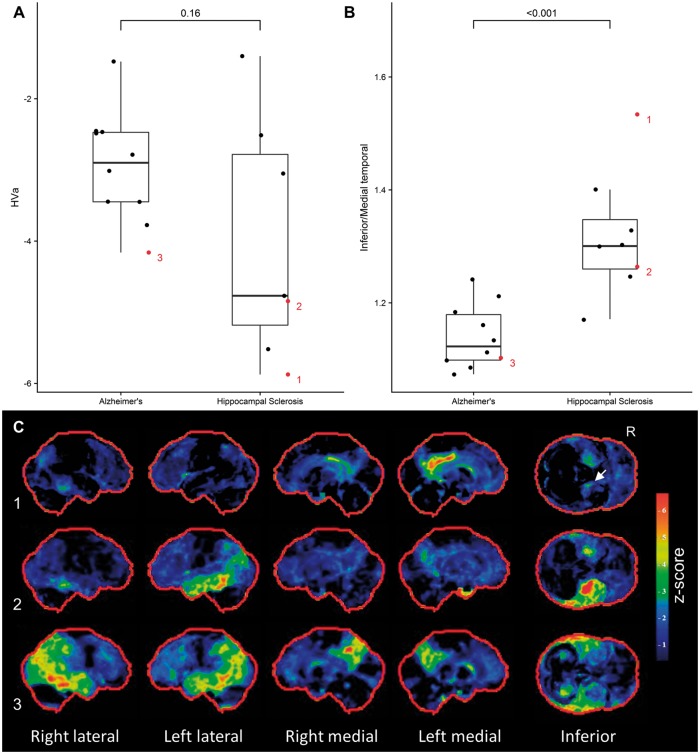
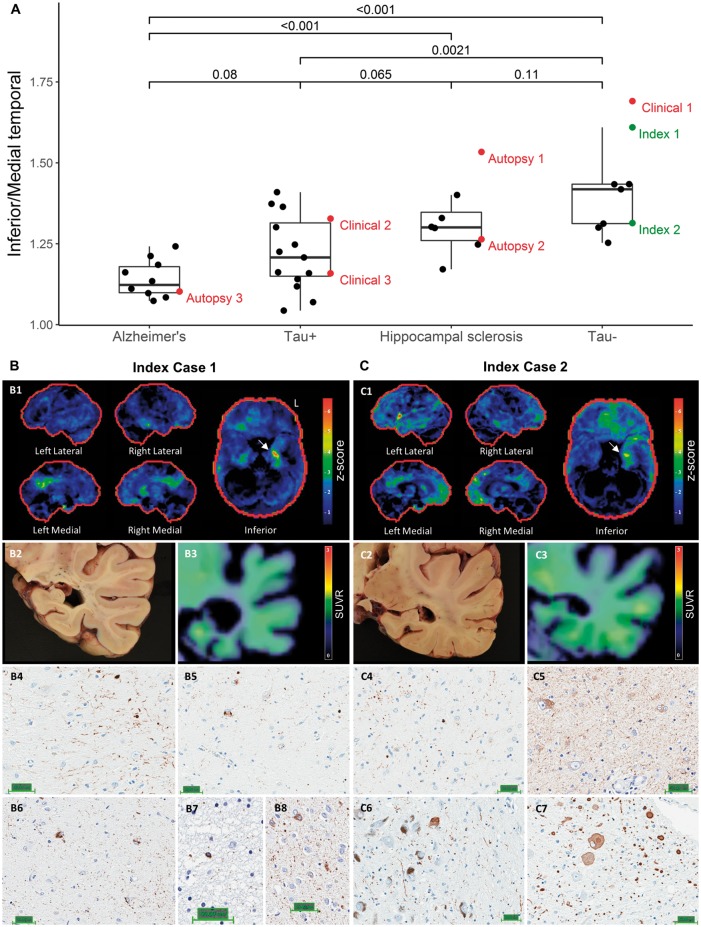
See Gordon (doi:10.1093/brain/awy052) for a scientific commentary on this article.Predicting underlying pathology based on clinical presentation has historically proven difficult, especially in older cohorts. Age-related hippocampal sclerosis may account for a significant proportion of elderly participants with amnestic dementia. Advances in molecular neuroimaging have allowed for detailed biomarker-based phenotyping, but in the absence of antemortem markers of hippocampal sclerosis, cases of mixed pathology remain problematic. We evaluated the utility of 18F-FDG-PET to differentiate flortaucipir tau PET negative from flortaucipir positive amnestic mild cognitive impairment and dementia and used an autopsy confirmed cohort to test the hypothesis that hippocampal sclerosis might account for the observed pattern. We identified impaired participants (Clinical Dementia Rating > 0) with amnestic presentations ≥ 75 years who had MRI and PET imaging with 18F-FDG (glucose metabolism), Pittsburgh compound B (amyloid) and flortaucipir (tau) performed within a year of cognitive assessment. These were stratified into amyloid positive/negative and tau positive/negative according to the A/T/N classification scheme. Our sample included 15 amyloid and tau-positive participants, and nine tau-negative participants (five of whom were amyloid-positive). For the autopsy cohort, sequential cases with antemortem 18F-FDG-PET were screened and those with TDP-43-negative Alzheimer's disease (10 cases) and TDP-43-positive hippocampal sclerosis (eight cases) were included. We compared each group to controls and to each other in a voxel-based analysis, and supplemented this with a region of interest-based analysis comparing medial to inferior temporal metabolism. Tau-positive and negative cases did not differ on neuropsychological testing or structural magnetic resonance biomarkers. Tau-negative cases had focal medial temporal and posterior cingulate/retrosplenial hypometabolism regardless of amyloid status, whereas tau-positive cases had additional lateral parietal and inferior temporal involvement. The inferior/medial temporal metabolism ratio was significantly different between the groups with the tau-negative group having a higher ratio. In the autopsy series, hippocampal sclerosis cases had greater medial temporal hypometabolism than Alzheimer's disease cases, who had more parietal and lateral/inferior temporal hypometabolism. Again, the ratio between temporal regions of interest differed significantly between groups. Two of the tau-negative patients, both of whom had an elevated inferior/medial temporal ratio, came to autopsy during the study and were found to have hippocampal sclerosis. Our finding that tau-negative amnestic mild cognitive impairment and dementia is associated with focal medial temporal and posterior cingulate hypometabolism extends prior reports in amyloid-negative cases. The inferior/medial temporal metabolism ratio can help identify tau-negative cases of amnestic dementia and may serve as a biomarker for hippocampal sclerosis.


Figures

Figure 1
Figure 1
3D brain renderings showing results of FDG-PET analysis in tau-negative patients. Results are shown at P(unc) = 0.001 with the height cut-off for family-wise error (FWE) correction shown in the colour bar. (A) Compared to controls, tau-negative amyloid-negative participants had hypometabolism in the posterior and middle cingulate and the medial temporal lobes. (B) Compared to controls, tau-negative amyloid-positive participants also had hypometabolism in the posterior and middle cingulate and the medial temporal lobes. (C) Conjunction analysis of A and B revealing areas involved in both amyloid-positive and amyloid-negative cases compared to controls. Renders created using Brain Net Viewer (Xia et al., 2013) (https://www.nitrc.org/projects/bnv/).
Figure 2
Figure 2
Three-dimensional brain renderings showing results of FDG-PET analysis in tau-negative and tau-positive participants. Compared to controls, tau-positive participants also had hypometabolism in the posterior and middle cingulate and the precuneus, but there was more widespread cortical involvement including inferior and middle temporal gyri and the angular gyri bilaterally. In addition, medial temporal lobe involvement was less pronounced. Results are shown at P(unc) = 0.001 with the height cut-off for FWE correction shown in the colour bar. (B) Compared to controls, tau-negative participants had hypometabolism in the posterior and middle cingulate, the inferior precuneus and the medial temporal lobe. Results are shown at P(unc) = 0.001 with the height cut-off for family-wise error (FWE) correction shown in the colour bar. (C) T-map for tau-negative compared to tau-positive participants, with red-yellow indicating regions more involved in tau-negative participants and blue-cyan showing areas more involved in tau-positive participants. Although very few voxels are above the height cut-off for P(unc) = 0.001, the medial temporal lobe appears to be more involved in tau-negative cases while the inferior temporal gyri appear more involved in tau-positive cases. (D) Effect size (Cohen’s d) maps for the direct comparison showing areas of greater involvement in tau-positive cases, including moderate (0.5–0.8) to large (>0.8) effect sizes in the inferior temporal gyri. (E) Effect size (Cohen’s d) maps for the direct comparison showing areas of greater involvement in tau-negative cases, revealing moderate (0.5–0.8) to large (>0.8) effect sizes for the medial temporal lobe. Renders created using Brain Net Viewer (Xia et al., 2013) (https://www.nitrc.org/projects/bnv/).
Figure 3
Figure 3
3D brain renderings showing results of FDG-PET analysis in hippocampal sclerosis and Alzheimer’s disease participants. (A) Compared to controls, TDP-43 negative Alzheimer’s disease was associated with hypometabolism of the posterior cingulate, middle and inferior temporal and lateral and medial parietal regions including the precuneus. There was minimal medial temporal involvement. Results are shown at P(unc) = 0.001 with the height cut-off for FWE correction shown in the colour bar. (B) Compared to controls, TDP-43-positive hippocampal sclerosis was associated with hypometabolism predominantly in the medial temporal lobe, with additional involvement of the middle and inferior temporal, lateral parietal and insular regions. Results are shown at P(unc) = 0.001 with the height cut-off for family-wise error (FWE) correction shown in the colour bar. Note that most hippocampal sclerosis cases had concomitant Alzheimer’s disease. (C) T-map for hippocampal sclerosis compared to Alzheimer’s disease, with red-yellow indicating regions more involved in hippocampal sclerosis and blue-cyan showing areas more involved in Alzheimer’s disease. There was more medial temporal and orbitofrontal involvement in hippocampal sclerosis, and more posterior-inferior temporal, occipital and parietal involvement in Alzheimer’s disease. (D) Effect size (Cohen’s d) map for the direct comparison showing areas of greater involvement in Alzheimer’s disease, including moderate (0.5–0.8) to large (>0.8) effect sizes for the posterior-inferior temporal, occipital and parietal regions. (E) Effect size (Cohen’s d) map for the direct comparison showing areas of greater involvement in hippocampal sclerosis, including moderate (0.5–0.8) to large (>0.8) effect sizes for the medial temporal and orbitofrontal regions. Renders created using Brain Net Viewer (Xia et al., 2013) (https://www.nitrc.org/projects/bnv/).
Figure 4
Figure 4
Quantitative imaging findings and examples of participant level FDG-PET scans for the clinical cohort. (A) Both tau-positive and tau-negative participants had reduced adjusted hippocampal volumes (HVa) compared to controls, but were not significantly different from one another. (B) The ratio of inferior temporal metabolism over medial temporal metabolism was significantly higher in tau-negative participants compared to controls and tau-positive participants. (C) Examples of participant level FDG-PET statistical stereotactic surface projection maps generated by Cortex ID (GE Healthcare) for three participants. Numbers 1–3 refer to the labels in B. Note the disproportionate medial temporal hypometabolism in 1 (A+/T−), the relative sparing of medial temporal structures in 3 (A+/T+) and the overlapping pattern in 2 (A+/T+), with a corresponding intermediate inferior/medial temporal ratio. CN = cognitively normal.
Figure 5
Figure 5
Quantitative imaging findings and examples of participant level PET scans for the autopsy cohort. (A) There was a trend towards smaller hippocampal volume in hippocampus sclerosis, although this did not reach statistical significance. (B) The ratio of inferior temporal metabolism over medial temporal metabolism was significantly higher in hippocampal sclerosis cases compared Alzheimer’s disease. (C) Examples of participant level FDG-PET statistical stereotactic surface projection maps generated by Cortex ID (GE Healthcare) for three participants. Numbers 1–3 refer to the labels in B. Note the focal medial temporal and posterior cingulate hypometabolism in 1 (hippocampal sclerosis with Alzheimer’s disease, A5B5C2, PET completed 4 years before death), the relative sparing of medial temporal structures in 3 (Alzheimer’s disease without hippocampal sclerosis, A4B6C2, PET completed 4 years before death) and the overlapping pattern in 2 (hippocampal sclerosis with Alzheimer’s disease, A3B5C2, PET completed 4 years before death).
Figure 6
Figure 6
Imaging and neuropathology findings in the two index tau-negative cases that came to autopsy during the study. (A) The ratio of inferior/medial temporal metabolism is shown for both the clinical and autopsy cohorts, with the same three cases highlighted as in Fig. 4 (Clinical 1–3) and Fig. 5 (Autopsy 1–3) in red. The two index cases are highlighted in green. (B) Participant level results for index Case 1. The participant’s FDG-PET (Cortex ID) is shown in B1, illustrating medial temporal and posterior cingulate hypometabolism with sparing of inferior temporal and lateral parietal regions. A gross pathological image at the level at which the hippocampal biopsies were taken is shown in B2, and flortaucipir PET at the same level is shown in B3. Results of immunohistochemical staining of hippocampal sections for TDP-43 are shown in B4–5 (Scale bar = 50 μm), which revealed dystrophic neurites (B4) and neuronal cytoplasmic inclusions (B5). Results of tau immunostaining are presented in B6–8 (Scale bar = 50 μm), showing pretangles in the subiculum (B6), a coiled body in the temporal lobe (B7) as well as pretangles and grains in the amygdala (B8). (C) Participant level results for index Case 2. As can be seen in C1, this participant had predominantly left medial temporal and orbitofrontal hypometabolism on FDG-PET (Cortex ID). There was more involvement of the inferior temporal and lateral parietal regions than in index Case 1. A gross pathological image at the level at which the hippocampal biopsies were taken is shown in C2, and flortaucipir PET at the same level is shown in C3. Although this participant was also below the flortaucipir cut-off point, there appeared to be a greater degree of low-level binding than in index Case 1. Immunohistochemical staining for TDP-43 showing dystrophic neurites presented in C4 (Scale bar = 50 μm). A tau immunostain showing pretangles is presented in C5 (Scale bar = 50 μm). Alpha-synuclein immunohistochemistry results are presented in C6–7 (Scale bar = 50 μm), demonstrating Lewy bodies in the midbrain (C6) and medulla (C7).

Comment in

References

    1. Albert MS, DeKosky ST, Dickson D, Dubois B, Feldman HH, Fox NC, et al.The diagnosis of mild cognitive impairment due to Alzheimer's disease: recommendations from the National Institute on Aging-Alzheimer's Association workgroups on diagnostic guidelines for Alzheimer's disease. Alzheimers Dement 2011; 7: 270–9. - PMC - PubMed
    1. Barret O, Alagille D, Sanabria S, Comley RA, Weimer RM, Borroni E, et al.Kinetic modeling of the Tau PET tracer (18)F-AV-1451 in human healthy volunteers and Alzheimer disease subjects. J Nucl Med 2017; 58: 1124–31. - PubMed
    1. Chetelat G, Ossenkoppele R, Villemagne VL, Perrotin A, Landeau B, Mezenge F, et al.Atrophy, hypometabolism and clinical trajectories in patients with amyloid-negative Alzheimer's disease. Brain 2016; 139: 2528–39. - PMC - PubMed
    1. Cykowski MD, Powell SZ, Schulz PE, Takei H, Rivera AL, Jackson RE, et al.Hippocampal sclerosis in older patients practical examples and guidance with a focus on cerebral age-related TDP-43 with sclerosis. Arch Pathol Lab Med 2017; 141: 1113–26. - PMC - PubMed
    1. Dawe RJ, Bennett DA, Schneider JA, Arfanakis K. Neuropathologic correlates of hippocampal atrophy in the elderly: a clinical, pathologic, postmortem MRI study. PLoS One 2011; 6: e26286. - PMC - PubMed

Publication types

MeSH terms