Comparative Study
. 2018 Mar 13;114(5):1009-1017.
doi: 10.1016/j.bpj.2018.01.020.

DROIDS 1.20: A GUI-Based Pipeline for GPU-Accelerated Comparative Protein Dynamics

Affiliations
Comparative Study

DROIDS 1.20: A GUI-Based Pipeline for GPU-Accelerated Comparative Protein Dynamics

Gregory A Babbitt et al. Biophys J. .

Abstract

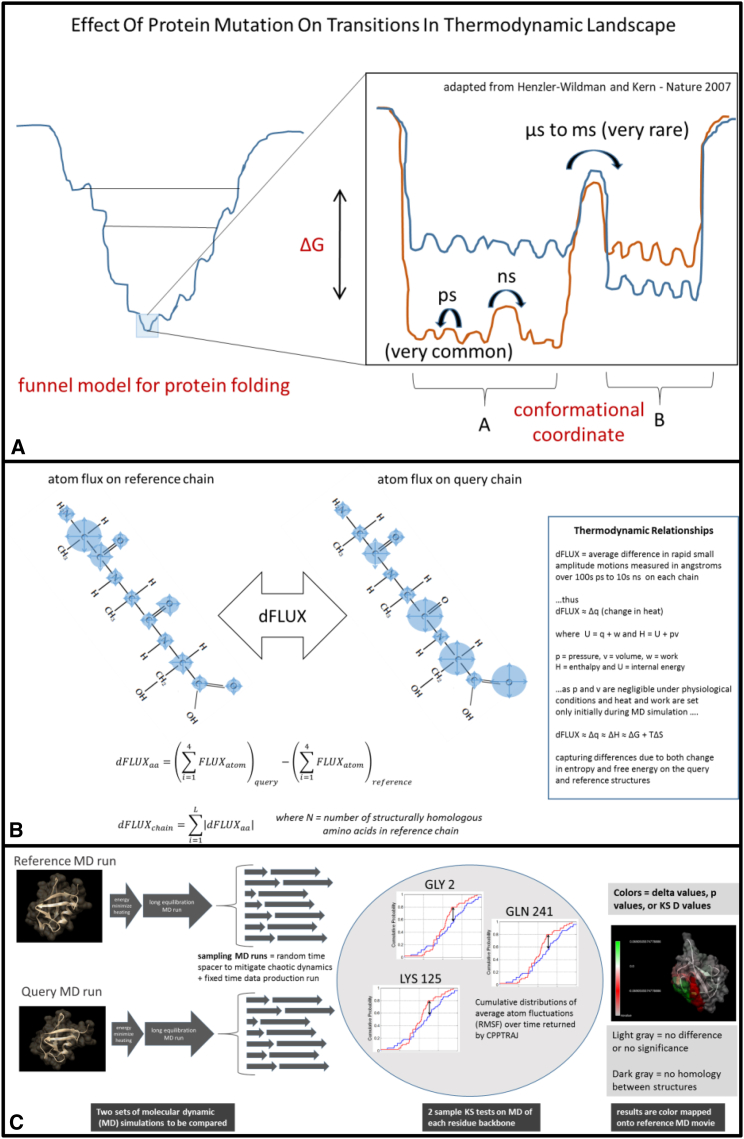
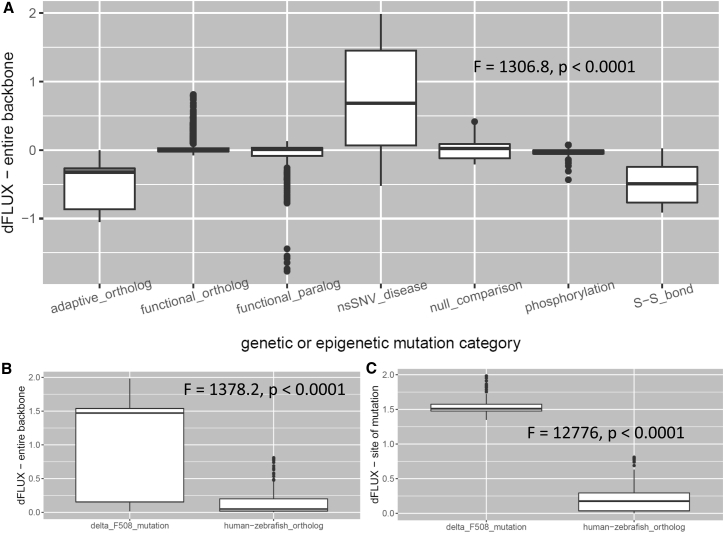
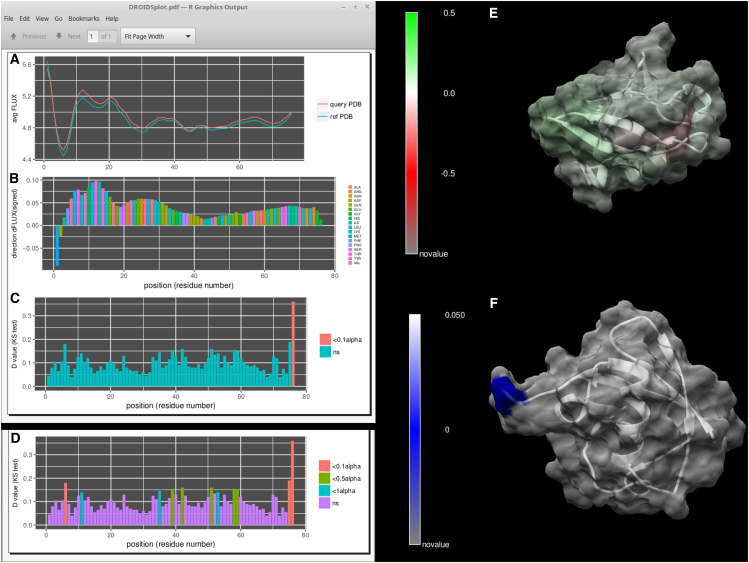
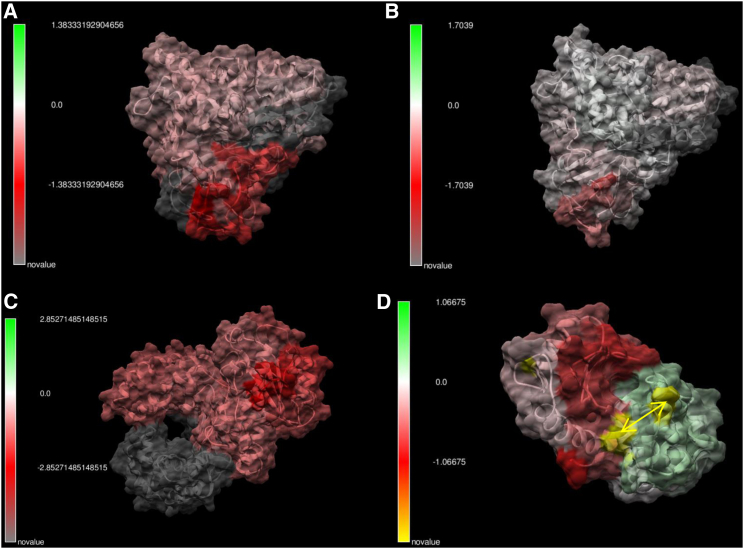
Traditional informatics in comparative genomics work only with static representations of biomolecules (i.e., sequence and structure), thereby ignoring the molecular dynamics (MD) of proteins that define function in the cell. A comparative approach applied to MD would connect this very short timescale process, defined in femtoseconds, to one of the longest in the universe: molecular evolution measured in millions of years. Here, we leverage advances in graphics-processing-unit-accelerated MD simulation software to develop a comparative method of MD analysis and visualization that can be applied to any two homologous Protein Data Bank structures. Our open-source pipeline, DROIDS (Detecting Relative Outlier Impacts in Dynamic Simulations), works in conjunction with existing molecular modeling software to convert any Linux gaming personal computer into a "comparative computational microscope" for observing the biophysical effects of mutations and other chemical changes in proteins. DROIDS implements structural alignment and Benjamini-Hochberg-corrected Kolmogorov-Smirnov statistics to compare nanosecond-scale atom bond fluctuations on the protein backbone, color mapping the significant differences identified in protein MD with single-amino-acid resolution. DROIDS is simple to use, incorporating graphical user interface control for Amber16 MD simulations, cpptraj analysis, and the final statistical and visual representations in R graphics and UCSF Chimera. We demonstrate that DROIDS can be utilized to visually investigate molecular evolution and disease-related functional changes in MD due to genetic mutation and epigenetic modification. DROIDS can also be used to potentially investigate binding interactions of pharmaceuticals, toxins, or other biomolecules in a functional evolutionary context as well.


Figures

Figure 1
Figure 1
(A) A hypothetical representation of the effect of protein mutation on the thermodynamic landscape of a protein (adapted from (8)). In the inset image, the mutation destabilizes the original thermodynamic landscape, shown in orange, to the state shown in blue. Under functional conservation of the protein function, many mutations will likely have little effect on the free-energy landscape, whereas only a very few may have more devastating impacts, as shown here. (B) dFLUX can be visualized here as the hypothetical differences in atom fluctuation (blue circles) on two homologous protein chains. In the DROIDS color mapping, dFLUX is averaged over the four backbone atoms of each amino acid. Global dFLUX for the whole chain is simply the sum of absolute dFLUX over the length of the polypeptide chain. (C) A schematic representation of DROIDS comparative molecular dynamic analysis software is shown. DROIDS 1.2 is a software tool for multiple-test-corrected pairwise comparison of molecular dynamics of two comparable PDB structures at the amino acid level. The three main phases of analysis include MD sampling runs and vector trajectory analysis, statistical comparison via multiple-test-corrected KS tests, and visualization results on static and moving images. RMSF, root mean-square fluctuation.
Figure 2
Figure 2
(A) Comparison of global dFLUX distribution (entire protein) across different mutation and epimutation categories in all DROIDS analyses listed in Table 1. (B) Here, a comparison is shown of global dFLUX distribution in the nucleotide-binding domain of CFTR caused by changes at the site of cystic fibrosis mutation (ΔF508) and orthologous changes in CFTR that have occurred since the divergence of vertebrates (human-zebrafish). (C) Local dFLUX only at sites of mutations is also shown for contrast.
Figure 3
Figure 3
A null comparison of molecular dynamics on a small protein (PDB: 1ubq – 1ubq). (A) The profiles in average FLUX as a function of position are nearly identical. (B) The differences (i.e., dFLUX) that are colored as a function of amino acid type are (C) almost entirely nonsignificant except at the terminal end of the protein. (D) Results without correction for false discovery rate are also shown for comparison. (E) dFLUX and (F) p-values of the KS tests are shown color mapped to PDB: 1ubq. ns, not significant.
Figure 4
Figure 4
Comparison of protein dynamics of several thermostable and wild-type enzymes. (A) Sulfolobus p450 cytochrome is compared to Pseudomonas (PDB: 1t2b and 1phd), and (B) Citrobacter p450 cytochrome is compared to Pseudomonas (PDB: 1f4t – 1phd). (C) Taq DNA polymerase and an E. coli Klenow fragment are shown here, and (D) the effect of a bioengineered disulfide bond in lysozyme is shown here. The differences in atom fluctuation (i.e., dFLUX) are color scaled: green indicates amplified motion, and red indicates dampened motion. (A)–(C) exhibit strongest thermostability (i.e., darkest red) near the terminal ends of the protein, especially when these regions lack secondary structure and are near the protein surface. For more details about (A) and (B), see (22).
Figure 5
Figure 5
Comparison of evolutionary effects on protein dynamics. (A) The change in atom fluctuation (dFLUX) due to gene duplication in serine proteases (compares trypsin PDB: 2ptn to pancreatic elastase PDB: 3est) is shown. (B) Shown are the p-values of the KS tests, with blue indicating significant change. (C) Shown is the R graphical output revealing the average FLUX (top), dFLUX (middle), and KS statistics (bottom) as a function of amino acid position. (D)–(F) show the same results for destabilization of a B-RAF kinase by two cancer mutations (yellow).

References

    1. Wilke C.O. Bringing molecules back into molecular evolution. PLOS Comput. Biol. 2012;8:e1002572. - PMC - PubMed
    1. Danchin E., Pocheville A. Inheritance is where physiology meets evolution. J. Physiol. 2014;592:2307–2317. - PMC - PubMed
    1. Babbitt G.A., Coppola E.E., Hudson A.O. Can all heritable biology really be reduced to a single dimension? Gene. 2016;578:162–168. - PubMed
    1. Götz A.W., Williamson M.J., Walker R.C. Routine microsecond molecular dynamics simulations with AMBER on GPUs. 1. Generalized Born. J. Chem. Theory Comput. 2012;8:1542–1555. - PMC - PubMed
    1. Salomon-Ferrer R., Götz A.W., Walker R.C. Routine microsecond molecular dynamics simulations with AMBER on GPUs. 2. Explicit solvent particle mesh Ewald. J. Chem. Theory Comput. 2013;9:3878–3888. - PubMed

Publication types