

Five Alternative Myosin Converter Domains Influence Muscle Power, Stretch Activation, and Kinetics
- PMID: 29539400
- PMCID: PMC5883554
- DOI: 10.1016/j.bpj.2017.12.045
Five Alternative Myosin Converter Domains Influence Muscle Power, Stretch Activation, and Kinetics
Abstract
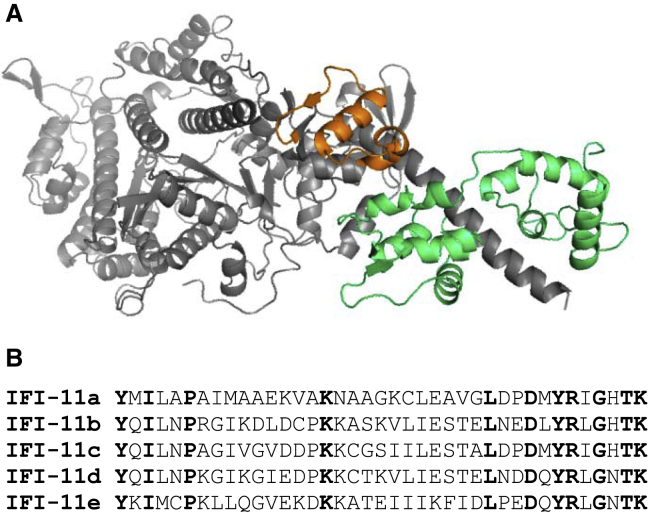
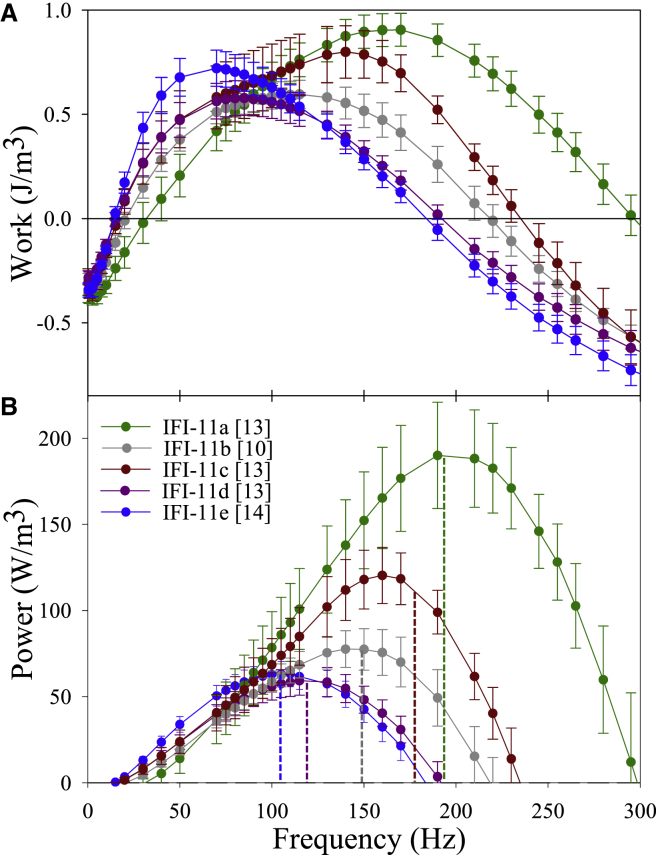
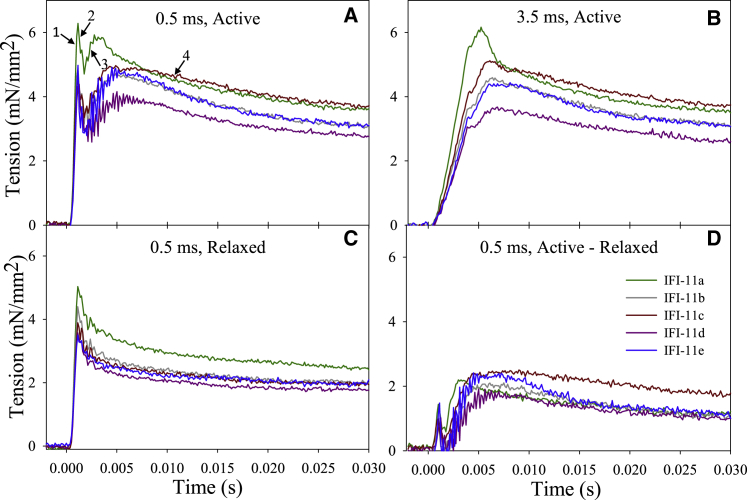
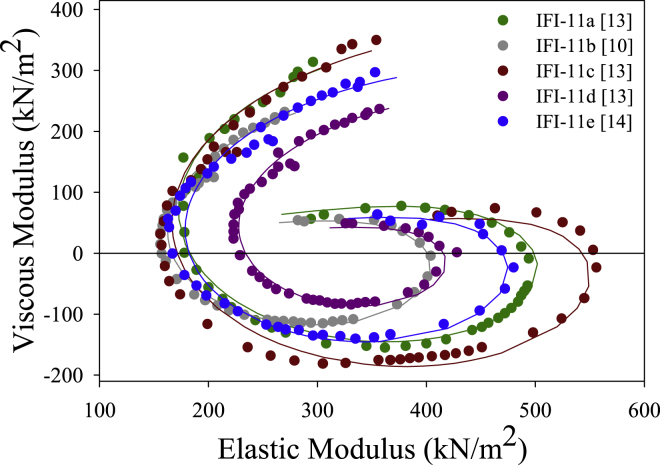
Muscles have evolved to power a wide variety of movements. A protein component critical to varying power generation is the myosin isoform present in the muscle. However, how functional variation in muscle arises from myosin structure is not well understood. We studied the influence of the converter, a myosin structural region at the junction of the lever arm and catalytic domain, using Drosophila because its single myosin heavy chain gene expresses five alternative converter versions (11a-e). We created five transgenic fly lines, each forced to express one of the converter versions in their indirect flight muscle (IFM) fibers. Electron microscopy showed that the converter exchanges did not alter muscle ultrastructure. The four lines expressing converter versions (11b-e) other than the native IFM 11a converter displayed decreased flight ability. IFM fibers expressing converters normally found in the adult stage muscles generated up to 2.8-fold more power and displayed up to 2.2-fold faster muscle kinetics than fibers with converters found in the embryonic and larval stage muscles. Small changes to stretch-activated force generation only played a minor role in altering power output of IFM. Muscle apparent rate constants, derived from sinusoidal analysis of the chimeric converter fibers, showed a strong positive correlation between optimal muscle oscillation frequency and myosin attachment kinetics to actin, and an inverse correlation with detachment related cross-bridge kinetics. This suggests the myosin converter alters at least two rate constants of the cross-bridge cycle with changes to attachment and power stroke related kinetics having the most influence on setting muscle oscillatory power kinetics.
Copyright © 2018 Biophysical Society. Published by Elsevier Inc. All rights reserved.
Figures
Similar articles
-
The load dependence of muscle's force-velocity curve is modulated by alternative myosin converter domains.Am J Physiol Cell Physiol. 2019 Jun 1;316(6):C844-C861. doi: 10.1152/ajpcell.00494.2018. Epub 2019 Mar 13. Am J Physiol Cell Physiol. 2019. PMID: 30865518 Free PMC article.
-
An embryonic myosin converter domain influences Drosophila indirect flight muscle stretch activation, power generation and flight.J Exp Biol. 2014 Jan 15;217(Pt 2):290-8. doi: 10.1242/jeb.091769. Epub 2013 Oct 10. J Exp Biol. 2014. PMID: 24115062 Free PMC article.
-
The influence of myosin converter and relay domains on cross-bridge kinetics of Drosophila indirect flight muscle.Biophys J. 2010 Sep 8;99(5):1546-55. doi: 10.1016/j.bpj.2010.06.047. Biophys J. 2010. PMID: 20816067 Free PMC article.
-
Muscle mechanics: adaptations with exercise-training.Exerc Sport Sci Rev. 1996;24:427-73. Exerc Sport Sci Rev. 1996. PMID: 8744258 Review.
-
Special Issue: The Actin-Myosin Interaction in Muscle: Background and Overview.Int J Mol Sci. 2019 Nov 14;20(22):5715. doi: 10.3390/ijms20225715. Int J Mol Sci. 2019. PMID: 31739584 Free PMC article. Review.
Cited by
-
X-ray Crystallographic and Molecular Dynamic Analyses of Drosophila melanogaster Embryonic Muscle Myosin Define Domains Responsible for Isoform-Specific Properties.J Mol Biol. 2020 Jan 17;432(2):427-447. doi: 10.1016/j.jmb.2019.11.013. Epub 2019 Nov 29. J Mol Biol. 2020. PMID: 31786266 Free PMC article.
-
The load dependence of muscle's force-velocity curve is modulated by alternative myosin converter domains.Am J Physiol Cell Physiol. 2019 Jun 1;316(6):C844-C861. doi: 10.1152/ajpcell.00494.2018. Epub 2019 Mar 13. Am J Physiol Cell Physiol. 2019. PMID: 30865518 Free PMC article.
-
Shortening deactivation: quantifying a critical component of cyclical muscle contraction.Am J Physiol Cell Physiol. 2022 Apr 1;322(4):C653-C665. doi: 10.1152/ajpcell.00281.2021. Epub 2021 Dec 29. Am J Physiol Cell Physiol. 2022. PMID: 34965153 Free PMC article.
-
Weighted Single-Step Genome-Wide Association Study for Growth Traits in Chinese Simmental Beef Cattle.Genes (Basel). 2020 Feb 11;11(2):189. doi: 10.3390/genes11020189. Genes (Basel). 2020. PMID: 32053968 Free PMC article.
-
A Drosophila cardiac myosin increases jump muscle stretch activation and shortening deactivation.Biophys J. 2025 Feb 18;124(4):651-666. doi: 10.1016/j.bpj.2025.01.001. Epub 2025 Jan 10. Biophys J. 2025. PMID: 39799399
References
-
- Sweeney H.L., Rosenfeld S.S., Sellers J.R. Kinetic tuning of myosin via a flexible loop adjacent to the nucleotide binding pocket. J. Biol. Chem. 1998;273:6262–6270. - PubMed
-
- Murphy C.T., Spudich J.A. Variable surface loops and myosin activity: accessories to a motor. J. Muscle Res. Cell Motil. 2000;21:139–151. - PubMed
-
- Uyeda T.Q., Ruppel K.M., Spudich J.A. Enzymatic activities correlate with chimaeric substitutions at the actin-binding face of myosin. Nature. 1994;368:567–569. - PubMed
Publication types
MeSH terms
Substances
Grants and funding
LinkOut - more resources
Full Text Sources
Other Literature Sources
Molecular Biology Databases
