. 2018 Mar 13;22(11):2951-2963.
doi: 10.1016/j.celrep.2018.02.075.

A Specific PfEMP1 Is Expressed in P. falciparum Sporozoites and Plays a Role in Hepatocyte Infection

Affiliations

A Specific PfEMP1 Is Expressed in P. falciparum Sporozoites and Plays a Role in Hepatocyte Infection

Gigliola Zanghì et al. Cell Rep. .

Abstract

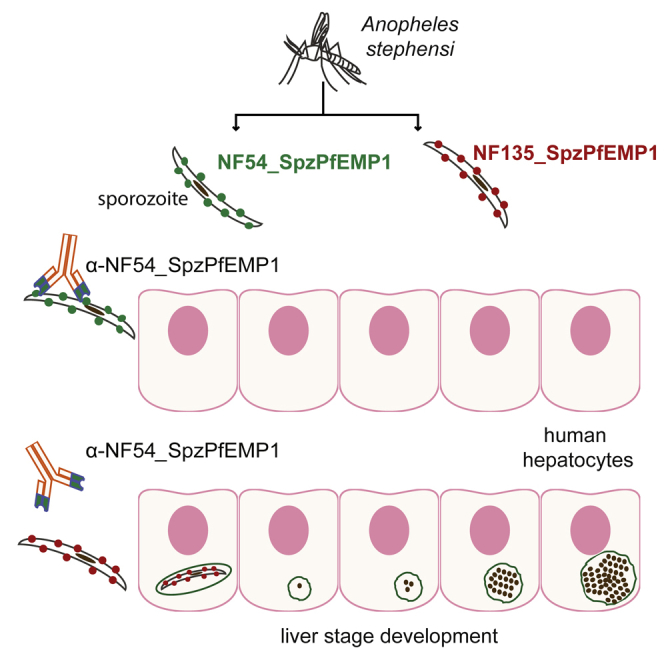
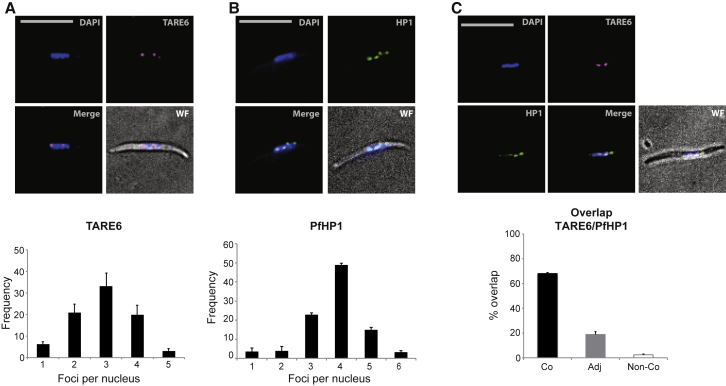
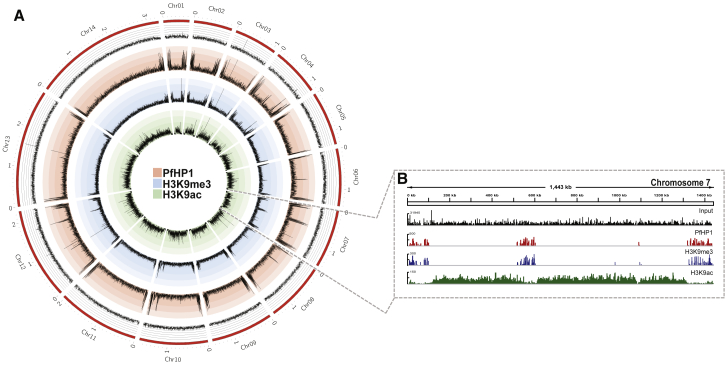
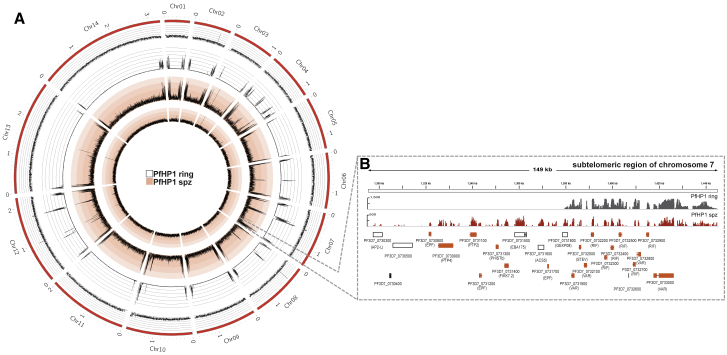
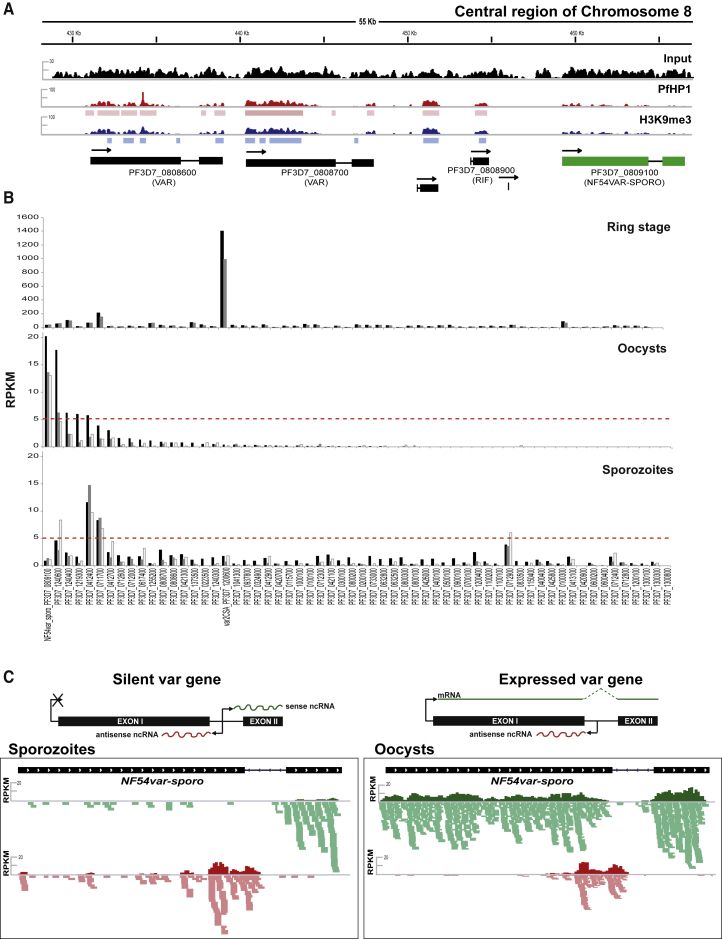
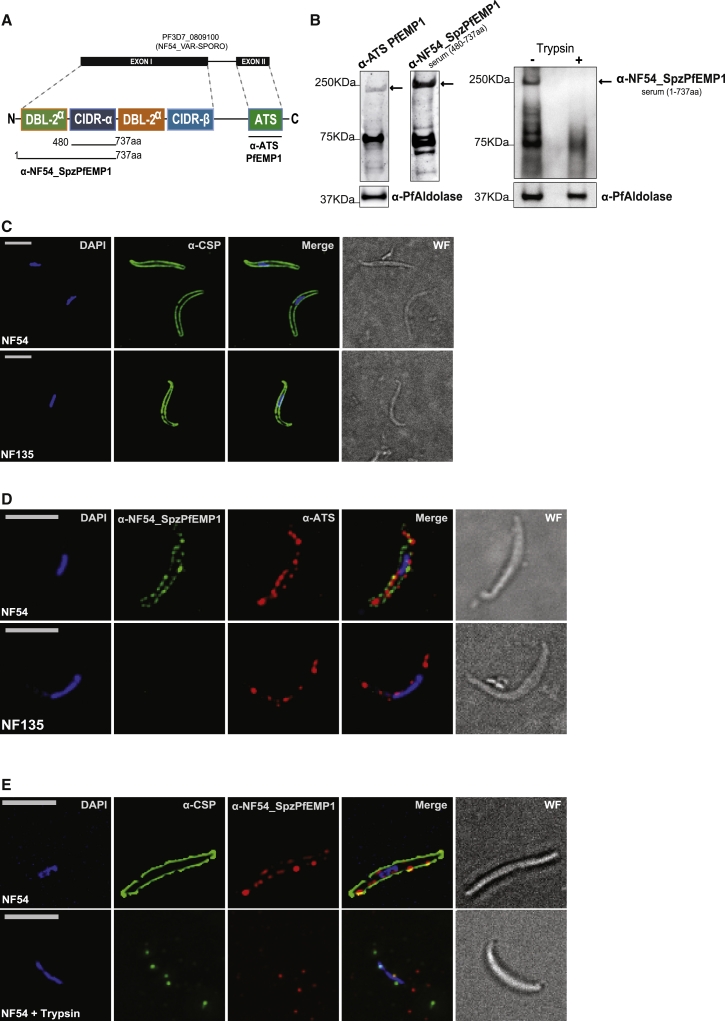
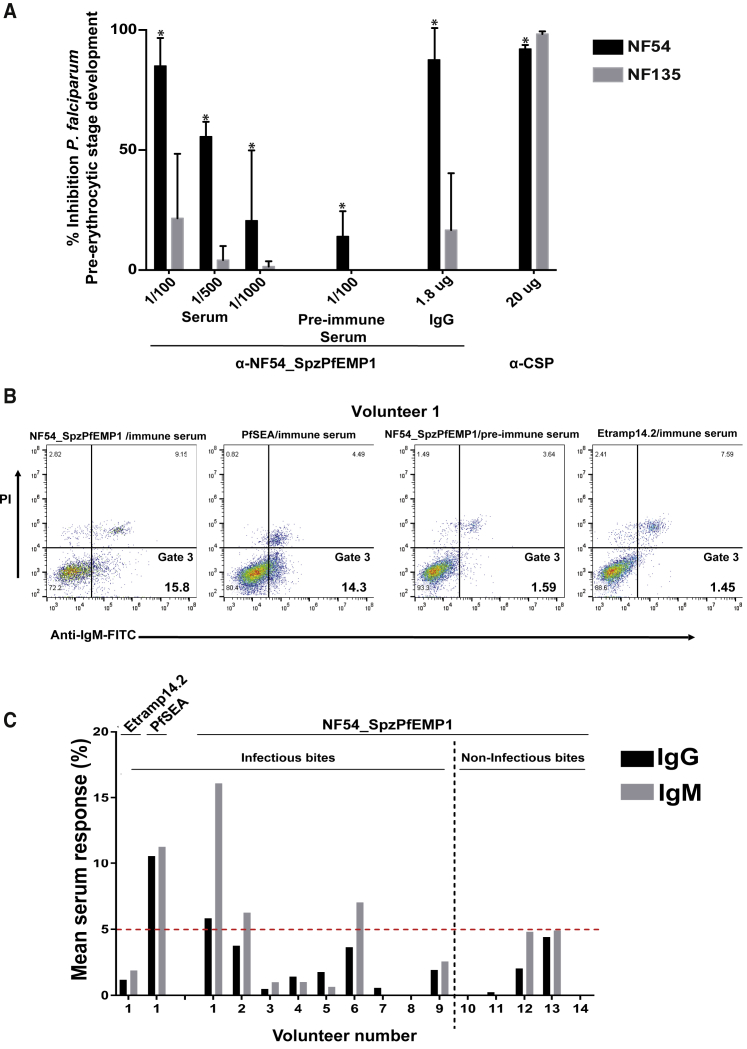
Heterochromatin plays a central role in the process of immune evasion, pathogenesis, and transmission of the malaria parasite Plasmodium falciparum during blood stage infection. Here, we use ChIP sequencing to demonstrate that sporozoites from mosquito salivary glands expand heterochromatin at subtelomeric regions to silence blood-stage-specific genes. Our data also revealed that heterochromatin enrichment is predictive of the transcription status of clonally variant genes members that mediate cytoadhesion in blood stage parasites. A specific member (here called NF54varsporo) of the var gene family remains euchromatic, and the resultant PfEMP1 (NF54_SpzPfEMP1) is expressed at the sporozoite surface. NF54_SpzPfEMP1-specific antibodies efficiently block hepatocyte infection in a strain-specific manner. Furthermore, human volunteers immunized with infective sporozoites developed antibodies against NF54_SpzPfEMP1. Overall, we show that the epigenetic signature of var genes is reset in mosquito stages. Moreover, the identification of a strain-specific sporozoite PfEMP1 is highly relevant for vaccine design based on sporozoites.

Keywords: P. falciparum; PfEMP1; PfHP1; epigenetic; hepatocyte infection; heterochromatin; malaria; sporozoite; var genes.


Figures

None
Graphical abstract
Figure 1
Figure 1
Chromosome Ends and Heterochromatin Islands Cluster at the Nuclear Periphery in P. falciparum Sporozoites (A) DNA fluorescence in situ hybridization (FISH) of telomere distribution in sporozoites using a probe (magenta) against sub-telomeric repeat TARE6 (top) and corresponding quantification of the number of TARE6 foci per nucleus (bottom). (B) Immunofluorescence of PfHP1 (green) in sporozoites using anti-PfHP1 antibodies (top) and corresponding quantification of the number of PfHP1 foci per nucleus (bottom). For (A) and (B), error bars represent the 95% confidence intervals (±SEM) established for 50 sporozoites from three independent experiments. (C) Combined DNA FISH of telomere distribution (using a TARE6 probe in magenta) and immunofluorescence of PfHP1 distribution (green) using anti-PfHP1 antibodies in sporozoites (top) and corresponding quantification of the percent overlap of TARE6 and PfHP1 foci per nucleus (bottom). Co, colocalized; Adj, adjacent; Non-Co, non-colocalized. Error bars represent SD from two independent experiments. For (A)–(C), DNA was stained with DAPI (blue), and the wide-field (WF) image is merged with the fluorescent images. Scale bars, 5 μm.
Figure 2
Figure 2
Genome-wide Distribution of Eu- and Heterochromatin in P. falciparum Sporozoites (A) Circos plot of ChIP-seq data showing genome-wide enrichment of PfHP1 (red), H3K9me3 (blue), and H3K9ac (green) in sporozoites. Coverage plots are represented as average reads per million (RPM) over bins of 1,000 nt with a maximum y axis value of 400 for PfHP1, 500 for H3K9me3, and 400 for H3K9Ac. The 14 chromosomes are represented by the outer gray circle, with chromosome sizes given in megabases (Input, black). Statistical analysis of the biological replicates is presented in Table S1. MACS2-based peak calling analysis of PfHP1, H3K9me3, and H3K9ac enrichment in sporozoites is presented in Table S2. (B) PfHP1, H3K9me3, and H3K9Ac enrichment across chromosome 7 in sporozoites, with genomic position indicated at the top in kilobases. Coverage plots are represented as average RPM over bins of 1,000 nt, with the maximum value of y axis indicated. Data are representative of three or more independent experiments. See also Tables S1 and S2.
Figure 3
Figure 3
Heterochromatin Islands at Chromosome Ends Are Extended in P. falciparum Sporozoites Relative to Blood Stages (A) Circos plot of ChIP-seq data compares genome-wide PfHP1 enrichment in sporozoites (spz; red lines) and asexual blood stage parasites (ring; gray lines). Coverage plots are represented as average RPM over bins of 1,000 nt with a y-axis maximum value of 400 for PfHP1 in sporozoites and 1,500 for PfHP1 in blood stages. The 14 chromosomes are represented by the outer gray circle, with chromosome sizes given in megabases. Statistical analysis of the biological replicates is presented in Table S1. MACS2-based peak calling analysis of PfHP1, H3K9me3, and H3K9ac enrichment in sporozoites is presented in Table S2. (B) An enlarged view of a 149-kb sub-telomeric region of the right arm of chromosome 7 shows PfHP1 enrichment in the genomes of sporozoites (spz; red) and blood stage parasites (ring; black). Genes encoding exported proteins of iRBCs are highlighted in orange below the plot. Coverage plots are represented as average RPM over bins of 1 nt, with the maximum value indicated on the y axis. Data are representative of three or more independent experiments. See also Tables S1 and S2.
Figure 4
Figure 4
PfHP1 Occupancy Predicts Transcription of NF54varsporo in Sporozoites (A) ChIP sequencing data show enrichment of PfHP1 (red) and H3K9me3 (blue) over a 55-kb genomic region of chromosome 8 (chromosome coordinates are shown at top) in P. falciparum sporozoites. The coverage of the ChIP input DNA is indicated in black, and the MACS2-based peaks (Table S2) are indicated as rectangular boxes underneath the coverage plots. Coverage plots are represented as average RPM over bins of 1,000 nt with the maximum value indicated on the y axis. Data are representative of three or more independent experiments. The var gene PF3D7_0809100, or NF54varsporo, shows low H3K9me3/PfHP1 enrichment and is highlighted in green. (B) RNA-seq shows var gene transcription across different P. falciparum life-cycle stages: asexual-ring-stage parasites 12 hr post-invasion (two replicates at top), mosquito-derived oocysts (three replicates in the middle), and mosquito salivary gland sporozoites (three replicates at bottom). Transcripts corresponding to exon I of each var gene (shown on the x axis) are indicated as RPKM (reads per kilobase of exon per one million mapped reads), indicated on the y axis. var gene transcription was only considered when above the red dotted line. See Table S4 for more details. (C) Each var gene has two exons that flank a conserved intron. Shown in the top panel are schematics representing transcription of var mRNA and intronic ncRNAs from silent and active var genes. The bottom panel shows stranded RNA-seq data that demonstrate NF54varsporo gene transcription in sporozoites (left) and oocysts (right). Coverage plots of steady-state RNA levels are indicated as RPKM (reads per kilobase of exon per one million mapped reads), with the mapped raw reads for sense (green) and antisense (red) transcription shown below the corresponding coverage plot. See also Table S4.
Figure 5
Figure 5
NF54_SpzPfEMP1 Protein Is Strain Specific and Exported to the Sporozoite Surface (A) Schematic representation of the predicted domains of the PfEMP1 encoded by PF3D7_0809100 and the corresponding antibodies against the semi-conserved ATS region and the polymorphic domains of the NF54_SpzPfEMP1. (B) Western blot analysis of sporozoite extracts using anti-ATS or anti-NF54_SpzPfEMP1 antibodies. Anti-PfAldolase antibodies served as a positive control for protein extraction. Molecular weights are shown at the left of the blot, and PfEMP1 is indicated with an arrow. (C) Immunofluorescence analysis of fixed sporozoites of two different strains (NF54 at top and NF135 on bottom) using anti-CSP antibodies (green). (D) Immunofluorescence analysis of fixed and permeabilized sporozoites of two different strains (NF54 at top and NF135 on bottom) using anti-NF54_SpzPfEMP1 (green) and anti-ATS (red) antibodies. (E) Surface immunofluorescence of live sporozoites (top) and live sporozoites after trypsin treatment (bottom) using anti-CSP (green) and anti-NF54_SpzPfEMP1 (red) antibodies. For (C)–(E), DNA was stained with DAPI (blue), and the wide-field (WF) image is shown at the right. Scale bars, 5 μm.
Figure 6
Figure 6
Antibodies against NF54_SpzPfEMP1 Inhibit Sporozoite Infection of Primary Human Hepatocytes (A) NF54_SpzPfEMP1 antibody inhibition of hepatocyte infection of NF54 sporozoites expressing NF54_SpzPfEMP1 (black) and of NF135 sporozoites that did not express NF54_SpzPfEMP1 (gray). Data are presented as the percentage of inhibition over the untreated control after treatment with the following antibodies: anti-CSP, anti-NF54_SpzPfEMP1 immune serum, or the corresponding anti-NF54_SpzPfEMP1 pre-immune serum or purified IgG. Data represent the average of two independent biological experiments. p < 0.0205, as measured using a two-way ANOVA. Error bars indicate SD. (B and C) Detection of antibodies against NF54_SpzPfEMP1 in sera isolated from individuals immunized with infective bites and non-infective bites under chloroquine (CQ) prophylaxis. The sera were used to label HEK293 cells expressing NF54_SpzPfEMP1, schizont egress antigen (PfSEA; positive control), or Etramp14.2 (negative control), which were analyzed by flow cytometry. A second negative control used NF54_SpzPfEMP1 pre-immune sera to probe HEK293 cells expressing NF54_SpzPfEMP1. (B) An anti-IgM (immunoglobulin M)-FITC (fluorescein isothiocyanate) signal (x axis) indicates specific binding, and a propidium iodide (PI) signal (y axis) indicates dead cells. Gate 3 consists of cells positive for IgM staining for either NF54_SpzPfEMP1, PfSEA, or Etramp. (C) Quantification of the serum IgG (black) or IgM (gray) response from all individuals in the chloroquine sera set as measured by fluorescence-activated cell sorting (FACS). Individual volunteers are shown on the x axis, and the mean of three technical replicates of serum response is shown on the y axis. Serum response was considered significant when above the red dotted cutoff line, using the Mann-Whitney U test. Serum response was determined as the ratio of the population of cells with bound sera antibodies to the population of transfected cells (transfection efficiency). It is expressed as a percentage illustrated as follows: serum response = (cell population with bound sera antibodies/cell population that is transfected) × 100%.

Similar articles

Cited by

References

    1. Amit-Avraham I., Pozner G., Eshar S., Fastman Y., Kolevzon N., Yavin E., Dzikowski R. Antisense long noncoding RNAs regulate var gene activation in the malaria parasite Plasmodium falciparum. Proc. Natl. Acad. Sci. USA. 2015;112:E982–E991. - PMC - PubMed
    1. Avril M., Hathaway M.J., Srivastava A., Dechavanne S., Hommel M., Beeson J.G., Smith J.D., Gamain B. Antibodies to a full-length VAR2CSA immunogen are broadly strain-transcendent but do not cross-inhibit different placental-type parasite isolates. PLoS ONE. 2011;6:e16622. - PMC - PubMed
    1. Bachmann A., Petter M., Krumkamp R., Esen M., Held J., Scholz J.A., Li T., Sim B.K., Hoffman S.L., Kremsner P.G. Mosquito passage dramatically changes var gene expression in controlled human Plasmodium falciparum infections. PLoS Pathog. 2016;12:e1005538. - PMC - PubMed
    1. Bengtsson A., Joergensen L., Rask T.S., Olsen R.W., Andersen M.A., Turner L., Theander T.G., Hviid L., Higgins M.K., Craig A. A novel domain cassette identifies Plasmodium falciparum PfEMP1 proteins binding ICAM-1 and is a target of cross-reactive, adhesion-inhibitory antibodies. J. Immunol. 2013;190:240–249. - PMC - PubMed
    1. Brancucci N.M.B., Bertschi N.L., Zhu L., Niederwieser I., Chin W.H., Wampfler R., Freymond C., Rottmann M., Felger I., Bozdech Z., Voss T.S. Heterochromatin protein 1 secures survival and transmission of malaria parasites. Cell Host Microbe. 2014;16:165–176. - PubMed

Publication types

Substances