. 2018 Mar 22;555(7697):463-468.
doi: 10.1038/nature26002. Epub 2018 Mar 14.

Placentation defects are highly prevalent in embryonic lethal mouse mutants

Affiliations

Placentation defects are highly prevalent in embryonic lethal mouse mutants

Vicente Perez-Garcia et al. Nature. .

Abstract

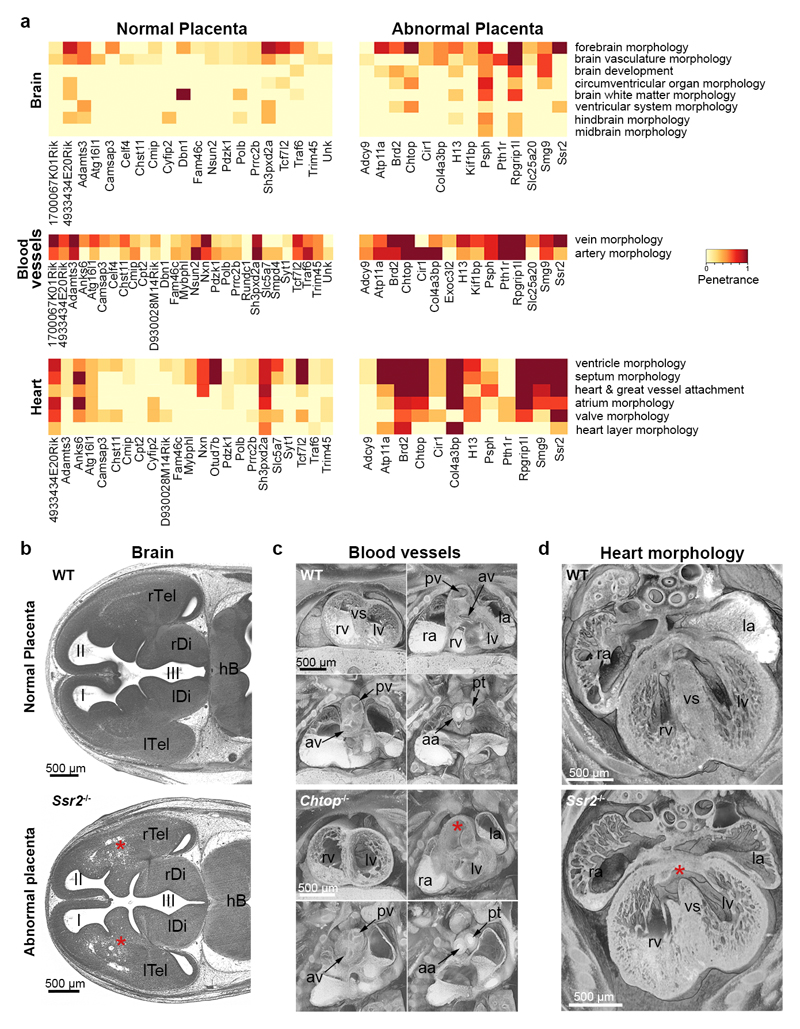
Large-scale phenotyping efforts have demonstrated that approximately 25-30% of mouse gene knockouts cause intrauterine lethality. Analysis of these mutants has largely focused on the embryo and not the placenta, despite the crucial role of this extraembryonic organ for developmental progression. Here we screened 103 embryonic lethal and sub-viable mouse knockout lines from the Deciphering the Mechanisms of Developmental Disorders program for placental phenotypes. We found that 68% of knockout lines that are lethal at or after mid-gestation exhibited placental dysmorphologies. Early lethality (embryonic days 9.5-14.5) is almost always associated with severe placental malformations. Placental defects correlate strongly with abnormal brain, heart and vascular development. Analysis of mutant trophoblast stem cells and conditional knockouts suggests that a considerable number of factors that cause embryonic lethality when ablated have primary gene function in trophoblast cells. Our data highlight the hugely under-appreciated importance of placental defects in contributing to abnormal embryo development and suggest key molecular nodes that govern placenta formation.


Conflict of interest statement

The authors declare no competing financial interests.

Figures

Extended Data Figure 1
Extended Data Figure 1. Potential trophoblast gene function in mutants with placental defect.
(a) Expression of trophoblast control genes and the 103 DMDD genes in trophoblast stem cells (TSCs), TSCs differentiated for 1 day (D) or 3D, and in E11.5 placentas. Log2-transformed expression values of RNA-seq data are displayed. Note that all genes associated with a placental phenotype in mutants (labelled in red font) are expressed in trophoblast. (b) Frequency of placental defects annotated in mid-gestational lethal mutants (MP: 0011098) as annotated in Mouse Genome Informatics, compared to the findings in DMDD where 40/41 E9.5-E14.5 lethals were found to exhibit placental abnormalities. (c) Left-hand side: Volume rendered 3D model of the surface of a wild-type (WT) embryo, staged as Theiler stage 23, and coronal section through the volume rendered model. Right-hand side: Equivalent images of a littermate E14.5 H13-/- embryo, staged as TS21. Note that the models are displayed in identical resolutions. Scale bar: 1mm. Images are representative of ≥5 embryos per genotype. (d) Network analysis using esyN (http://www.esyn.org) for all DMDD genes identified as causing a placental phenotype in mutants. BAP1 and ASXL3 are known interactors in humans. Red circles identify genes implicated in human trophoblast-based pathologies. The analysis reveals molecular nodes that appear to be of key importance for placental development.
Extended Data Figure 2
Extended Data Figure 2. Identification of placental defects by H&E histology.
(a) Schematic representation of key stages and cell types in extra-embryonic development, complementing Fig. 2c, d. All: allantois; Ch: chorion; Epi: epiblast; EPC: ectoplacental cone; ExE: extra-embryonic ectoderm; PE: primitive endoderm; SynT-I, -II: syncytiotrophoblast layers I and II; TE: trophectoderm; VE: visceral endoderm. (b) Examples of E9.5 placental phenotypes. Dotted lines: boundary to maternal decidua; vertical bars: chorion trophoblast thickness; arrows in WT placenta: invagination sites of extra-embryonic mesoderm-derived blood vessels into chorionic trophoblast; arrowheads in Psph-/-: sites of chorion folding but missing blood vessels; arrowheads in Dpm1-/-: overabundant and enlarged trophoblast giant cells. (c) Examples of E14.5 placental phenotypes. Red arrows: abnormal maternal blood accumulations. Arrows in Traf2-/- and Col4a3bp-/- (incl. inset) placentas: fibrotic and/or necrotic areas; arrowheads in Chtop-/- and Pth1r-/- placentas: abnormal spongiotrophoblast inclusions. Representative mutant embryo images are also depicted. Images of mutant placentas in (b) and (c) are representative of ≥3 independent mutants per line, see Methods.
Extended Data Figure 3
Extended Data Figure 3. Co-association analysis between embryo and placenta phenotypes.
(a) Mutant mouse lines were classified into those that exhibit a placental phenotype at E14.5 and those that do not. All embryos analysed by HREM imaging were tagged accordingly to either of these two groups. Enrichment of embryonic phenotype terms in mutant strains with normal or abnormal placentas is shown (dark red: fully penetrant phenotype). For brevity, the description as “abnormal” has been removed from ontology terms. (b) Significantly enriched embryonic phenotype terms in lines that exhibit an abnormal placenta (see also Supplementary Table 2) versus those with normal placenta. Following hypothesis testing using Fisher's exact test, adjusting for multiple testing using the Benjamini-Hochberg method, we estimated the magnitude of the abnormal placenta effect. This was determined by calculating independent binomial proportions for the two groups of embryos with normal (n=172) and abnormal (n=69) placenta. The percent difference between groups and the p-values are shown.
Extended Data Figure 4
Extended Data Figure 4. Specific embryonic defects are significantly correlated with the occurrence of an abnormal placenta.
(a) Further, detailed co-association statistics between the occurrence of a placental phenotype and specific abnormalities in the embryo proper in DMDD lines. As before, mutant mouse lines were classified into those that exhibit a placental phenotype at E14.5 and those that do not. All embryos analysed by HREM imaging were tagged accordingly to either of these two groups. Significant differences in the frequency of specific embryonic defects was determined between these two groups, and scored for the size of the effect and for its significance. Following hypothesis testing using Fisher's exact test, adjusting for multiple testing using the Benjamini-Hochberg method, we estimated the magnitude of the abnormal placenta effect. This was determined by calculating independent binomial proportions for the two groups of embryos with normal (n=172) and abnormal (n=69) placenta. The figure shows the differences in the estimated abnormality rates of the two embryo groups, and the extent of the bars represent the 95% Newcombe confidence interval (see Methods). “TRUE” means that these associations are significant, “FALSE” that they fall below the significance threshold. Please note that some terms, such as eye development and growth/size/body region are likely a consequence of developmental retardation. However, the highlighted terms such as heart, brain and vascular system morphology are definitely based on abnormalities that are not merely due to developmental delay. (b) Same analysis as in (a) but only including those specific embryos whose placenta was analysed histologically (as opposed to all embryos per strain; n=81 and n=41 embryos having normal and abnormal placenta, respectively). Please note that the important and meaningful terms hold up to significance irrespectively. (c) HREM image of an example of a massive subcutaneous edema (asterisk) covering the entire back of a Psph-/- embryo. Volume rendered 3D model. Axial section through the level of the heart is shown as inlay. Note also the delay in developmental progress. (d) Muscular ventricular septal defect (arrowhead) in an Atp11a-/- embryo. Coronal section through volume rendered 3D model. Axial HREM-image is shown as inlay. la: left atrial appendix; lv: left ventricle; pt: pulmonary trunk; ra: right atrial appendix; rv: right ventricle; vs: ventricular septum. Embryo defects shown in (c) and (d) are representative of ≥3 independent mutants.
Extended Data Figure 5
Extended Data Figure 5. Major routes of Trophoblast Stem Cell differentiation.
Diagram of the main differentiation routes of trophoblast stem cells (TSCs), including representative cell type-specific marker genes. EPC: ectoplacental cone; GlyT: glycogen cells; SpT: spongiotrophoblast; SynT: syncytiotrophoblast (layers I and II); TGC: trophoblast giant cells.
Extended Data Figure 6
Extended Data Figure 6. Selection of genes for in-depth analysis of trophoblast contribution to embryonic lethality.
(a) E9.5 phenotypes of mutant placentas of the three genes (Nubpl, Bap1, Crb2) chosen for ablation in TSCs, as well as for placental rescue analysis in vivo (Fig. 5, Extended Data Figs. 8-10). Black arrows (WT placenta): fetal blood vessels penetrating into the chorionic ectoderm. Vertical bars: unpatterned appearance of chorion. Orange arrows: empty or fibrotic maternal blood spaces. Images are representative of ≥3 mutants per line. (b) Details of CRISPR design and TSC clone screening strategy for the three selected genes Nubpl, Bap1 and Crb2. All targeted exons were first confirmed to be trophoblast-expressed. RT-qPCR (performed in technical triplicate per clone) and genomic genotyping PCR analysis (performed in duplicate per sample, with results independently confirmed by RT-qPCR data) were performed on individual, single-cell expanded TSC clones to confirm homozygous knockout (KO). Of note, even though splicing may occur across the deleted exon, all CRISPR-Cas9 deletions were designed to result in a premature stop codon. RT-qPCR data are mean +/- S.E.M. of n=3 technical replicates.
Extended Data Figure 7
Extended Data Figure 7. Analysis of mutant TSCs for defects in TSC maintenance and differentiation.
(a) Nubpl-/- TSC clones assessed for additional trophoblast marker genes by RT-qPCR. (b) Additional marker gene analysis on Bap1-mutant TSCs. (c) Analysis of Crb2-/- TSC clones for a phenotype in stem cell maintenance (“0d”) or during differentiation (“3d”, “6d”). No significant difference in cell morphology, growth behaviour and gene expression pattern was observed compared to wild-type (WT) vector control clones. Data are mean +/- S.E.M. *= p<0.05; **= p<0.01 (ANOVA with Holm-Bonferroni’s post-hoc test).
Extended Data Figure 8
Extended Data Figure 8. Placental rescue of Sox2-Cre mediated conditional knockout (cKO) of Nubpl.
(a) Additional images of Nubpl-mutant embryos showing that a wild-type trophoblast compartment significantly rescues the developmental retardation phenotype and embryonic defects observed in the full KO at E9.5. At E11.5, Nubpl-/- embryos can still be recovered while complete KO embryos are not retrievable any more. Images are representative of ≥10 independent embryos with the corresponding genotype. (b) Histological analysis of the corresponding placentas at E11.5 shows a complete rescue of the placental defect in cKOs with a genetically functional trophoblast lineage. Sections were stained for MCT4 (SynT-II marker), E-Cadherin (Cdh1, global SynT marker) and Laminin (Lam, blood vessel basement membrane marker).Images are representative of 3 placentas per genotype.
Extended Data Figure 9
Extended Data Figure 9. Transcriptomic analysis of placentas from rescue experiments and developmental performance of Bap1 cKOs.
(a) Principal component analysis of global transcriptomes of E9.5 placentas with the indicated genotype. “Res” refers to placentas from Sox2-Cre mediated conditional KOs in which the trophoblast lineage remains functional, whereas the embryo is ablated for the gene-of-interest (E:KO; T: HET). (b) Top row: E9.5 embryo photos of the depicted genotypes for the Bap1 strain. The embryonic lethality of the complete Bap1 KO cannot be rescued by a functional trophoblast compartment. Images are representative of ≥12 independent embryos per genotype. Bottom row: Histological analysis of the corresponding placentas, stained as in Fig. 5b and Extended Data Fig. 8b. Arrows point to partially rescued syncytiotrophoblast loops and some vascular invaginations into the chorionic ectoderm. Yet the vascularisation of the forming labyrinth layer remains under-developed compared to controls. Images are representative of 3 placentas per genotype.
Extended Data Figure 10
Extended Data Figure 10. Analysis of yolk sac morphology in Nubpl, Bap1 and Crb2 mutants and developmental performance of Crb2 cKOs.
(a) Immunofluorescence staining of yolk sacs for E-Cadherin (Cdh1, green) and Laminin (Lam, red) demarcating the visceral endoderm (VE) and basement membrane of the yolk sac mesoderm (YSM), respectively. Bl: Blood cells. Bap1 and Crb2 mutants show a defect characterised by the lack of attachment of the two visceral yolk sac layers (arrows). This defect cannot be rescued by Sox2-Cre mediated cKO, indicating that its cause resides in the extra-embryonic mesoderm lineage. (b) Developmental performance of Crb2 KO and cKO embryos and analysis of placental morphology, equivalent to Extended Data Fig. 8b. No rescue of embryonic lethality or placental defects is observed in the cKOs (E: KO; T: HET). Images are representative of ≥3 independent conceptuses per genotype.
Figure 1
Figure 1. Placental defects are highly prevalent in gene mutants that affect embryonic viability.
(a) Summary of the 103 mouse lines screened. E: day of embryonic development; P: day of postnatal development. ‘Subviable’ identifies strains in which the proportion of mutant offspring is >0% but ≤13%. (b) Summary of non-viable mouse lines in which a placental phenotype has been annotated in Mouse Genome Informatics (MGI; http://www.informatics.jax.org) and in our DMDD programme. (c) Yolk sac appearance in wild-type (WT) and Dennd4c mutants. Images are representative of 3 independent mutants and >60 WT samples analysed. Sections were stained for E-Cadherin (green, demarcating the visceral endoderm) and Laminin (red, highlighting the basement membrane). Arrows point to the disconnected mesoderm and endoderm layers in mutants. (d) Breakdown of the proportion of placental phenotypes by stage of embryonic lethality. (e) Developmental progression of mutant embryos depending on presence or absence of a placental phenotype. TS: Theiler stage.
Figure 2
Figure 2. Summary of common placental defects and functional networks.
(a) Common phenotype criteria used to assess E9.5 mutant placentas (red = abnormality detected). TGC: trophoblast giant cell. (b) E14.5 placental phenotypes in mutant strains. SpT: spongiotrophoblast; Lab: labyrinth. (c) Top: Schematic representation of main structures of an E9.5 placenta. Below: In situ hybridisation for spongiotrophoblast marker Tpbpa and immunostaining against E-Cadherin (Cdh1) on WT and mutant placentas, as indicated. Large red arrows highlight Tpbpa-positive cells. Small red arrows in the Cdh1-stained WT placenta highlight nucleated blood cells in fetal blood vessels; arrowheads in the Pigl-/- placenta demarcate sites of chorionic ectoderm invagination but absence of blood vessels. (d) Top: Schematic representation of main structures of an E14.5 placenta. Below: Examples of histological analyses of E14.5 WT and mutant placentas: Tpbpa in situ hybridisation, red vertical line shows thickness of junctional zone. BSI-B4 isolectin staining demarcating the three main placental layers; red rectangle highlights the severely reduced complexity of labyrinth vascularisation in the Traf2 mutant. E-Cadherin (Cdh1) immunohistochemistry labelling syncytiotrophoblast; red arrowheads point to widened blood spaces, arrows to fibrotic areas. Images in (c) and (d) are representative of ≥3 independent mutants per line, see Methods. (e) Network created using esyN (www.esyn.org) of known interactors of L3mbtl2.
Figure 3
Figure 3. Phenotype co-associations between embryo and placenta.
(a) Enriched embryonic phenotype terms within the significantly co-associated categories of abnormal brain, blood vessel and heart morphology in mutant lines with abnormal placentas, compared to those with normal placentas (dark red: fully penetrant phenotype). For brevity, the description as “abnormal” has been removed from ontology terms. The most prevalent terms describing abnormalities observed in brain, blood vessel and heart development are shown. (b)-(d) HREM images showing embryonic phenotypes that correlate with the presence of placental defects. Upper row: normal morphology in stage-matched controls; bottom row: distinct developmental abnormalities in corresponding structures of mutants: (b) Abnormal forebrain morphology (asterisks) in Ssr2-/- embryo. (c) Double outlet right ventricle and bicuspid aortic valve in Chtop-/- embryo. Right ventricle (rv) with oblique outlet (asterisk). (d) Perimembraneous ventricular septal defect (asterisk) in Ssr2-/- embryo. I, II, III: 1st, 2nd and 3rd ventricle; aa: ascending aorta; av: aortic valve; hb: hindbrain; la, ra: left, right atrial appendix; lDi, rDi: left, right diencephalon; lTel, rTel: left, right telencephalon; lv, rv: left, right ventricle; pv: pulmonary valve; pt: pulmonary trunk; vs: ventricle septum. Defects shown in (b)-(d) are representative of ≥3 independent mutants.
Figure 4
Figure 4. Determining trophoblast-specific gene function.
(a) Analysis of Nubpl-/- TSCs grown in self-renewal conditions (“0d”) or upon differentiation for 3 and 6 days. Data are mean +/- S.E.M. *= p<0.05; **= p<0.01; ***= p<0.001 (ANOVA with Holm-Bonferroni’s post-hoc test). Specific defects are summarised in the schematic. (b) Equivalent analysis for Bap1-/- TSCs. EPC: ectoplacental cone; GlyT: glycogen cells; SpT: spongiotrophoblast; SynT: syncytiotrophoblast (layers I and II); TGC: trophoblast giant cells.
Figure 5
Figure 5. Dissecting lineage origins of placental phenotypes.
(a) Schematic representation of the genetic constitutions of embryo (E) and placenta (P) or trophoblast (T) achieved by conditional Sox2-Cre mediated knockout (KO), and corresponding E9.5 embryos of the Nubpl strain. Phenotypes are representative of ≥12 embryos per genotype. (b) Immunofluorescence staining of corresponding placentas for MCT4 (marker of SynT-II), E-Cadherin (Cdh1) and basement membrane component Laminin (Lam; demarcates fetal blood vessels). Nuclear counterstain with DAPI. Placental defects are representative of ≥3 independent mutants per genotype.

Similar articles

Cited by

References

    1. Ayadi A, et al. Mouse large-scale phenotyping initiatives: overview of the European Mouse Disease Clinic (EUMODIC) and of the Wellcome Trust Sanger Institute Mouse Genetics Project. Mamm Genome. 2012;23:600–610. - PMC - PubMed
    1. de Angelis MH, et al. Analysis of mammalian gene function through broad-based phenotypic screens across a consortium of mouse clinics. Nat Genet. 2015;47:969–978. - PMC - PubMed
    1. White JK, et al. Genome-wide generation and systematic phenotyping of knockout mice reveals new roles for many genes. Cell. 2013;154:452–464. - PMC - PubMed
    1. Adams D, et al. Bloomsbury report on mouse embryo phenotyping: recommendations from the IMPC workshop on embryonic lethal screening. Dis Models Mech. 2013;6:571–579. - PMC - PubMed
    1. Dickinson ME, et al. High-throughput discovery of novel developmental phenotypes. Nature. 2016;537:508–514. - PMC - PubMed

Publication types