. 2018 Mar 22;555(7697):529-533.
doi: 10.1038/nature25976. Epub 2018 Mar 14.

Diffusible repression of cytokinin signalling produces endodermal symmetry and passage cells

Affiliations

Diffusible repression of cytokinin signalling produces endodermal symmetry and passage cells

Tonni Grube Andersen et al. Nature. .

Erratum in

Abstract

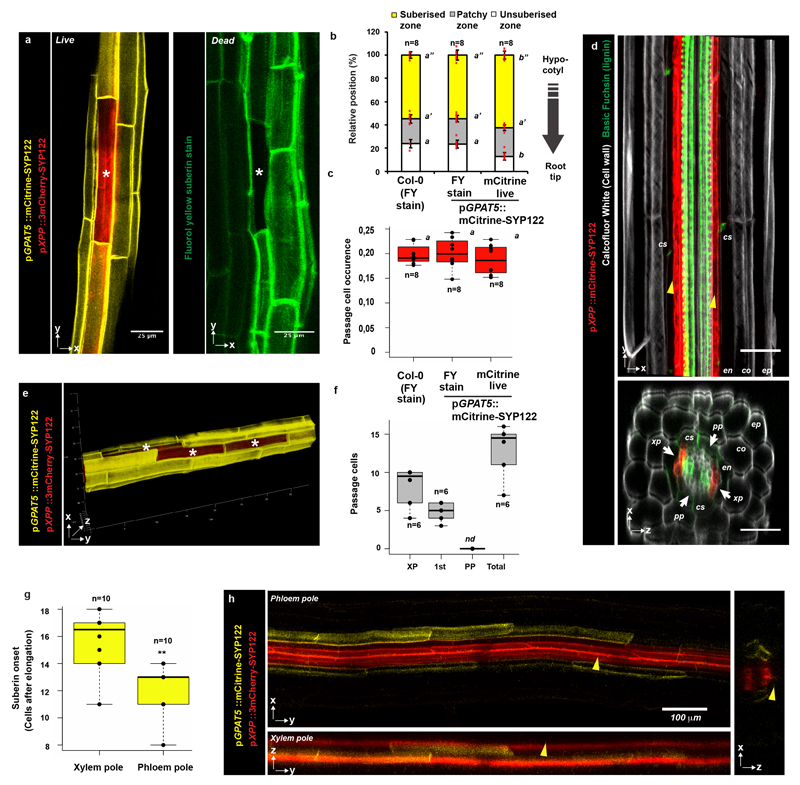
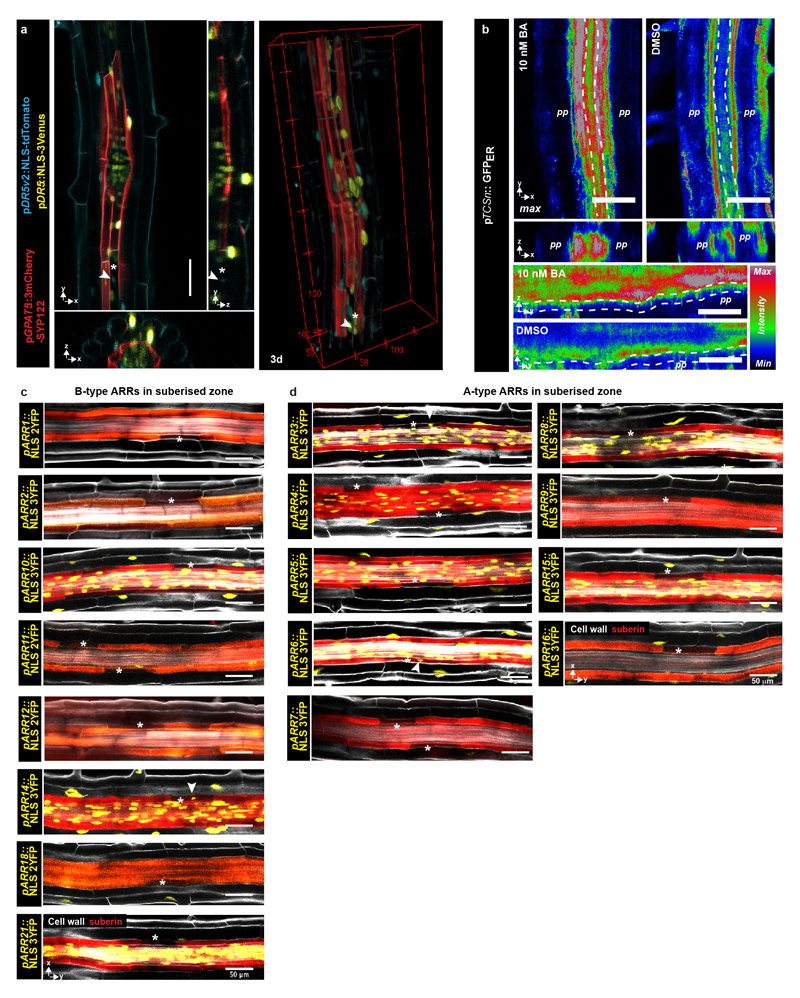
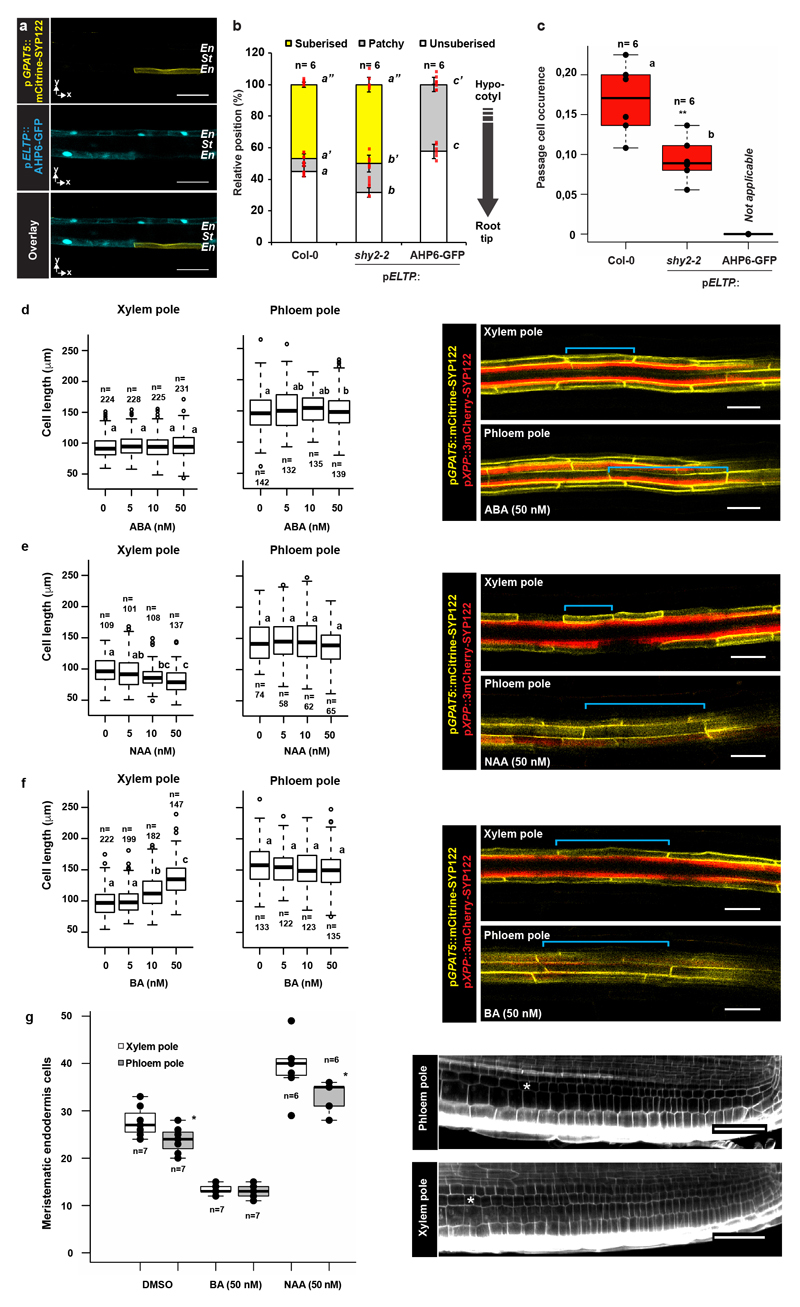
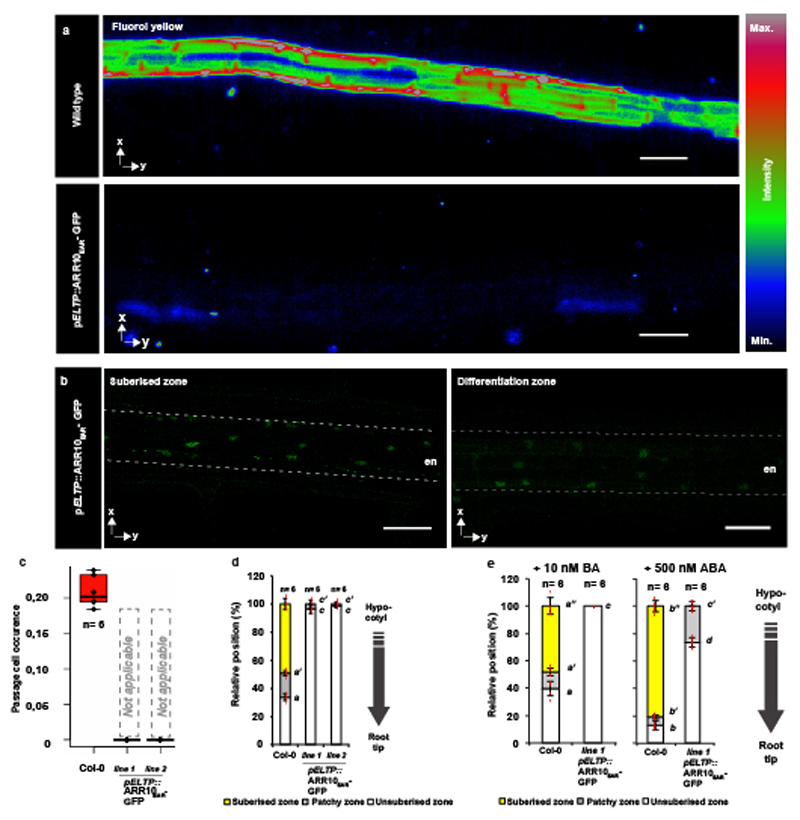
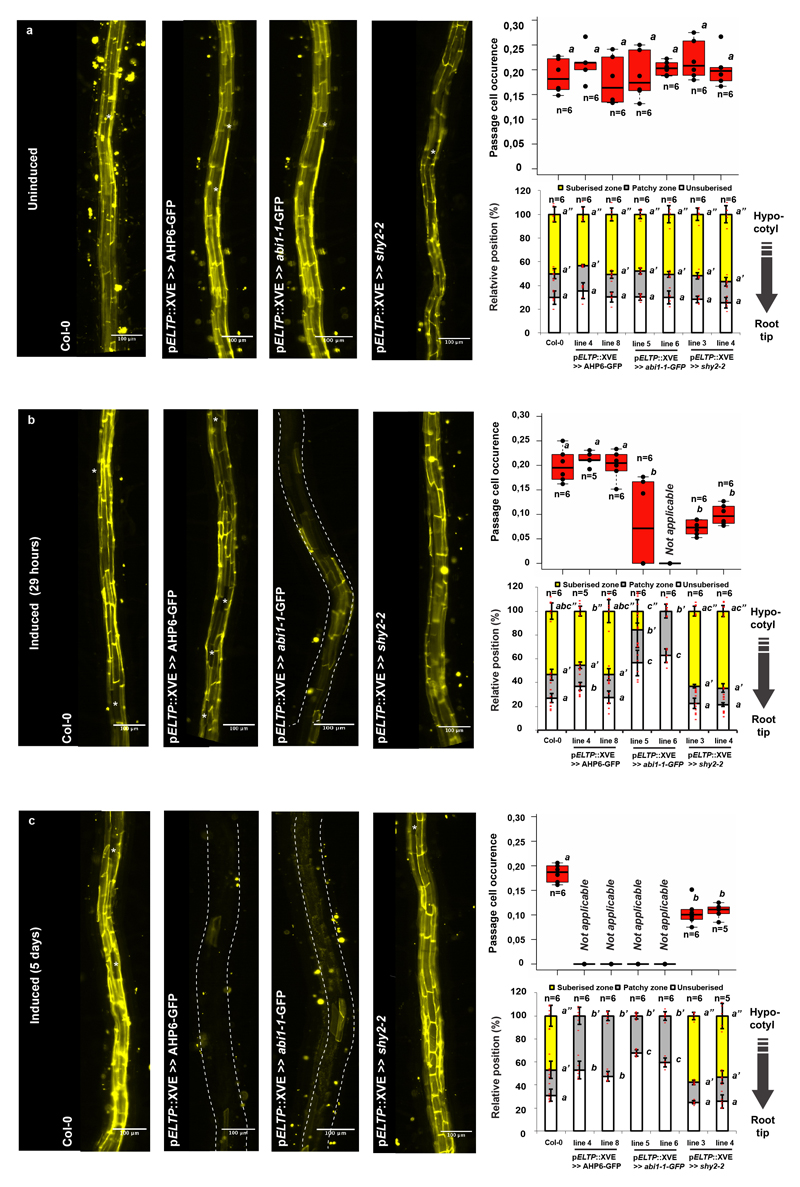
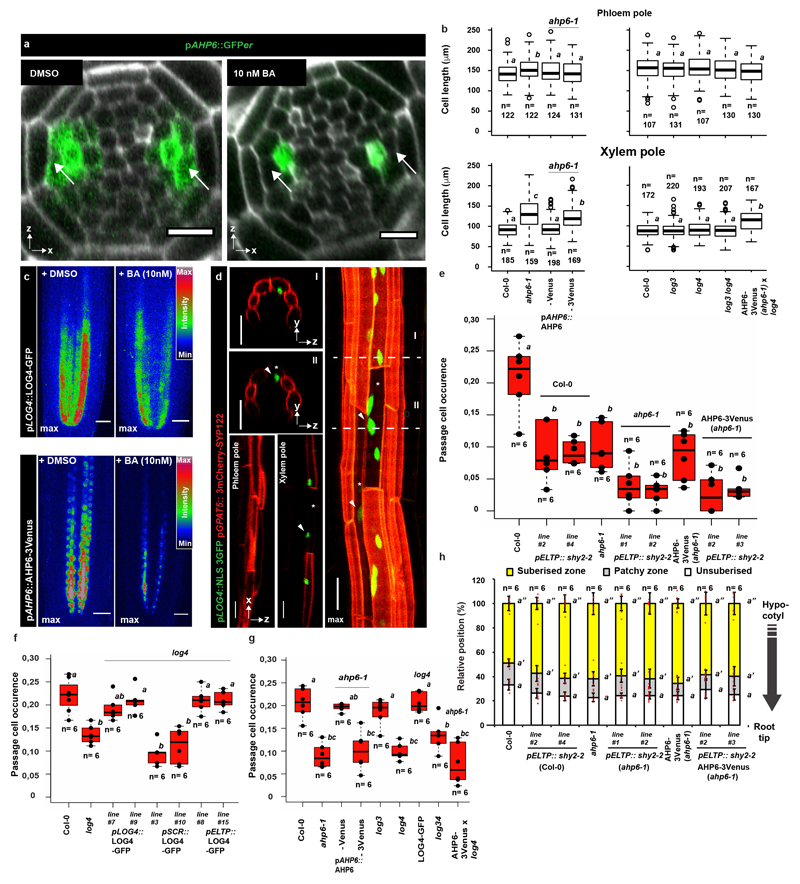
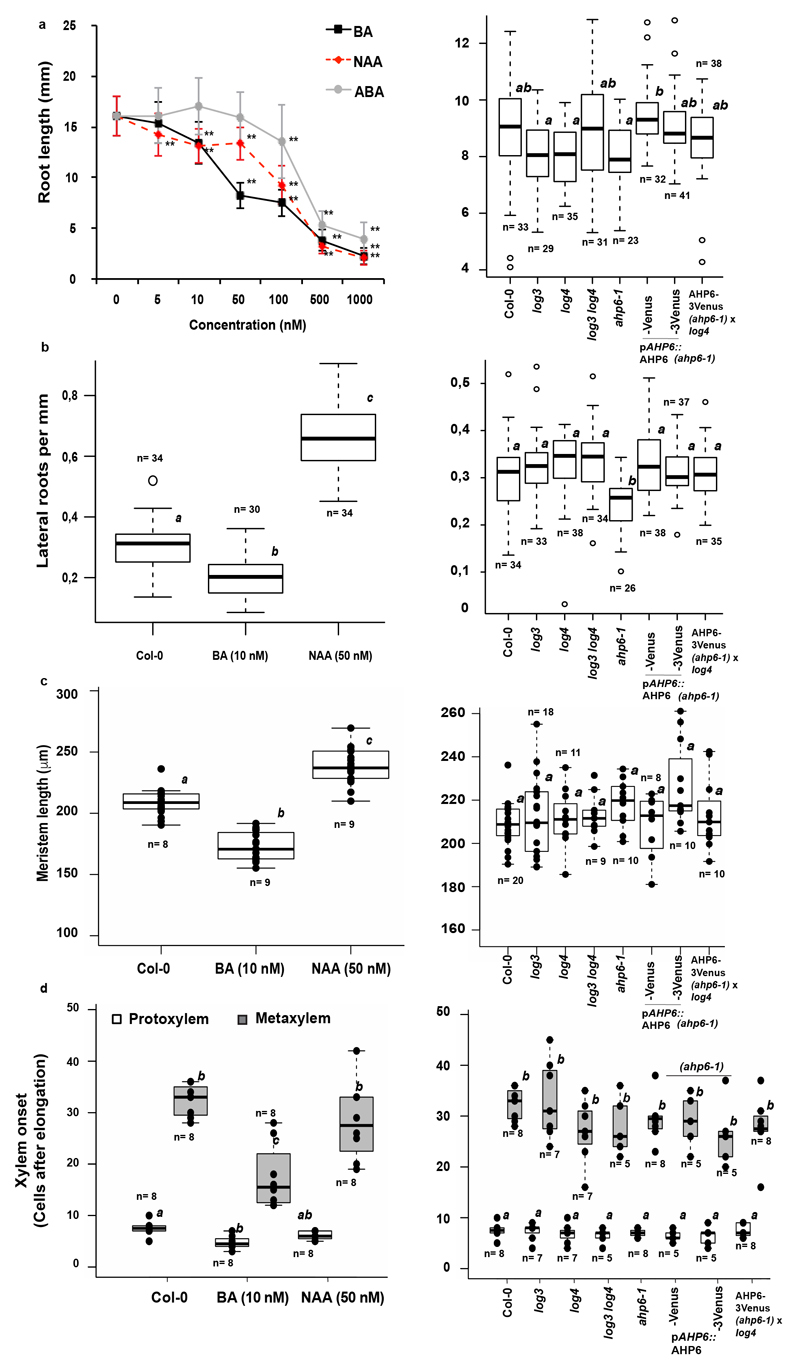
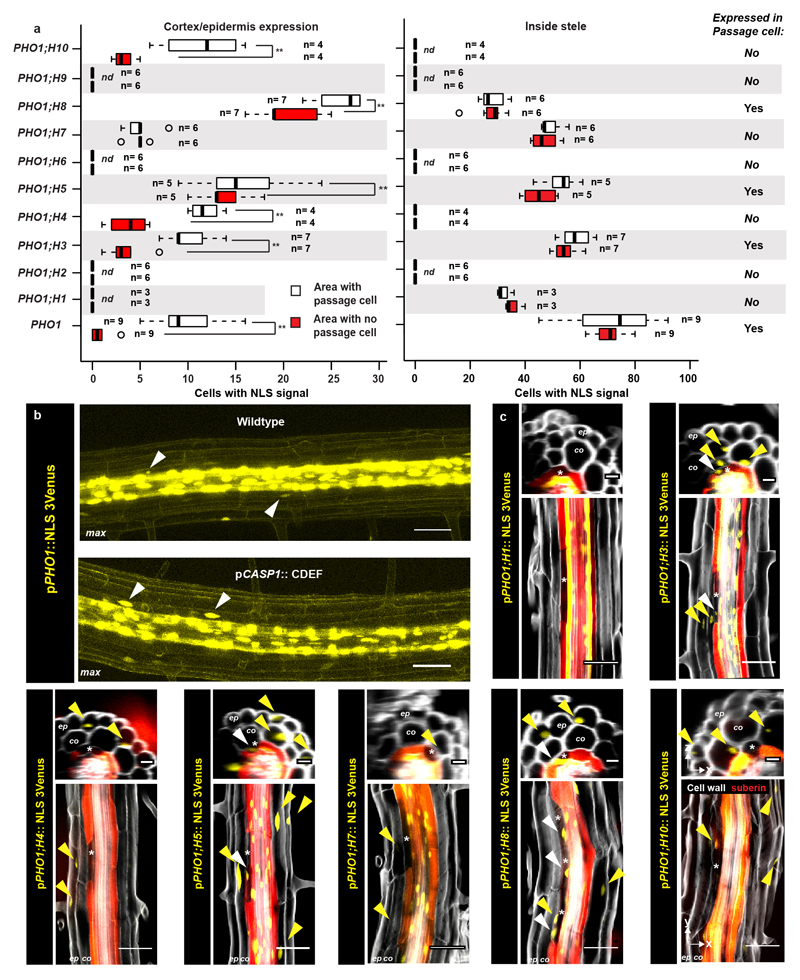
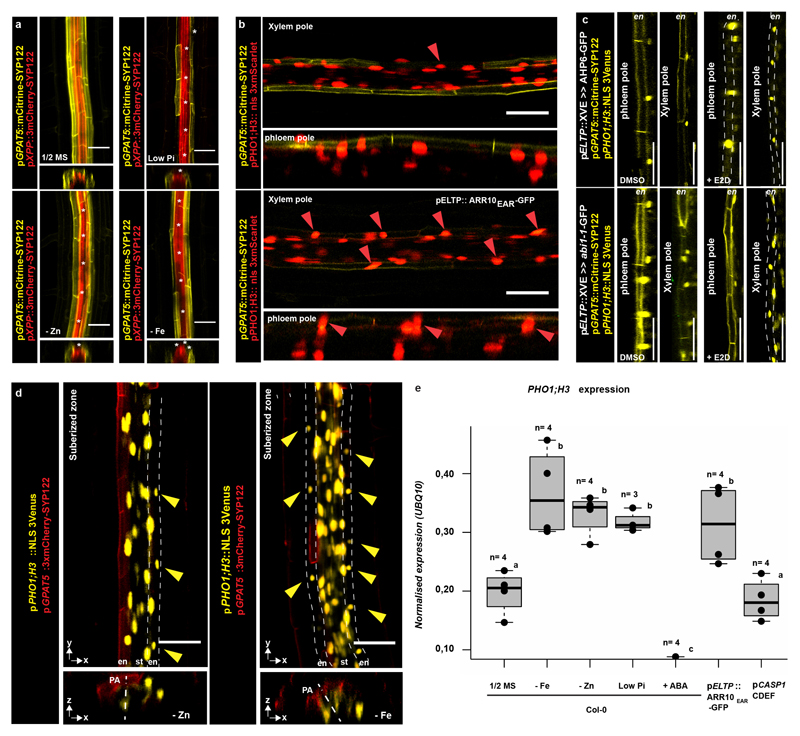
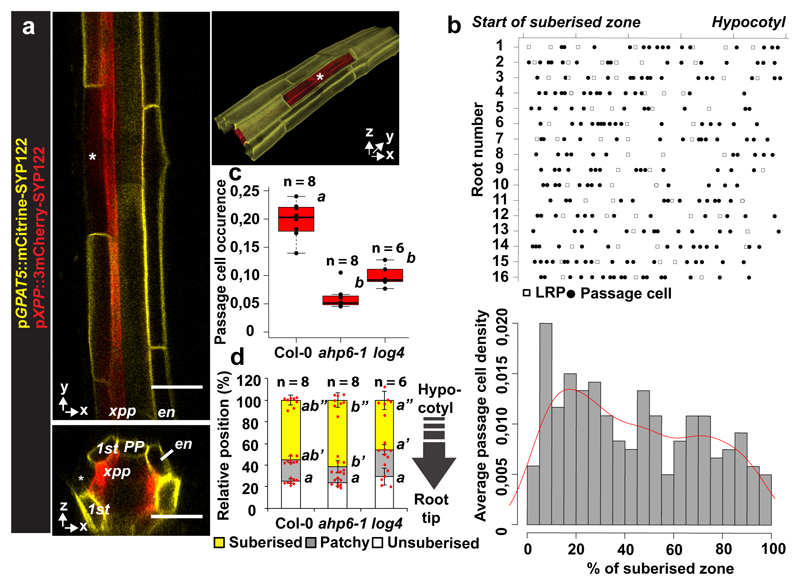
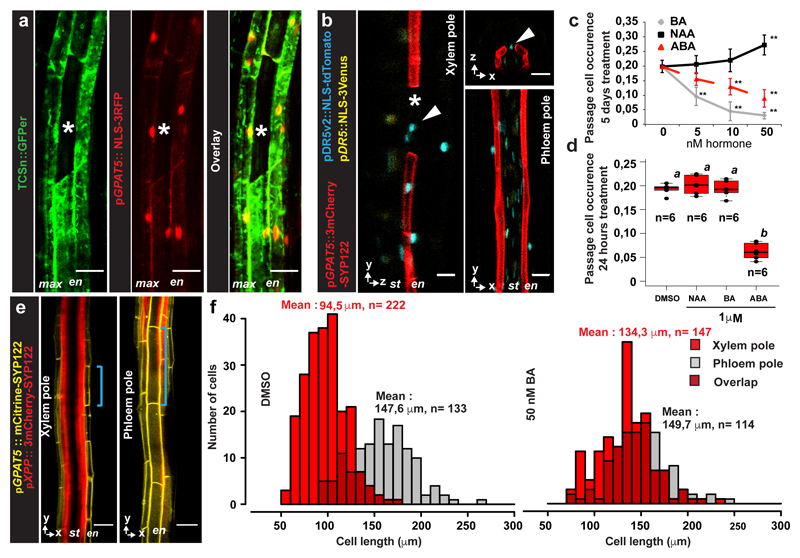
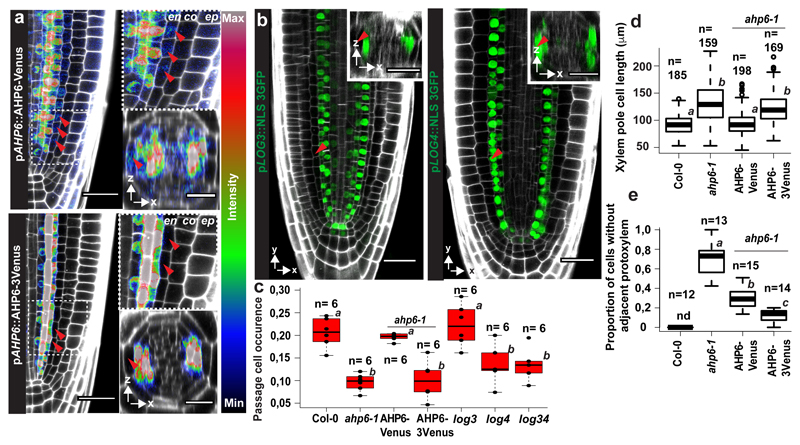
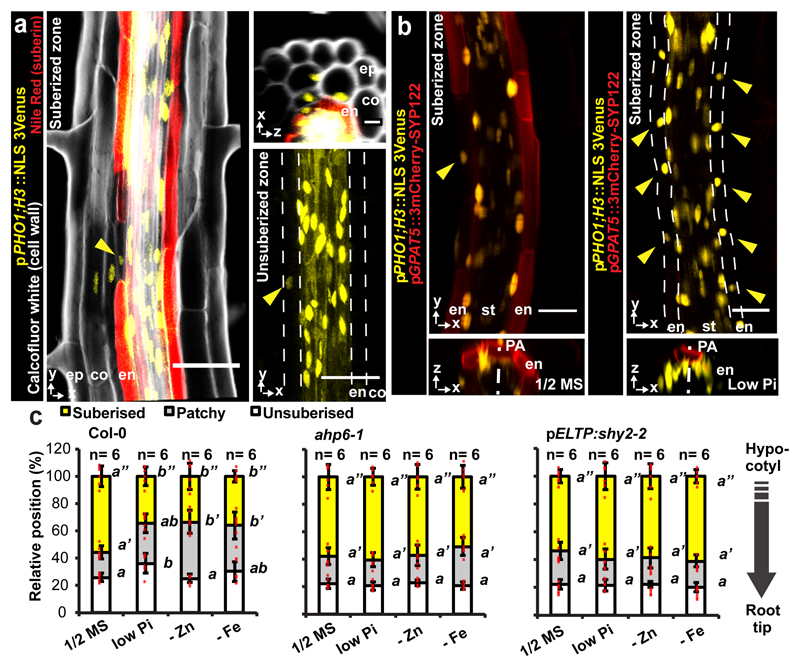
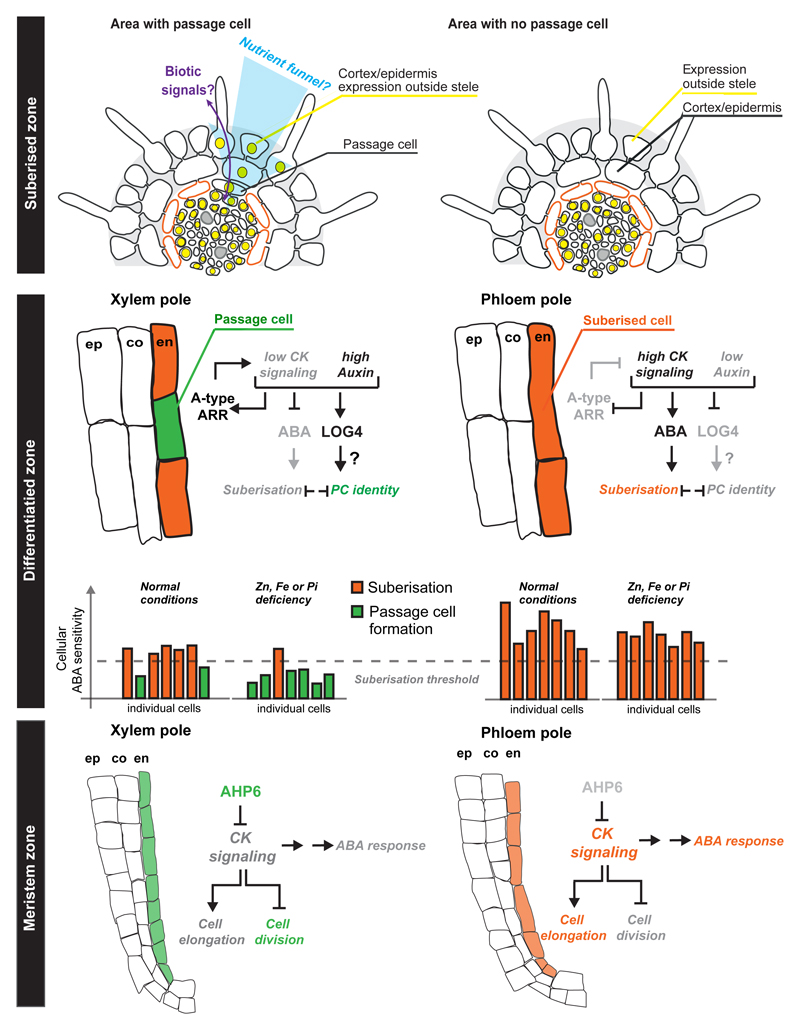
In vascular plants, the root endodermis surrounds the central vasculature as a protective sheath that is analogous to the polarized epithelium in animals, and contains ring-shaped Casparian strips that restrict diffusion. After an initial lag phase, individual endodermal cells suberize in an apparently random fashion to produce 'patchy' suberization that eventually generates a zone of continuous suberin deposition. Casparian strips and suberin lamellae affect paracellular and transcellular transport, respectively. Most angiosperms maintain some isolated cells in an unsuberized state as so-called 'passage cells', which have previously been suggested to enable uptake across an otherwise-impermeable endodermal barrier. Here we demonstrate that these passage cells are late emanations of a meristematic patterning process that reads out the underlying non-radial symmetry of the vasculature. This process is mediated by the non-cell-autonomous repression of cytokinin signalling in the root meristem, and leads to distinct phloem- and xylem-pole-associated endodermal cells. The latter cells can resist abscisic acid-dependent suberization to produce passage cells. Our data further demonstrate that, during meristematic patterning, xylem-pole-associated endodermal cells can dynamically alter passage-cell numbers in response to nutrient status, and that passage cells express transporters and locally affect the expression of transporters in adjacent cortical cells.


Conflict of interest statement

The authors declare no competing financial interests.

Figures

Extended Data Figure 1
Extended Data Figure 1. Passage cells and suberisation in Arabidopsis
a) A single xylem pole-associated passage cell surrounded by suberised cells as visualized in live imaging by expression of the suberin biosynthetic gene GPAT5 driving expression of a plasma membrane localized mCitrine reporter (mCitrine-SYP122) (yellow, left panel) or by the suberin-specific dye fluorol yellow (green, right panel). In the left panel, the xylem pole pericycle is highlighted using the promoter pXPP driving a 3mCherry reporter fused to the plasma membrane localized SYP122 (3mCherry-SYP122). Note that Fluorol Yellow protocol, which requires heating (70°C) of the sample and is incompatible with fluorescent protein detection. b) Comparison of endodermal suberisation in Col-0 and plants expressing the GPAT5-based reporter determined either by the suberin-specific dye Fluorol Yellow (FY) or live mCitrine expression, respectively. Red dots represent individual data points. c) Comparison of passage cell occurrence in Col-0 and plants expressing the GPAT5-based reporter determined either by the suberin-specific dye Fluorol Yellow (FY) or live mCitrine expression. Dots represent individual data points d) Expression of a plasma membrane localized mCitrine-SYP122 marker (red) driven by the xylem pole-specific promoter pXPP in the zone of protoxylem onset. Roots were cleared using ClearSee and stained with Basic Fuchsin (green) and Calcofluor White (grey). e) Radial- and longitudinally connected passage cells in the xylem pole of the suberised zone. f) Direct quantification of passage cells residing directly above xylem pole (XP), first side cell to the xylem pole (1st) or phloem pole (PP) in 5-day-old Col-0 plants. Dots represent individual datapoints. g) Quantification of the onset of endodermal suberisation in the phloem and xylem poles of roots expressing markers as in a). Dots represent individual data points. h) Representative images of the patchy zone of endodermal suberisation in the phloem and xylem poles of roots used for quantification in f). Yellow arrowheads indicate the xylem pole. co; cortex, cs; Casperian strip, en; endodermis, ep; epidermis, FY; fluorol yellow, pp; phloem pole, xp; xylem pole. Individual letters highlight significant differences between groups. Notice that for all stacked graphs there are 3 measurements per root (unsuberised zone (white), patchy zone (grey) and suberised zone (yellow)). Bar graphs represent mean ± SD, boxplots show median. Individual letters show significantly different groups according to a post hoc Bonferroni-adjusted paired two-sided T-test. For more information on data plots see the statistics and reproducibility section. a) and e) represent 5 independent lines, all stainings were repeated 3 times. n represents independent biological samples. ** Depicts significant difference in a two-tailed T-test. For individual P values see supplementary table 2. Scale bars represent 25 μm unless otherwise mentioned.
Extended Data Figure 2
Extended Data Figure 2. Auxin and cytokinin signaling in the suberised root zone
a) Activity of the auxin-signaling reporter DR5 (yellow) as well as the highly sensitive DR5v2 (blue) in an area of the suberised zone of a 5-day-old root with an emerging lateral root. Suberised cells were visualized based on the suberin biosynthetic gene GPAT5 driving expression of a plasma membrane localized 3mCherry-based reporter b) Expression of ER-localized GFP driven by the cytokinin signaling reporter TCSn in the phloem and xylem poles of 5-day-old roots in the suberized zone. Plants were either grown on plates containing 5 nM cytokinin (BA) or a mock treatment (DMSO). Punctured lines indicate the endodermis. c) Expression of B-type ARRs in the suberised endodermis of 5-day-old roots, suberin and cellwalls are stained using a Clearsee protocol in combination with Nile Red and Calcoflour White, respectively d) Expression of A-type ARRs in the suberised endodermis of 5-day-old roots, suberin and cell walls as in d). All stainings were repeated 3 times. For a) and b) the image is representative of 8 independent lines. White arrowheads depict passage cell nuclei. Asterisk marks passage cells. BA; Benzyladenine, Co; Cortex, En; Endodermis. Scale bars represent 50 μm.
Extended Data Figure 3
Extended Data Figure 3. Hormone-induced closure of passage cells
Time course analysis showing behavior of passage cells visualized by mCitrine-SYP122 driven by the promoter of the suberin synthesis marker gene GPAT5 for 9 hours on ½ MS media containing DMSO, cytokinin (BA), auxin (NAA) or abscisic acid (ABA). Red arrowheads point to ectopic suberisation in the cortex upon ABA treatment. Asterisks mark passage cells. ABA; Abscisic acid, BA; Benzyladenine, Co; Cortex, En; Endodermis, NAA; Naphtalene acetic acid. All time courses were repeated 3 times. Scale bars represent 50 μm.
Extended Data Figure 4
Extended Data Figure 4. Hormone-induced changes in endodermal cell lengths
a) Expression of mCitrine-SYP122 driven by the GPAT5 promoter (yellow) in the fully suberised zone in plants expressing the dominant cytokinin-signaling inhibitor AHP6 fused to GFP in the differentiated endodermis using the ELTP promoter (Blue). b) Endodermal suberisation in 5-day-old seedlings expressing AHP6-GFP or the dominant auxin signaling repressor shy2-2 in the differentiated endodermis. Red dots represent individual datapoints. c) Occurrence of passage cells in 5-day-old seedlings expressing AHP6-GFP or the auxin signaling repressor shy2-2 in the differentiated endodermis. Dots represent individual datapoints. d-f) Length of suberised endodermal cells measured in the suberised zone of plants expressing pGPAT5::mCitrine-SYP122 and pXPP::3mCherry-SYP122 constructs. Open circles represent outliers. Plants were grown for 5 days on ½ MS media containing depicted concentrations of d) Abscisic acid (ABA). e) Auxin, Naphtalene acetic acid (NAA). f) Cytokinin, Benzyladenine (BA). g) Amount of meritematic cells in the phloem and xylem pole endodermis was counted in cleared roots stained with Calcofluor White to highlight cell walls. Dots represent individual datapoints. Notice that for all stacked graphs there are 3 measurements per root (unsuberised zone (white), patchy zone (grey) and suberised zone (yellow)). Protoxylem or -phloem was used as a marker to identify the poles. Cells were counted from the QC to onset of elongation. Asterisks highlight the last cell of the division zone. Blue lines highlight length of an individual cell. Letters indicate significant differences between groups. Bar graphs represent mean ± SD, boxplot centers show median. Individual letters show significantly different groups according to a post hoc Bonferroni-adjusted paired two-sided T-test. For more information on data plots see the statistics and reproducibility section. In a) the image is representative of 12 independent lines. In g) all stainings were repeated 3 times. n represents number of measurements across 16 independent biological samples. ** Depicts significant difference (p< 0,01) in a two-tailed T-test. Scale bars represent 25 μm.
Extended Data Figure 5
Extended Data Figure 5. Manipulation of suberisation through signaling repression
a) Representative pictures of Fluorol Yellow staining of suberin in lines expressing ARR10EAR-GFP in all differentiated endodermal cells driven by the ELTP or CASP1 promotors. b) Occurrence of passage cells in lines expressing ARR10EAR-GFP in all differentiated endodermal cells using the ELTP and CASP1 promotor. c) Behavior of suberin in lines expressing ARR10EAR-GFP in all differentiated endodermal cells using the ELTP and CASP1 promotor. d) Behavior of suberin in 5-day-old plants expressing ARR10EAR-GFP in all differentiated endodermal cells using the ELTP and CASP1 promotor. Dots represent individual datapoints. Red dots represent individual datapoints. e) Behavior of suberin in 5-day-old plants expressing ARR10EAR-GFP in all differentiated endodermal cells using the ELTP and CASP1 promotor when plants were germinated on either cytokinin (BA) or abscicic acid (ABA). Red dots represent individual datapoints. Notice that for all stacked graphs there are 3 measurements per root (unsuberised zone (white), patchy zone (grey) and suberised zone (yellow)). Bar graphs represent mean ± SD, boxplots show median. Individual letters show significantly different groups according to a post hoc Bonferroni-adjusted paired two-sided T-test. For more information on data plots see the statistics and reproducibility section. In b) the image is representative of 9 independent lines. All stainings were repeated 3 times. n represents independent biological samples. Scale bars represent 50 μm.
Extended Data Figure 6
Extended Data Figure 6. Temporal control of suberin inhibition
Expression of temporally controlled dominant inhibitors of cytokinin (AHP6-GFP), ABA (abi1-1-GFP) or auxin (shy2-2) signaling in the differentiated endodermis using an estradiol inducible system (XVE). a-c) Fluorol Yellow staining (left) and quantification of passage cells (top right) and suberin (bottom right) in the late endodermis of plants grown on ½ MS media containing DMSO for 5 days a), plants grown for 4 days on ½ MS media containing DMSO then transferred to 5 μM estradiol for 29 hours b) or germinated for 5 days on ½ MS media plates containing 5 μM estradiol c). nd; not detected. Asterisks indicate passage cells. All dots represent individual datapoints. Notice that for all stacked graphs there are 3 measurements per root (unsuberised zone (white), patchy zone (grey) and suberised zone (yellow)). n represent biologically independent samples. Bar graphs represent mean ± SD, boxplot centers show median. Individual letters show significantly different groups according to a post hoc Bonferroni-adjusted paired two-sided T-test. For more information on data plots see the statistics and reproducibility section. Images in a) - c) are representative of 9 independent lines. All stainings were repeated 3 times. n represents independent biological samples. Scale bars represent 100 μm.
Extended Data Figure 7
Extended Data Figure 7. Cytokinin-dependent formation of passage cells
a) Expression of AHP6 visualized by an endoplasmic reticulum-localized GFP (GFPer) in the root apical meristem of plants grown either in presence of a mock treatment (DMSO) or 10 nM cytokinin (BA). Arrows point to xylem pole pericycle cells b) Length of suberised endodermal cells in the phloem and xylem poles of 5-day-old ahp6-1 and log mutants, complementing lines and stacked mutants grown on ½ MS plates. Data is partly overlapping with Figure 3. Open circles represent outliers. c) Expression of LOG4-GFP and AHP6-3Venus driven by their native promoters in the root apical meristem of plants grown either in presence of mock treatment (DMSO) or 10 nM cytokinin (BA) d) Expression of LOG4 in the suberised zone of 5-day-old seedlings visualized by the native LOG4 promoter driving expression of an NLS-3GFP construct. Suberised endodermal cells were highlighted by expression of the suberin biosynthetic marker pGPAT5::3mCherry-SYP122. e) Occurrence of passage cells in lines with inhibited AHP6 diffusion in combination with repressed auxin signaling (through expressing of shy2-2) in the differentiated endodermis. Dots represent individual datapoints. f) Passage cell occurrence in the log4 mutant complemented with a LOG4-GFP construct driven by either the native promotor (pLOG4), an early endodermis promoter (pSCR) or a differentiating endodermis promoter (pELTP). Dots represent individual datapoints. g) Occurrence of passage cells in the suberised zone of 5-day-old ahp6-1 and log mutants, ahp6 log doubles additionally complemented by non-mobile AHP6 in order to obtain endodermis-specific defects. Dots represent individual datapoints. h) Behavior of suberin in plants with or without inhibited auxin perception in the late endodermis grown on ½ MS plates. Red dots represent individual datapoints. Notice that for all stacked graphs there are 3 measurements per root (unsuberised zone (white), patchy zone (grey) and suberised zone (yellow)). Bar graphs represent mean ± SD, boxplot centers show median. Individual letters show significantly different groups according to a post hoc Bonferroni-adjusted paired two-sided T-test. For more information on data plots see the statistics and reproducibility section. Images in c) and d) represent 8 independent lines. All stainings were repeated 3 times. n represents independent biological samples. In b) n represents measurements across 16 biologically independent samples. For a) scale bars represent 10 μm. For all others 25 μm.
Extended Data Figure 8
Extended Data Figure 8. Phenotypic analysis of hormone-treated plants and mutants
a) Root length of 5-day-old plants either germinated on increasing concentration of cytokinin (BA), auxin (NAA) or abscisic acid (ABA) (left) or of mutants used in this study (right). Open circles represent outliers. b) Emerged lateral roots per mm of 10-day-old Col-0 roots germinated in presence of DMSO, 10 nM cytokinin (BA) or 50 nM auxin (NAA) (left) or of mutants used in this study (right). Open circles represent outliers. c) Length of the root apical meristem of 5-day-old Col-0 plants germinated on either DMSO, 10 nM cytokinin (BA) or 50 nM auxin (NAA) (left) or of mutants used in this study (right). Dots represent individual datapoints. d) Onset of protoxylem and metaxylem after the elongation zone of 5-day-old seedling germinated in presence of DMSO, 10 nM cytokinin (BA) or 50 nM auxin (NAA) (left) or of mutants used in this study (right). Dots represent individual datapoints. ABA; Abscisic acid, BA; Benzyladenine, NAA; Naphtalene acetic acid. Bar graphs represent mean ± SD, boxplot centers show median. Individual letters show significantly different groups according to a post hoc Bonferroni-adjusted paired two-sided T-test. For more information on data plots see the statistics and reproducibility section. n represents independent biological samples. In a) ** Depicts significant difference (p<0,01) in a two-tailed T-test n = 25 independent biological replicas for each treatment.
Extended Data Figure 9
Extended Data Figure 9. The PHO1 transporter gene family as marker for passage cells
a) Expression of PHO1 family members in the cortex/epidermis (left panel) and inside the stele (right panel) within the suberised zone of 5-day-old roots grown on ½ MS media. Individual nuclei showing expression of the respective NLS reporter were counted in similar 3D stacks taken in either a fully suberized area (red bars) or an area containing one passage cell (white bars). Open circles depict outliers. b) Expression of PHO1 in 5-day-old seedling in the late endodermis of Wildtype or a suberin-degradation line with virtually absent suberin (pCASP1::CDEF1). c) Representative images of each of the PHO1 members’ expression, highlighted by NLS-3Venus reporter, found to be expressed in roots of 5-day-old seedlings. Seedlings stained with Nile Red for suberin and Calcofluor White for cell walls. Scale bars in XZ projections represent 10 μm. White arrowheads highlight passage cell nuclei, yellow arrowheads point toward nuclei of cortex/epidermal cells. Asterisks emphasize passage cells. nd; not detected. Boxplot centers show median. ** depicts significant differences between groups (P<0,01) according to a two-sided T-test. For more information on data plots see the statistics and reproducibility section. In b) and c) the images represent 15 and 11 independent lines respectively, all stainings were repeated 3 times. n represents independent biological samples. Unless otherwise stated, scale bars represent 25 μm. For inserts scale bars represent 10 μm.
Extended Data Figure 10
Extended Data Figure 10. Nutrient deficiency responses of suberisation in the xylem pole
a) Expression of the suberin marker GPAT5 and the xylem pole pericycle marker XPP using a mCitrine-SYP122 or a 3mCherry-SYP122 plasma membrane-anchored reporter, respectively figure is representative of 5 independent lines. Plants were germinated for 5-days on ½ MS media, plates with low (10 μM) inorganic phosphate (low Pi), no zinc (-Zn) or no iron (-Fe) image is representative of 4 independent lines. b) Expression of the suberin marker GPAT5 and PHO1;H3 using a mCitrine-SYP122 or a NLS 3mScarlet reporter respectively in the suberised zone of Col-0 plants or plants expression the dominant cytokinin signaling repressor ARR10-GFP in all differentiating endodermal cells. Each image is representative of 8 independent lines. c) Expression of the suberin marker GPAT5 and PHO1;H3 using a mCitrine-SYP122 or a NLS 3Venus reporter respectively in the suberised zone of plants expressing estradiol-inducible (XVE) versions of the dominant cytokinin signaling repressor AHP6-GFP or the dominant ABA signaling repressor abi1-1 in all differentiated endodermal cells. Plants were grown for 5 days in presence of DMSO or 5 μM Estradiol (E2D), all treatments were repeated 3 times. Each image is representative of 5 independent lines. d) Expression of PHO1;H3 and the suberin marker GPAT5 in roots of 5-day-old Col-0 plants grown on ½ MS media, plates containing no iron (-Fe) no zinc (-Zn) with low (10 μM) inorganic phosphate (low Pi). Each image is representative of 9 independent lines. All treatments were repeated 3 times. e) Transcriptional analysis of PHO1;H3 expression in roots of 5-day-old Col-0 plants grown on ½ MS media, plates containing no iron (-Fe) no zinc (-Zn) with low (10 μM) inorganic phosphate (low Pi), in plants expression the dominant cytokinin signaling repressor ARR10-GFP in all differentiated endodermal cells or in plants with strongly reduced suberin deposition by expression of a suberin degrading enzyme (pCASP1::CDEF). Expression was normalized to that of UBQ10. Dots represent individual datapoints. Notice that for all stacked graphs there are 3 measurements per root (unsuberised zone (white), patchy zone (grey) and suberised zone (yellow)). Asterisks highlight unsuberised xylem pole endodermal cells. Boxplot centers show median. Individual letters show significantly different groups according to a post hoc Bonferroni-adjusted paired two-sided T-test. For more information on data plots see the statistics and reproducibility section. n represents independent biological samples. Scale bars represent 25 μm.
Figure 1
Figure 1. Presence and distribution of passage cells in Arabidopsis
a) Representative suberised endodermis and xylem pole pericycle visualized by a suberin (GPAT5) and xylem pole pericycle (XPP) reporter using plasma membrane-localised mCitrine-SYP122 or 3mCherry-SYP122 reporters, respectively. Asterisks mark passage cell. b) Scoring of lateral root primordia (white squares) and passage cells (black circles) from start of fully suberised zone (0 %) to hypocotyl junction (100%). 5 % binning of data from top panel (grey bars) and trend of passage cell density along the suberised zone (red line) c) Passage cell occurrence in Col-0 and mutants (ahp6-1 and log4). d) Suberisation in Col-0 and mutants (ahp6-1 and log4). en; Endodermis, nd; not detected, xpp; Xylem pole pericycle. Individual letters highlight significant differences between groups. Bar graphs represent mean ± SD, boxplot centers show median. In all graphs, dots represent individual data points. Notice that for all stacked graphs there are 3 measurements per root (unsuberised zone (white), patchy zone (grey) and suberised zone (yellow)). Individual letters show significantly different groups according to a post hoc Bonferroni-adjusted paired two-sided T-test. For more information on Data plots see the statistics and reproducibility section. For a) the image is representative of 5 independent lines. n represents independent biological samples. For individual P values see supplementary table 2. Scale bars: 25 μm.
Figure 2
Figure 2. Cytokinin and auxin regulate endodermal patterning and passage cell formation
a) Representative image depicting expression of cytokinin response marker TCSn (ER- GFP, green) or the suberin reporter GPAT5 (NLS-3mCherry, red) in fully suberised endodermis. b) Expression of auxin signaling reporter DR5v2 (NLS-tdTomato, blue), or DR5 (NLS-3mVenus, yellow) and suberin marker GPAT5 (3mCherry-SYP122, red) in fully suberised endodermis. Red dots represent individual data points. c-d) Occurrence of passage cells in seedlings germinated on indicated hormones c) or upon hormone incubation for 24 hours d) DMSO: mock treatment. Black dots represent individual data points. e) Optical sections through suberised endodermis. Suberin and xylem pole pericycle highlighted as in Fig. 1a. Blue lines highlight length of a single cell in xylem or phloem pole. f) Distribution of suberised endodermal cell length in xylem or phloem pole of plants germinated onmock (DMSO) or cytokinin plates. Numbers depict average lengths of xylem pole (red) or phloem pole (grey) endodermal cells. Asterisks indicate passage cells, arrowheads passage cell nuclei. ABA; Abscisic acid, BA; Benzyl adenine, DMSO; Dimethyl sulfoxide, En; Endodermis, NAA; Naphtalene acetic acid, nd; not detected, NLS; Nuclear localization signal, max; maximum projection, St; Stele. Boxplot centers show median. Individual letters show significantly different groups according to a post hoc Bonferroni-adjusted paired two-sided T-test. For a), b) and e) the image is representative of 8 independent lines. n represents independent biological samples. In c) ** Depicts significant difference (p<0,01) in a two-tailed T-test. Dots represent mean, error bars are SD, n = 25 independent biological replicas for each treatment. For more information on Data plots see the statistics and reproducibility section. For individual P values see supplementary table 2. Scale bars represent 25 μm.
Figure 3
Figure 3. Spatially restricted cytokinin repression and production underlie passage cell formation
a) Expression of pAHP6::AHP6-mVenus or pAHP6::AHP6-3mVenus from a previously published line in the root meristem. Figures represent longitudinal and transverse optical sections through the xylem pole of the root meristematic zone. b) pLOG3 and pLOG4 reporter activity (NLS-3GFP, green) in the root meristem. The used lines were previously published c) Occurrence of passage cells in ahp6-1 and lines complemented with AHP6 fused to a single or triple mVenus protein driven from AHP6 promoter. Dots represent individual data points. d) Length of xylem pole endodermal cells in suberised zone of ahp6-1 and lines complemented with AHP6 fusions. Dots represent outliers. e) Quantification of xylem defects in ahp6 mutant lines (for details, see Material and Methods). co; Cortex, en; Endodermis, ep; Epidermis, nd; Not detected, NLS; Nuclear Localization Signal. Red arrowheads indicate xylem pole endodermal cells. Boxplot centers show the median. Individual letters show significantly different groups according to a post hoc Bonferroni-adjusted paired two-sided T-test. For more information on data plots see the statistics and reproducibility section. For a) and b) the images are representative of previously published lines,. n represents independent biological samples. In d) n represents individual measurements across 16 independent biological samples. For individual P values see supplementary table 2. Scale bars represent 25 μm.
Figure 4
Figure 4. Passage cell-associated expression of PHO1;H3
a) PHO1;H3 reporter activity (NLS-3mVenus) in suberized and unsuberised zone of differentiated endodermis. Cell walls (grey) visualized by Calcofluor White and suberin (red) using Nile Red. b) PHO1;H3 expression in suberised zone of seedlings germinated on standard medium, 10 μM inorganic phosphate (low Pi), Zn- or Fe-deficient media. Suberised endodermis cells highlighted by GPAT5 expression. Yellow arrowheads indicate passage cell nuclei. c) Endodermal suberisation in Col-0, ahp6-1 and lines with repressed auxin signaling (through expression of shy2-2) in differentiated endodermis grown on standard medium, low Pi, Zn- or Fe-deficient media. Red dots represent individual data points. Notice that for all stacked graphs there are 3 measurements per root (unsuberised zone (white), patchy zone (grey) and suberised zone (yellow)). Co; Cortex, En; Endodermis, Ep; Epidermis, NLS; Nuclear Localization Signal, PA; Phloem Axis St; Stele. Bar graphs represent mean ± SD. Individual letters show significantly different groups according to a post hoc Bonferroni-adjusted paired two-sided T-test. For more information on Data plots see the statistics and reproducibility section. For a) and b) the image is representative of 12 independent lines. n represents independent biological samples. For individual P values see supplementary table 2. Scale bars represent 25 μm.
Figure 5
Figure 5. Overview of endodermis circumferential patterning and passage cell formation
In the meristem zone endodermal cell above the incipient xylem pole are exposed to stele-produced AHP6, inhibiting cytokinin signaling. This leads to prolonged division and thereby shorter endodermal cells than in the phloem pole. Another output should be an overall lower response to ABA through an as yet unknown mechanism. In the differentiation zone, we hypothesize that the lower ABA response in xylem pole endodermis stochastically causes some cells to be below-threshold for suberisation. The non-suberised cells maintain low cytokinin signaling by expression of A-type ARR elements and also serve as - possibly auxin-dependent - cytokinin producers through expression of LOG4. The status of ABA signaling is modulated by nutrient status and thus passage cells can be closed upon sufficiently high ABA. In the fully suberised zone, the non-suberised xylem-pole associated endodermal cells (passage cells) express specific genes whose domain can spread to the cortex/epidermis and serve to increase the area for uptake and/or to exchange signals with the environment (such as signals for biotic interactions). Nutrient stresses (Zn, Fe or Pi) would increase resistance of xylem pole-associated endodermis cells towards ABA and lead to an increase in non-suberised cells allowing for increased transport-related gene expression. ABA; Abscisic Acid, CK; Cytokinin, Co; Cortex, En; Endodermis, Ep; Epidermis, PC; Passage Cell.

Comment in

  • A cellular passage to the root interior.
    El-Showk S, Mähönen AP. El-Showk S, et al. Nature. 2018 Mar 22;555(7697):454-455. doi: 10.1038/d41586-018-02861-x. Nature. 2018. PMID: 29565372 No abstract available.

References

    1. Geldner N. The Endodermis. Annu Rev Plant Biol. 2013;64:531–558. - PubMed
    1. Barberon M, et al. Adaptation of Root Function by Nutrient-Induced Plasticity of Endodermal Differentiation. Cell. 2016;164:447–459. - PubMed
    1. Peterson CA, Enstone DE. Functions of passage cells in the endodermis and exodermis of roots. Physiol Plant. 1996;97:592–598.
    1. Kroemer H. Hypodermis und Endodermis der Angiospermenwurzel. 1903 Available at: https://www.schweizerbart.de/publications/detail/artno/144005900/Bibliot....
    1. Wu H, Jaeger M, Wang M, Li B, Zhang BG. Three-dimensional distribution of vessels, passage cells and lateral roots along the root axis of winter wheat (Triticum aestivum) Ann Bot. 2011;107:843–853. - PMC - PubMed

Publication types

MeSH terms