. 2018 Mar 22;555(7697):538-542.
doi: 10.1038/nature25981. Epub 2018 Mar 14.

The cis-regulatory dynamics of embryonic development at single-cell resolution

Affiliations

The cis-regulatory dynamics of embryonic development at single-cell resolution

Darren A Cusanovich et al. Nature. .

Abstract

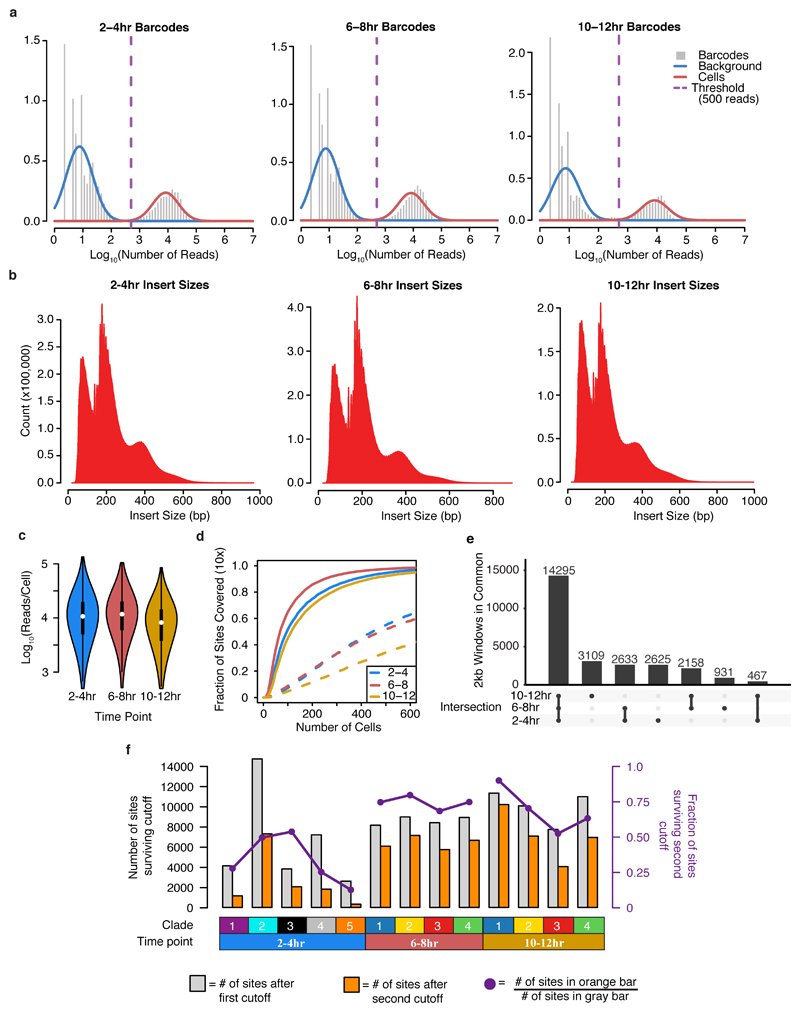
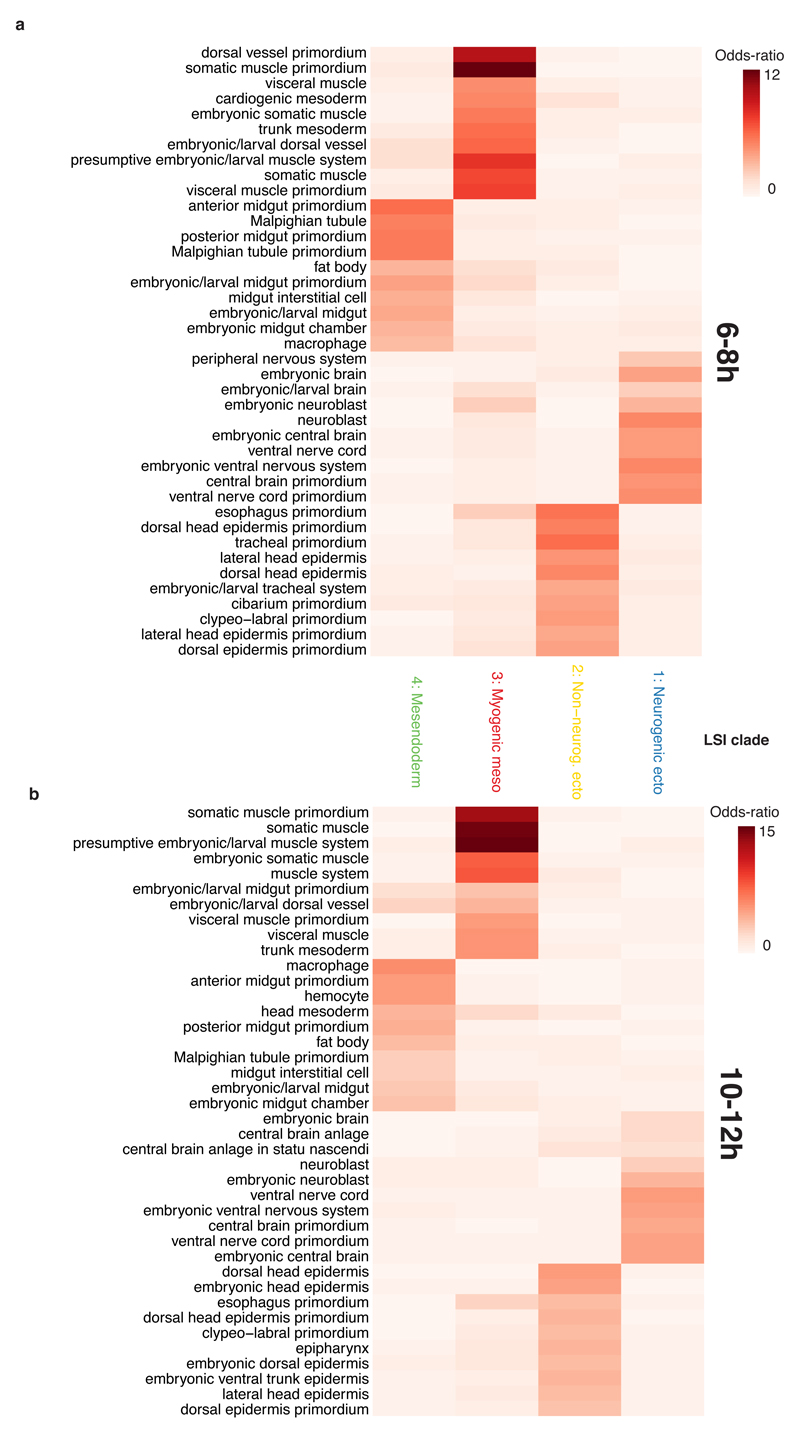
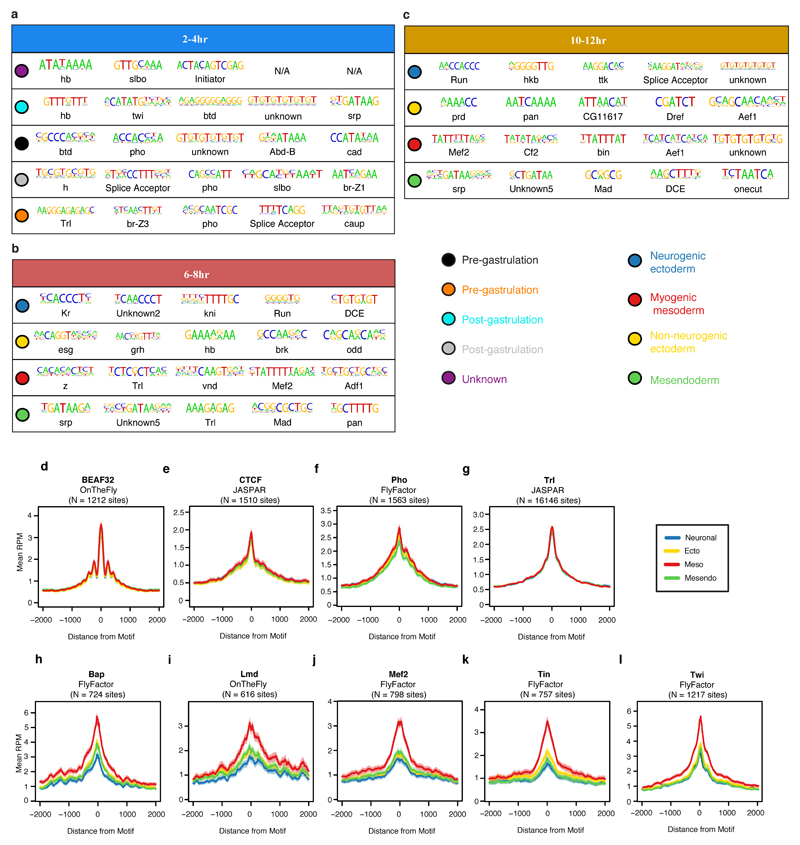
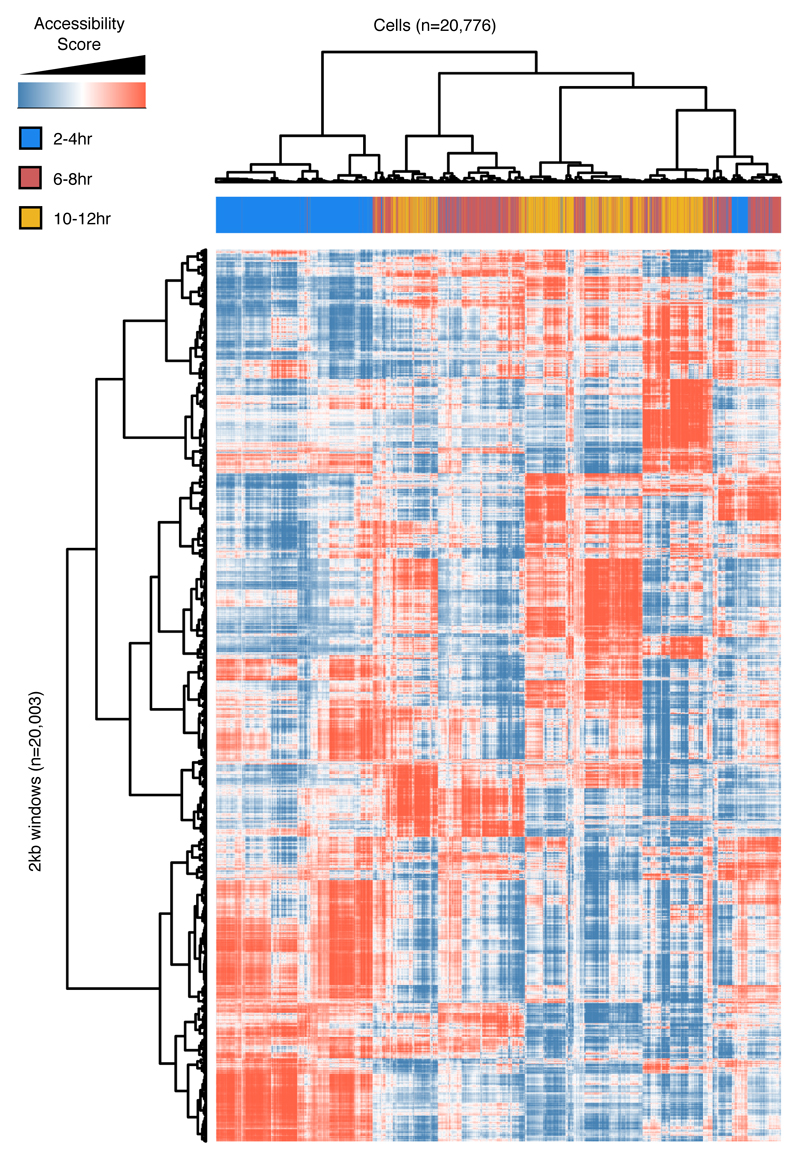
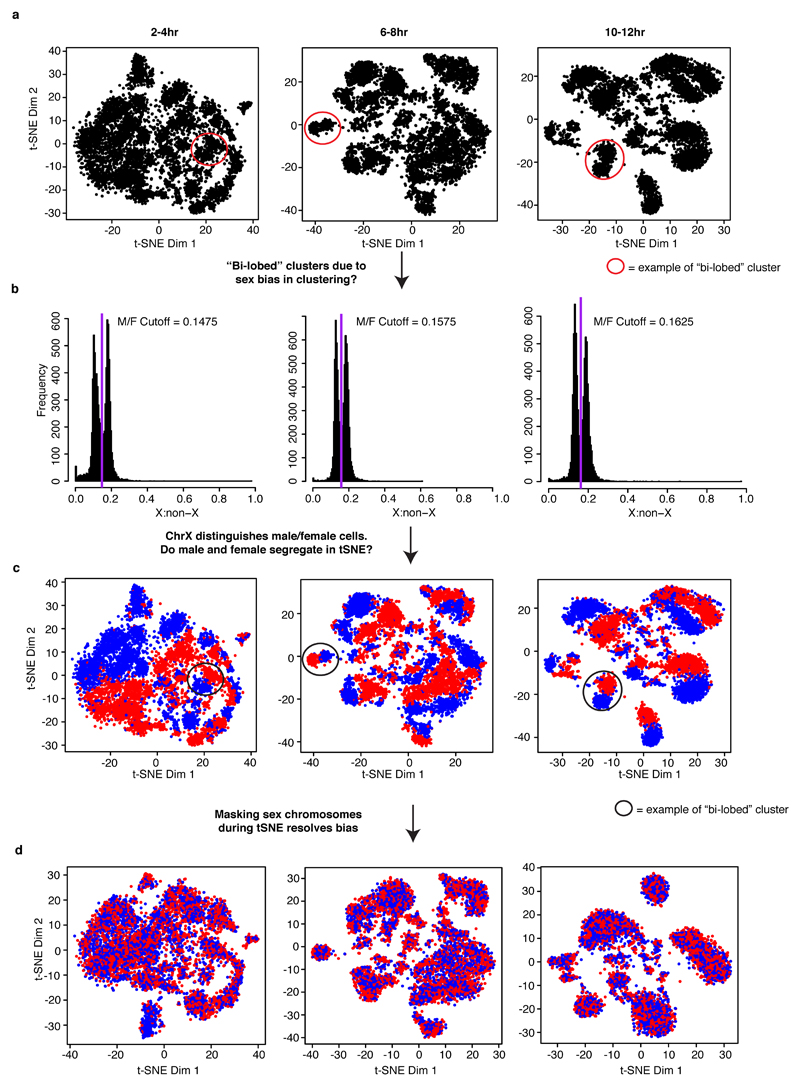
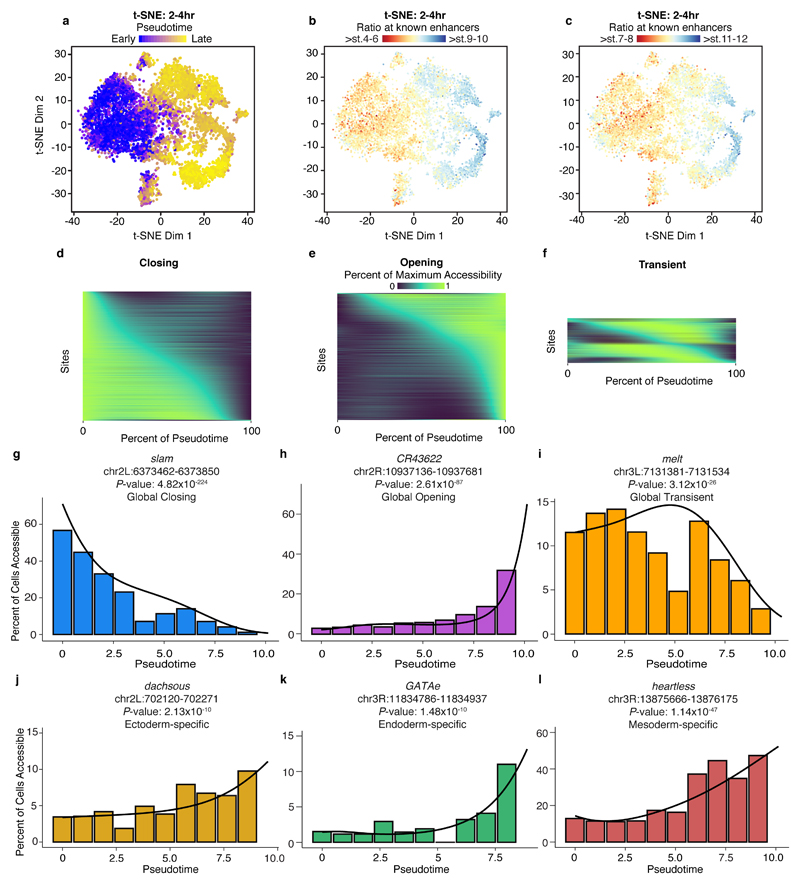
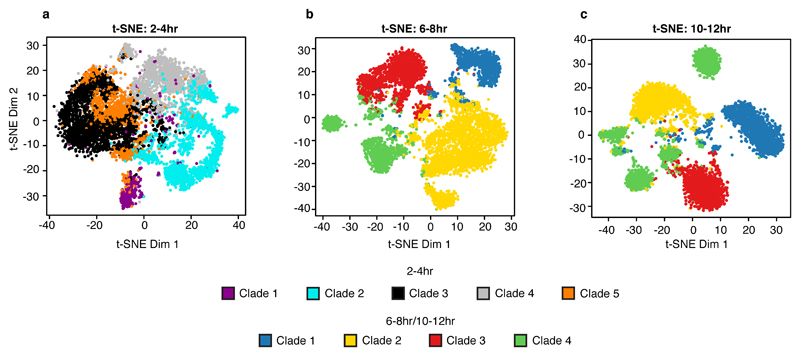
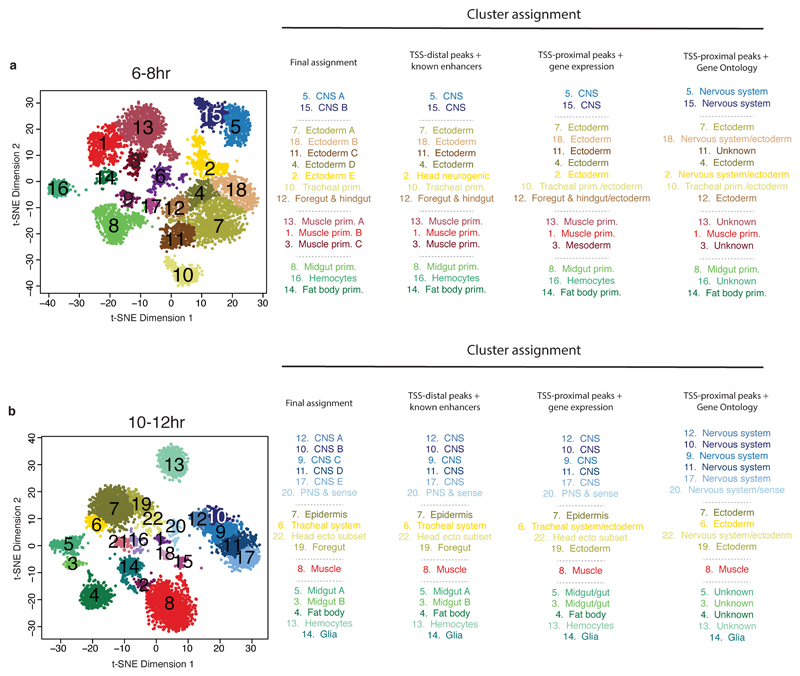
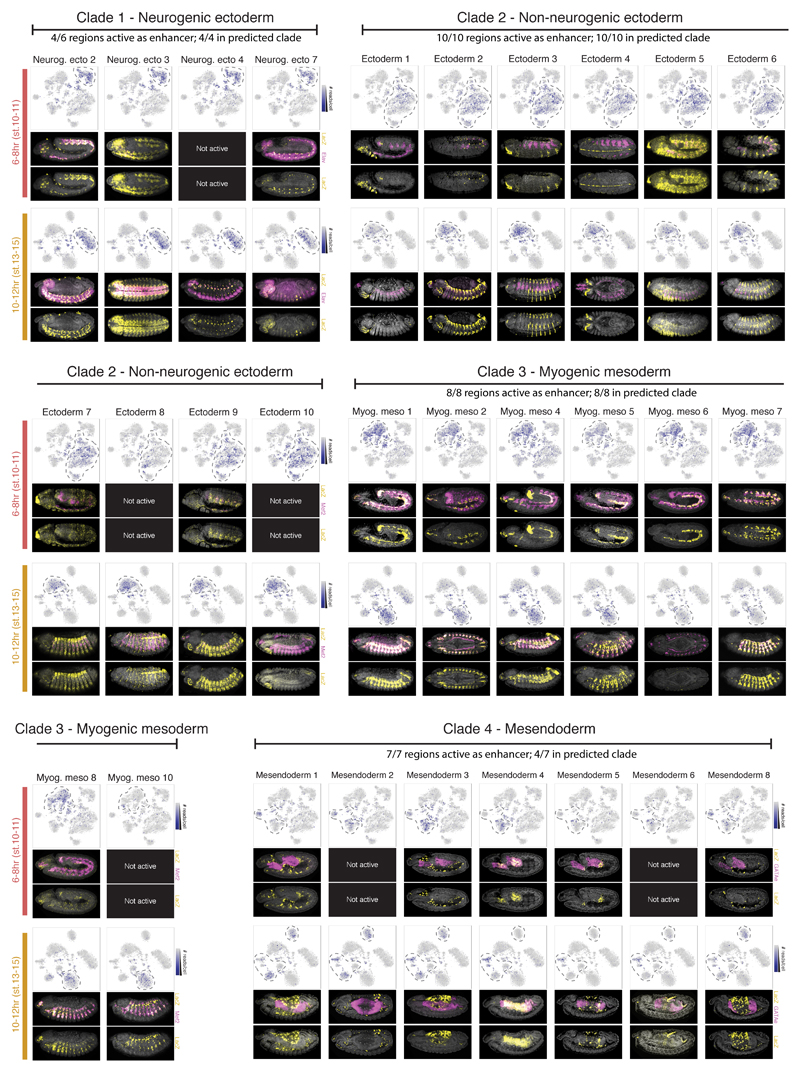
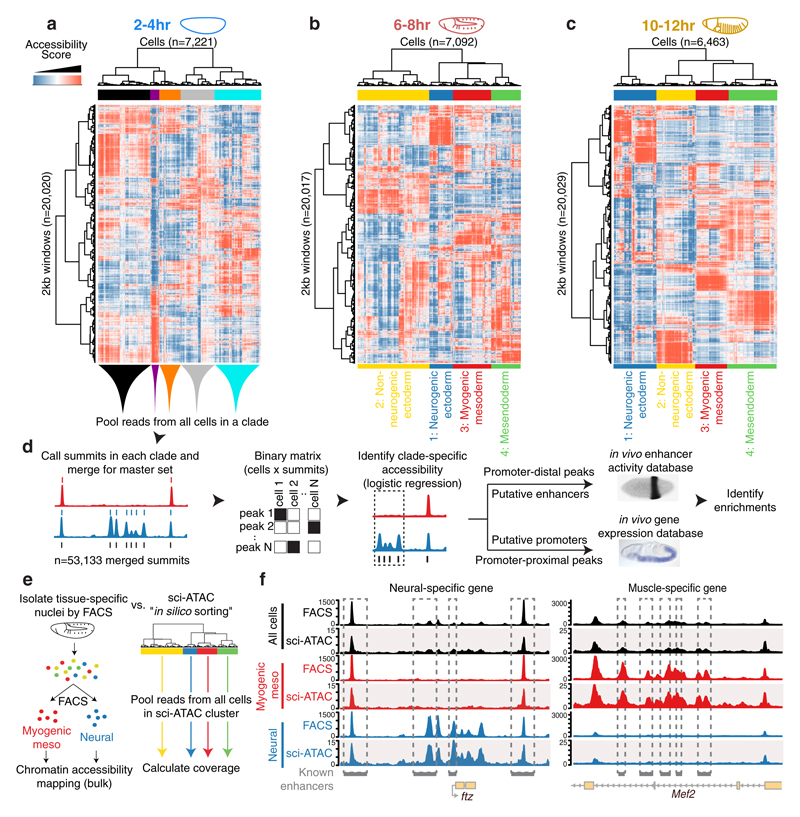
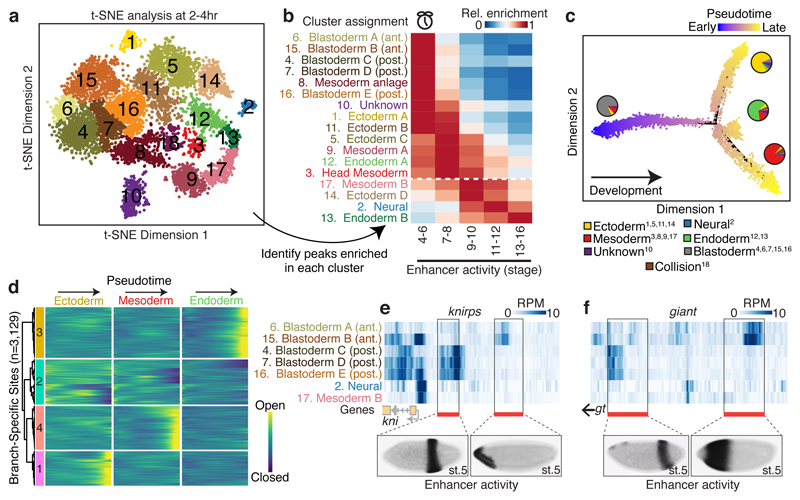
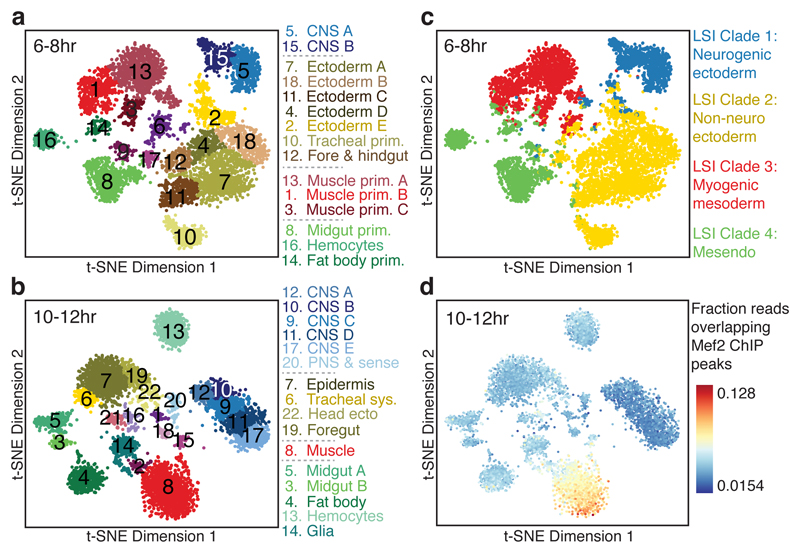
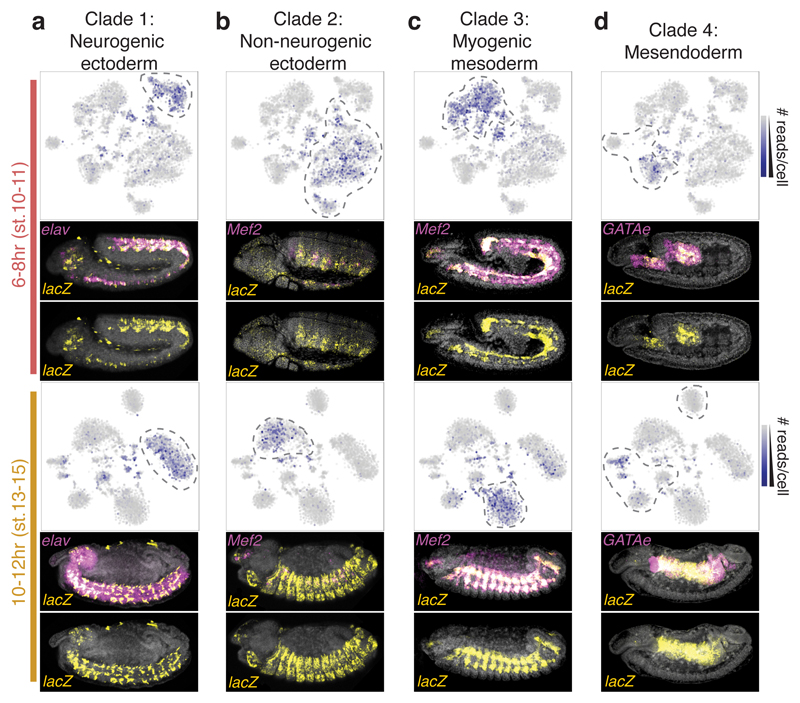
Understanding how gene regulatory networks control the progressive restriction of cell fates is a long-standing challenge. Recent advances in measuring gene expression in single cells are providing new insights into lineage commitment. However, the regulatory events underlying these changes remain unclear. Here we investigate the dynamics of chromatin regulatory landscapes during embryogenesis at single-cell resolution. Using single-cell combinatorial indexing assay for transposase accessible chromatin with sequencing (sci-ATAC-seq), we profiled chromatin accessibility in over 20,000 single nuclei from fixed Drosophila melanogaster embryos spanning three landmark embryonic stages: 2-4 h after egg laying (predominantly stage 5 blastoderm nuclei), when each embryo comprises around 6,000 multipotent cells; 6-8 h after egg laying (predominantly stage 10-11), to capture a midpoint in embryonic development when major lineages in the mesoderm and ectoderm are specified; and 10-12 h after egg laying (predominantly stage 13), when each of the embryo's more than 20,000 cells are undergoing terminal differentiation. Our results show that there is spatial heterogeneity in the accessibility of the regulatory genome before gastrulation, a feature that aligns with future cell fate, and that nuclei can be temporally ordered along developmental trajectories. During mid-embryogenesis, tissue granularity emerges such that individual cell types can be inferred by their chromatin accessibility while maintaining a signature of their germ layer of origin. Analysis of the data reveals overlapping usage of regulatory elements between cells of the endoderm and non-myogenic mesoderm, suggesting a common developmental program that is reminiscent of the mesendoderm lineage in other species. We identify 30,075 distal regulatory elements that exhibit tissue-specific accessibility. We validated the germ-layer specificity of a subset of these predicted enhancers in transgenic embryos, achieving an accuracy of 90%. Overall, our results demonstrate the power of shotgun single-cell profiling of embryos to resolve dynamic changes in the chromatin landscape during development, and to uncover the cis-regulatory programs of metazoan germ layers and cell types.


Figures

Extended Data Figure 1
Extended Data Figure 1. Summary of read distributions across the three sampled time points
a, Log10 counts of sci-ATAC-seq reads per barcode at each time point are bimodally distributed. A threshold of 500 reads was used to identify barcodes corresponding to valid cells vs. background. b, Fragment size distribution at each of time point is consistent with expected nucleosomal banding pattern of standard (bulk) ATAC-seq experiments. c, Violin plot for distribution of unique, mappable reads per cell at each time point (2-4hr N = 8,024, 6-8hr N = 7,880, 10-12hr N = 7,181) plotted on a Log10 scale. White point indicates median value, thick black line extends to 25th and 75th percentile, and thin black lines extend to most extreme values within 1.5 times the interquartile range of the median. The filled color width represents a density estimate of the distribution of cells along the y-axis. d, Fraction of previously characterized DHS covered in least 10 cells upon sampling a given number of cells (solid lines) as compared to random genomic windows (dashed lines). e, An UpSet plot shows the degree to which the top 20,000 windows overlap between the three time points. Each bar shows the number of sites included in a specific intersection and the “peg board” below shows which comparison in particular is included in that bar. f, Bar plot of the number of sites identified as significantly open in each clade (1% FDR; gray bar; “first cutoff”) and the number of sites specific to that clade (orange bar; “second cutoff”). Overlaid on the barplot (purple points) is the fraction of sites passing the first cutoff that also pass the second cutoff (count of orange bar / count of gray bar).
Extended Data Figure 2
Extended Data Figure 2. Enhancer enrichments for LSI clades at 6-8hrs and 10-12hrs
Enrichment for tissue-of-expression information for characterized distal enhancers overlapping clade-specific peaks at 6-8hrs (a) and 10-12hrs (b) of development. Each column represents a different clade and each row represents an annotation term assigned to tested enhancer elements. Shading indicates the odds-ratio for the intersection of enhancers sharing a given annotation with clade-specific accessible sites. Shown are all categories in the top 10 enrichment of any clade (enrichment scores capped at 15 for display) containing at least 35 known enhancer overlaps.
Extended Data Figure 3
Extended Data Figure 3. Relationship between transcription factor binding motifs and LSI clade-specific accessibility
a-c, SeqGL was run on LSI clade-specific distal peaks at each time point to identify enriched sequence motifs. The top 5 most enriched unique motifs for each clade are displayed. Colored circles indicate which clade is represented by each line. For the later time points (6-8hrs and 10-12hrs), blue is neurogenic ectoderm, yellow is non-neurogenic ectoderm, red is myogenic mesoderm, and green is mesendoderm. The results show an enrichment of motifs for factors associated with early development at 2-4hrs with more tissue-specific factor motifs (e.g. mesodermal factor Mef2 or neural regulator Tramtrack (ttk)) within germ-layer annotated clades at later stages of development. d-l, Using ChIP occupancy data (peaks) and transcription factor binding motifs compiled previously, we scanned for all TF motif instances under ChIP peaks from datasets spanning 6-8hrs of development using FIMO. Aggregate read counts in 4kb windows centered on each identified motif instance is shown for each of the four LSI clades at 6-8hrs. Green is endoderm, red is myogenic mesoderm, yellow is non-neurogenic ectoderm, and blue is neurogenic ectoderm. 95% confidence intervals are indicated by light shading of the same colors. d-g, Aggregate plots for four ubiquitous transcription factors (BEAF32, CTCF, Pho, and Trl) at 6-8hrs. h-l, Aggregate plots for mesodermal transcription factors (Bap, Lmd, Mef2, Tin, Twi) at 6-8hrs.
Extended Data Figure 4
Extended Data Figure 4. Similarities and differences in accessibility across all three time points
In addition to processing data from each time point independently, data from all cells can be analyzed together (with the caveat that time point and batch are confounded). Here, we show binarized, LSI-transformed, and clustered count data for 2 kb windows across the genome for cells from all three time points (blue = 2-4hrs, red = 6-8hrs, orange = 10-12hrs) processed together. The predominant pattern is one in which 2-4hr cells (blue) cluster separately from 6-8 hr (red) and 10-12 hr (yellow) cells. 6-8hrs and 10-12hrs cells are intermingled, clustering first (roughly) by germ layer-of-origin.
Extended Data Figure 5
Extended Data Figure 5. Sex of individual cells identified by ratio of X:autosomal reads
Embryos at all stages consist of a mixture of male and female embryos (males: XY, females: XX). a, t-SNE plots of three time points from analysis in which sex chromosome sites were not excluded. Many clusters exhibited a “bi-lobed” structure, where each individual cluster was made up of two “mirrored” lobes (red circles identify one example of bi-lobed clusters from each time point). This was most apparent at the 10-12hr time point. b, Histogram of the ratio of chromosome X to autosomal reads in individual cells. To explore whether this “bi-lobed” structure was a function of sex biases in clustering, we attempted to sex individual cells. The ratio of X:autosomal reads shows a bimodal distribution as expected in a system with heterogametic (XY) males and no evidence for imprinting. The purple line marks the local minimum between the two peaks of the histograms. c, Initial t-SNE clusters colored by sex assignment. Red indicates female cells and blue indicates male cells. Coloring individual cells by their sex reveals that the “bi-lobed” architecture is largely driven by sex biases in clustering. d, After removing X chromosomal reads, data was re-clustered and individual cells recolored by the ratio of X:autosomal reads (red: female, blue: male). The resulting clusters showed an approximately equal number of male and female cells except for clusters 1 and 10 at the 2-4hr time point.
Extended Data Figure 6
Extended Data Figure 6. Temporal ordering of cells at 2-4hrs using Monocle
a-c, t-SNE maps of cells at 2-4hrs with the color representing either the Monocle-inferred pseudotime of each cell (a) or the ratio of reads per cell at enhancers active at different stages of development (b,c). Read counts within temporally characterized enhancers provide insight into the specific stage of development from which a cell is derived. Plotted here are ratios of counts in earlier vs. later active enhancers showing a rough temporal progression from left to right that is also inferred by Monocle. d-f, Heatmaps of sites significantly associated with pseudotime (based on a likelihood ratio test). For each site, a spline was fit to the data across pseudotime. Sites (rows) were ordered for the heatmaps based on the pseudotime at which they first reached half the maximum predicted accessibility from the fit curve. The colors indicate the spline predicted accessibility across pseudotime scaled as fraction of the maximum accessibility for that site. g-i, Single locus plots of the most significant closing, opening, and transient sites. Histogram of percent of cells with the specified site accessible in 10 bins across pseudotime, within the 2-4hr time-point. Curve is from spline fit for accessibility in cells through pseudotime. j-l, As in (g-i), examples of sites with lineage-specific association with pseudotime. One example of a branch-specific opening site for each germ layer: ectoderm (j), endoderm (k), and mesoderm (l). In (g-i), P-values were calculated for likelihood ratio tests evaluating the effect of progress through pseudotime on accessibility (N = 100 bins of cells). See Methods for more details. Note that the branch point in pseudotime occurs at approximately 5.6 on the x-axis of these figures.
Extended Data Figure 7
Extended Data Figure 7. Library complexity and fraction of X chromosome reads highlights clusters of ‘collisions’ between cells from different tissues
Density plots of the estimated library complexity (using the same equation implemented in Picard; left panels) and the representation of chromosome X reads (right panels) in individual clusters. While most of the clusters defined by t-SNE are readily biologically interpretable, a small number of clusters (containing relatively few cells) were not easily characterized and are marked by an increase in both estimated library complexity and an unusual distribution of X-chromosome to autosomal reads. These clusters likely correspond to be clusters of “collisions” - cases in which two or more distinct cells share the same barcode as a consequence of the combinatorial indexing protocol. In each panel, the black line is the global distribution for all cells in that time point. The gray lines denote the results of randomly sampling an equal number of cells to the cluster in question. The colored line marks the distribution for the cluster being interrogated. a, c, e, Most clusters show relatively similar distributions of library complexity (left) and a characteristic, bimodal distribution among cells in the ratio of X chromosome to autosomal reads (reflecting our use of a pool of male (XY) and female (XX) embryos, right). b, d, Putative collision clusters show a clear increase in the average library complexity (left) and a unimodal rather than bimodal distribution of X:autosomal reads (right). f, These features are not universally diagnostic (e.g. cluster 10 at 2-4hrs does seem to show a strong, bona fide sex bias), but the combination of features is strongly predictive of clusters containing few cells and conflicting biological annotations based on gene/enhancer overlaps.
Extended Data Figure 8
Extended Data Figure 8. LSI defined clades and t-SNE clusters show strong correspondence
Shown are t-SNE maps of cells from each of the three time points colored by the LSI clade to which they were previously assigned (Fig. 1a-c). For the post-gastrulation time points, green is endoderm, red is myogenic mesoderm, yellow is non-neurogenic ectoderm, and blue is neurogenic ectoderm. There is strong correspondence between the germ layer level clade annotations from the LSI analysis with tissue-specific t-SNE clusters, particularly at the post-gastrulation time points (6-8hrs and 10-12hrs).
Extended Data Figure 9
Extended Data Figure 9. Cell cluster assignment is similar using either enhancer or gene tissue activity
For each time point, cell clusters were annotated based on first dividing peaks into TSS-distal peaks (putative enhancers) and TSS-proximal (gene promoters). Each cell cluster was then annotated separately by overlaps between cluster-enriched peaks and (1) enhancers, comparing the TSS-distal elements to the tissue/cell type activity of characterized enhancers, (2) genes, comparing TSS-proximal elements to the tissue expression of genes, and (3) Gene Ontology (GO) information (Methods). Shown are the cluster assignments based on enhancer, gene expression, or Gene Ontology annotation alone. The final assignment, used within the main figures, combines all enrichment information to produce more robust assignments.
Extended Data Figure 10
Extended Data Figure 10. sci-ATAC-seq can predict tissue-specific enhancer usage during development
All candidate clade-specific enhancers tested in transgenic reporters. For each time point, upper panels show single cells visualized by t-SNE with the intensity of blue representing the number of sci-ATAC-seq reads obtained from each tested element in each individual cell. Cell clusters bounded by dashed lines correspond to the predicted clade of activity. Lower panels show representative embryos for each time point with nuclei stained with DAPI (grey), in situ hybridization for the reporter gene driven by the enhancer (yellow), and a tissue marker (magenta). Annotation of each element’s activity involved observations across hundreds of embryos.
Figure 1
Figure 1. Single cell profiling of chromatin accessibility across Drosophila embryogenesis
a-c, Heatmaps of binarized, LSI-transformed, clustered read counts for single cells (columns) in 2 kb windows across the genome (rows) at 2-4hr (a), 4-6hr (b) and 10-12hr (c) after egg laying. Major clades are assignable to germ layers at post-gastrulation time points (b,c). d, Approach to annotate clades by intersecting clade-specific peaks of chromatin accessibility with enhancer activity and gene expression. In situ image of enhancer activity (black stain) from ref ; RNA in situ (blue stain) from the Berkeley Drosophila Genome Project,,. e, Comparing FACS-DNase-seq and sci-ATAC-seq “in silico sorting.” Nuclei from myogenic mesoderm and neurons were isolated from 6-8hr embryos using antibodies against tissue-specific regulatory proteins Mef2 (myogenic mesoderm) and Elav (neurons) followed by FACS and DNase-seq. In silico sorts from sci-ATAC-seq were built by pooling reads from all cells within each LSI-defined clade. f, Library-size normalized coverage tracks from FACS-DNase-seq (top in each color) and sci-ATAC-seq in silico sorts (bottom in each color) for whole embryo (black)), mesoderm (red)), and neuronal (blue) at 6-8hrs. Shown are ftz (neuronal; left) and Mef2 (mesodermal; right) loci. Known enhancers for each tissue are indicated.
Figure 2
Figure 2. Temporal dynamics and spatial heterogeneity in chromatin accessibility in the early embryo
a, t-SNE analysis of cells at 2-4hrs. Clusters were defined by a density peak clustering algorithm (Methods), and annotated based on overlaps between cluster-enriched peaks and known tissue-specific enhancers/genes. b, Relative enrichment of enhancers active at different developmental stages in each cluster. Clusters below the white dashed line are likely derived from embryos outside of the 2-4hr window, consequent to female ‘holding’ of older embryos. c, Pseudotime ordering of cells along a developmental trajectory. Cells were ordered in 3 dimensions (only 2 shown) with DDRTree. Point colors correspond to cells’ progression along the trajectory. Pie charts indicate relative frequencies of germ layer assignments (Fig. 2a) for cells in each branch. Superscript numbers in key indicate which clusters from (a) were included in each category. d, Heatmap of smoothed accessibility curves fit to sites (rows) for 100 bins of cells progressing through pseudotime (columns). Sites were clustered into 4 groups based on their temporal dynamics. Only sites classified as branch-specific are shown. e,f, Heatmaps of library size normalized read counts in the vicinity of the gap genes knirps (e) and giant (f). In each case, one characterized enhancer is known to drive anterior expression and another posterior expression in blastoderm embryos (stage 5). In situ images of enhancer activity obtained from ref .
Figure 3
Figure 3. Single cells are readily assigned to tissues and cell types based on chromatin accessibility
a,b, Clustering of sci-ATAC-seq data from the 6-8hr (a) and 10-12hr (b) time points after t-SNE dimensionality reduction. Clusters were annotated based on overlaps between cluster-enriched peaks and enhancers/genes with known tissue-specific activity. Three 6-8hr (6, 9, 17) and six 10-12hr (1, 2, 15, 16, 18, 21) clusters likely comprise multi-cell ‘collisions’ based on library complexity and the distribution of reads mapping to the X chromosome (Extended Data Fig. 7). c, 6-8 hr t-SNE shown in (a) but colored by original germ layer assignment. d, 10-12hr t-SNE shown in (b) but colored by the fraction of reads falling in Mef2 ChIP-seq peaks.
Figure 4
Figure 4. Prediction of tissue-specific enhancer activity using sci-ATAC-seq
a-d, Examples of candidate LSI clade-specific enhancers tested in transgenic reporters. For each time point, upper panels show the t-SNE map with the intensity of blue representing the number of sci-ATAC-seq reads obtained from each tested element. Cell clusters bounded by dashed lines correspond to the predicted clade of activity. Lower panels show transgenic embryos with nuclei stained with DAPI (grey), in situ hybridization for the lacZ reporter gene driven by the enhancer (yellow), and a tissue marker (magenta). All embryo images are lateral views, with anterior left and dorsal up, and are representative of observations across hundreds of embryos. The activity, and an overview, of all tested enhancers is shown in Extended Data Fig. 10.

References

    1. Cusanovich DA, et al. Multiplex single cell profiling of chromatin accessibility by combinatorial cellular indexing. Science. 2015;348:910–914. doi: 10.1126/science.aab1601. - DOI - PMC - PubMed
    1. Maduro MF, Meneghini MD, Bowerman B, Broitman-Maduro G, Rothman JH. Restriction of mesendoderm to a single blastomere by the combined action of SKN-1 and a GSK-3beta homolog is mediated by MED-1 and -2 in C. elegans. Mol Cell. 2001;7:475–485. - PubMed
    1. Sethi AJ, Wikramanayake RM, Angerer RC, Range RC, Angerer LM. Sequential signaling crosstalk regulates endomesoderm segregation in sea urchin embryos. Science. 2012;335:590–593. doi: 10.1126/science.1212867. - DOI - PMC - PubMed
    1. Rodaway A, Patient R. Mesendoderm. an ancient germ layer? Cell. 2001;105:169–172. - PubMed
    1. Thomas S, et al. Dynamic reprogramming of chromatin accessibility during Drosophila embryo development. Genome Biol. 2011;12:R43. doi: 10.1186/gb-2011-12-5-r43. - DOI - PMC - PubMed

Publication types

MeSH terms