. 2018 Mar 22;555(7697):469-474.
doi: 10.1038/nature26000. Epub 2018 Mar 14.

DNA methylation-based classification of central nervous system tumours

David Capper  1   2   3   4 David T W Jones  5   6 Martin Sill  5   6   7 Volker Hovestadt  8 Daniel Schrimpf  1   2 Dominik Sturm  5   6   9 Christian Koelsche  1   2 Felix Sahm  1   2 Lukas Chavez  5   6 David E Reuss  1   2 Annekathrin Kratz  1   2 Annika K Wefers  1   2 Kristin Huang  1   2 Kristian W Pajtler  5   6   9 Leonille Schweizer  1   3 Damian Stichel  1   2 Adriana Olar  10   11   12 Nils W Engel  13   14 Kerstin Lindenberg  2 Patrick N Harter  15   16 Anne K Braczynski  15   16 Karl H Plate  15   16 Hildegard Dohmen  17 Boyan K Garvalov  17 Roland Coras  18 Annett Hölsken  18 Ekkehard Hewer  19 Melanie Bewerunge-Hudler  20 Matthias Schick  20 Roger Fischer  20 Rudi Beschorner  21 Jens Schittenhelm  21 Ori Staszewski  22 Khalida Wani  23 Pascale Varlet  24 Melanie Pages  24 Petra Temming  25 Dietmar Lohmann  26 Florian Selt  5   9   27 Hendrik Witt  5   6   9 Till Milde  5   9   27 Olaf Witt  5   9   27 Eleonora Aronica  28   29   30 Felice Giangaspero  31   32 Elisabeth Rushing  33 Wolfram Scheurlen  34 Christoph Geisenberger  35   36 Fausto J Rodriguez  37 Albert Becker  38 Matthias Preusser  39 Christine Haberler  40 Rolf Bjerkvig  41   42 Jane Cryan  43 Michael Farrell  43 Martina Deckert  44 Jürgen Hench  45 Stephan Frank  45 Jonathan Serrano  46 Kasthuri Kannan  46 Aristotelis Tsirigos  46 Wolfgang Brück  47 Silvia Hofer  48 Stefanie Brehmer  49 Marcel Seiz-Rosenhagen  49 Daniel Hänggi  49 Volkmar Hans  50   51 Stephanie Rozsnoki  52 Jordan R Hansford  53   54   55 Patricia Kohlhof  56 Bjarne W Kristensen  57 Matt Lechner  58 Beatriz Lopes  59 Christian Mawrin  60 Ralf Ketter  61 Andreas Kulozik  5   9 Ziad Khatib  62 Frank Heppner  3   63   64 Arend Koch  3 Anne Jouvet  65 Catherine Keohane  66 Helmut Mühleisen  67 Wolf Mueller  68 Ute Pohl  69 Marco Prinz  22   70 Axel Benner  7 Marc Zapatka  8 Nicholas G Gottardo  71   72   73 Pablo Hernáiz Driever  74 Christof M Kramm  75 Hermann L Müller  76 Stefan Rutkowski  77 Katja von Hoff  74   77 Michael C Frühwald  78 Astrid Gnekow  78 Gudrun Fleischhack  25 Stephan Tippelt  25 Gabriele Calaminus  79 Camelia-Maria Monoranu  80 Arie Perry  81 Chris Jones  82 Thomas S Jacques  83 Bernhard Radlwimmer  8 Marco Gessi  38 Torsten Pietsch  38 Johannes Schramm  84 Gabriele Schackert  85 Manfred Westphal  86 Guido Reifenberger  87   88 Pieter Wesseling  89   90 Michael Weller  91 Vincent Peter Collins  92 Ingmar Blümcke  18 Martin Bendszus  93 Jürgen Debus  94 Annie Huang  95 Nada Jabado  96 Paul A Northcott  97 Werner Paulus  52 Amar Gajjar  98 Giles W Robinson  98 Michael D Taylor  99 Zane Jaunmuktane  100   101   102 Marina Ryzhova  103 Michael Platten  104 Andreas Unterberg  35 Wolfgang Wick  105 Matthias A Karajannis  106 Michel Mittelbronn  15   16   107   108   109   110 Till Acker  17 Christian Hartmann  111 Kenneth Aldape  112 Ulrich Schüller  14   113   114   115 Rolf Buslei  18   116 Peter Lichter  8 Marcel Kool  5   6 Christel Herold-Mende  35 David W Ellison  117 Martin Hasselblatt  52 Matija Snuderl  118 Sebastian Brandner  100   102 Andrey Korshunov  1   2 Andreas von Deimling  1   2 Stefan M Pfister  5   6   9
Affiliations

DNA methylation-based classification of central nervous system tumours

David Capper et al. Nature. .

Abstract

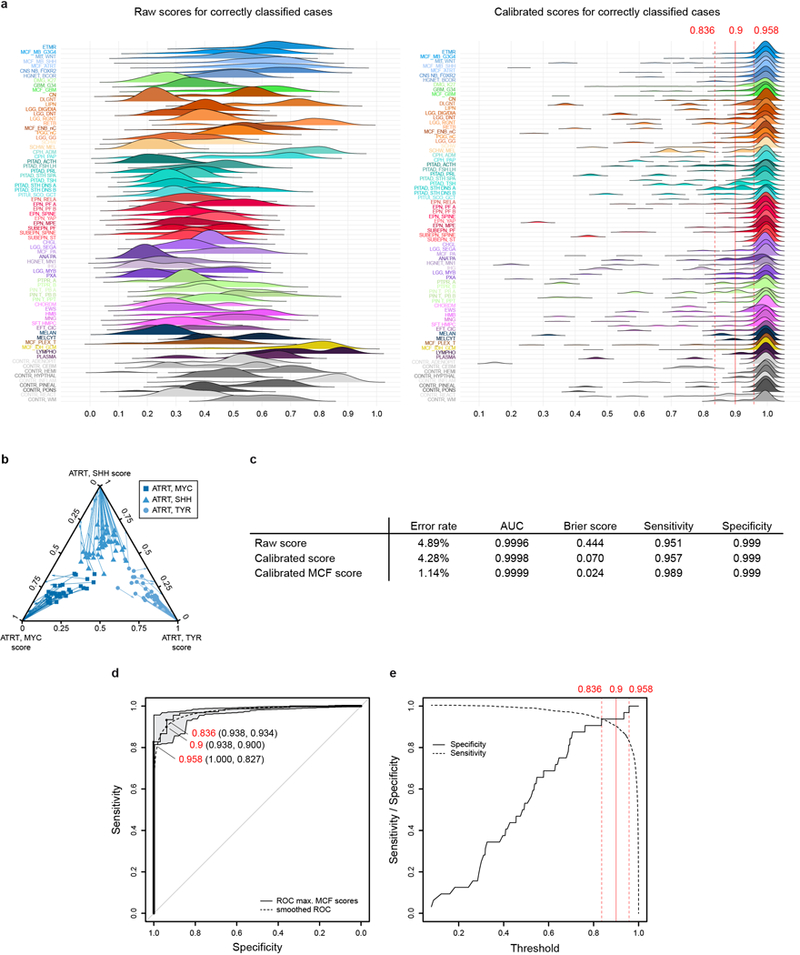
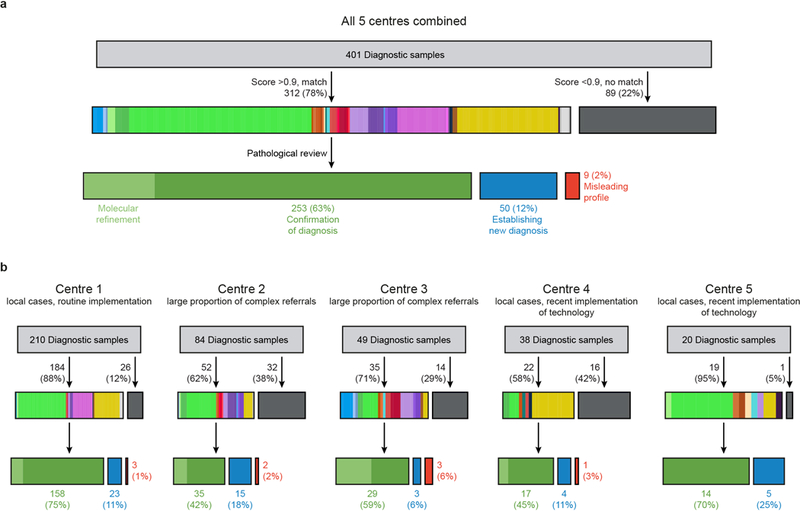
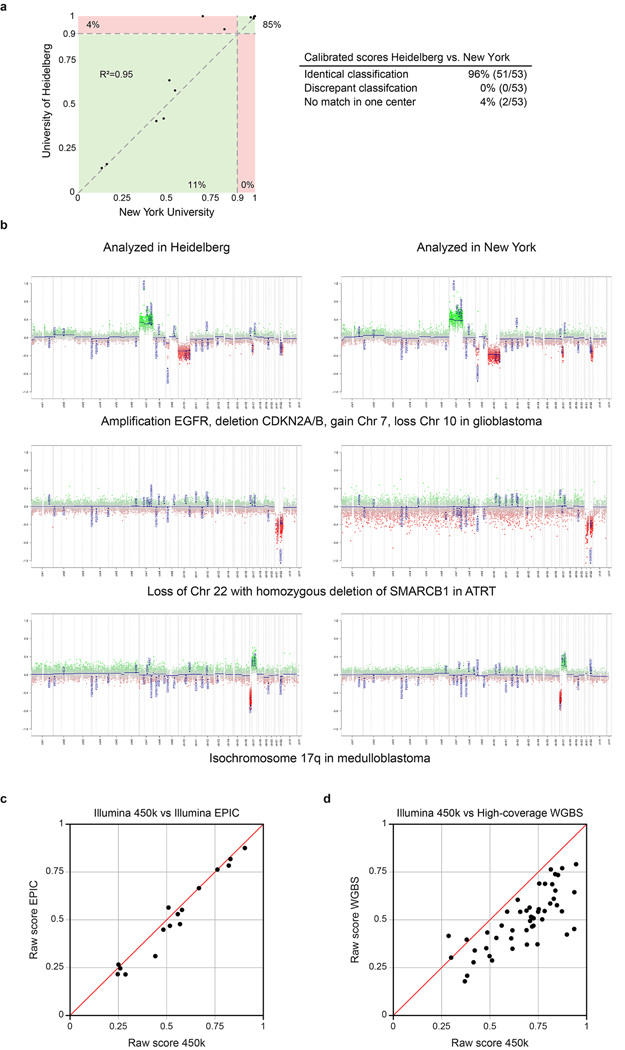
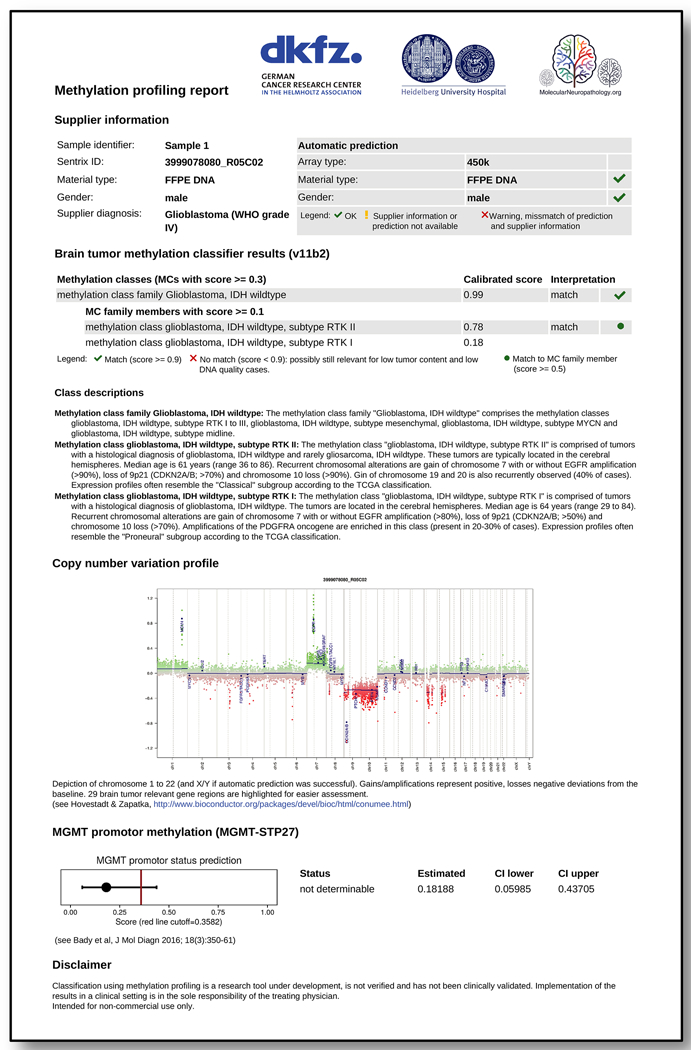
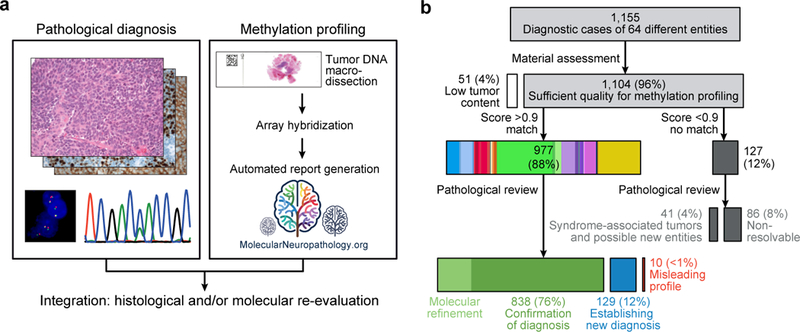
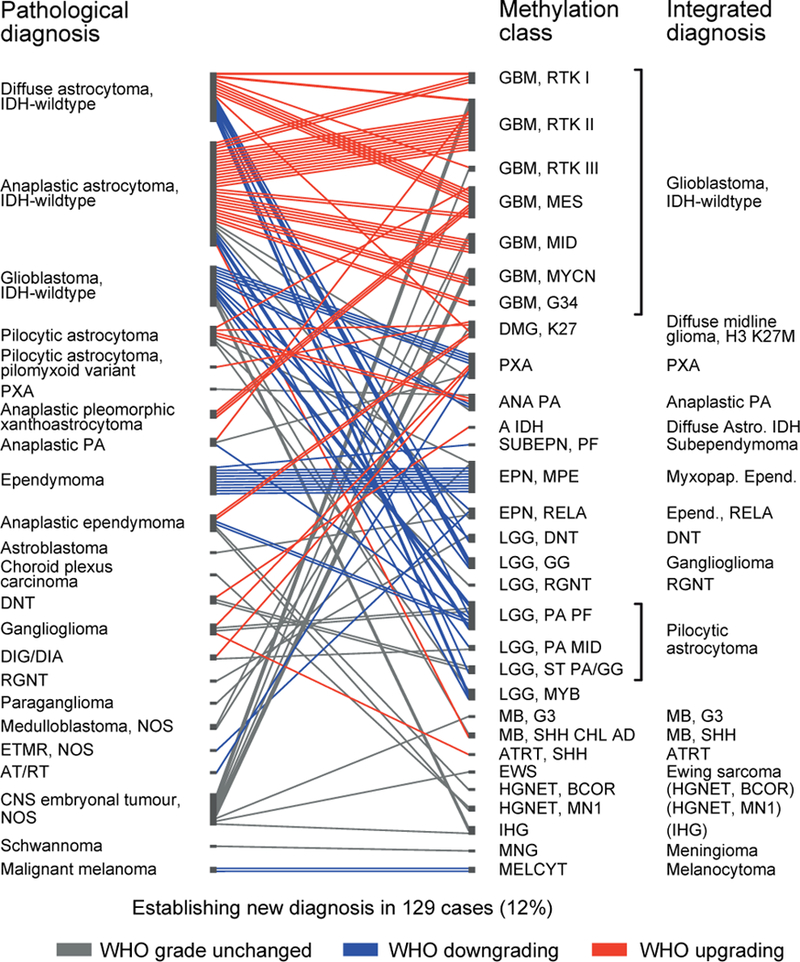
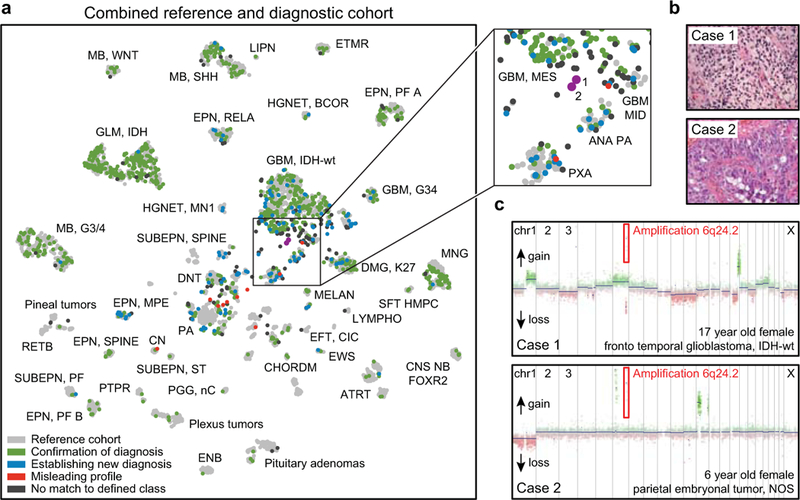
Accurate pathological diagnosis is crucial for optimal management of patients with cancer. For the approximately 100 known tumour types of the central nervous system, standardization of the diagnostic process has been shown to be particularly challenging-with substantial inter-observer variability in the histopathological diagnosis of many tumour types. Here we present a comprehensive approach for the DNA methylation-based classification of central nervous system tumours across all entities and age groups, and demonstrate its application in a routine diagnostic setting. We show that the availability of this method may have a substantial impact on diagnostic precision compared to standard methods, resulting in a change of diagnosis in up to 12% of prospective cases. For broader accessibility, we have designed a free online classifier tool, the use of which does not require any additional onsite data processing. Our results provide a blueprint for the generation of machine-learning-based tumour classifiers across other cancer entities, with the potential to fundamentally transform tumour pathology.


Figures

Extended Data Figure 1 |
Extended Data Figure 1 |. Unsupervised clustering of the DNA methylation-based reference cohort.
a, Heatmap showing the pairwise Pearson correlation (lower left) of the 32,000 most variably methylated CpG probes of all 2,801 biologically independent samples of the reference cohort. A detailed view on closely related ependymal classes (upper right) and the three subclasses identified in ATRT tumours (lower right) indicates higher correlation within classes. The colour code and abbreviations are identical to main Figure 1a. b, Barplot showing eigenvalue frequencies of a principal component analysis (PCA) using the same 32,000 most variably methylated CpG probes of all 2,801 biologically independent samples as in (a). The number of non-trivial components were determined by comparing eigenvalues to the maximum eigenvalue of a PCA using randomized beta-values (shuffling of sample labels per probe). c, X and Y coordinates of the first five of a total of 500 iterations of t-SNE dimensionality reduction generated by random downsampling to 90% of the 2,801 biologically independent samples to assess clustering stability. Axis positions of individual cases are connected by a line coloured according to the colour code of Figure 1a. The depiction illustrates the close proximity of cases of the same class across iterations, indicative of a high stability independent of the exact composition of the reference cohort. d, Pairwise correlation of X and Y coordinates between 2,801 biologically independent samples over all iterations of the downsampling analysis demonstrates a very high correlation within classes (average correlation 0.982), indicating a high stability of the t-SNE analysis.
Extended Data Figure 2 |
Extended Data Figure 2 |. Unsupervised clustering is not biased by a range of possible confounding factors.
a, t-SNE representations of the 2,801 biologically independent samples constituting the reference cohort as shown in Figure 1b overlaid with potentially confounding factors (b-f). b, Distribution of patient sex among the classes illustrates equal or near equal distribution of many classes, but also an expected enrichment for one sex in some classes (e.g. female in meningioma or CNS high-grade neuroepithelial tumour with MN1 alteration). c, Patient age illustrates the expected age distribution of many tumour classes. d-f, The slightly uneven distribution of type of material (e.g. pilocytic astrocytoma or meningioma) (d), array preparation date (e), and tissue source (f) are related to the specifics of assembling the reference cohort and do not indicate an apparent confounding effect on the unsupervised clustering.
Extended Data Figure 3 |
Extended Data Figure 3 |. Estimation of tumour purity and relation to TCGA pan-glioma methylation classes.
a, A Random Forest model was trained to predict ABSOLUTE tumour purity estimates using the TCGA pan-glioma dataset (795 biologically independent samples). The plot shows ABSOLUTE purity estimates and out-of-bag Random Forest tumour purity predictions (i.e. using only RF trees for which the respective sample was not involved in the training). The estimated mean squared error is 0.015, indicating that this model is able to yield reasonable predictions of tumour purity from methylation data. b, Bar plot showing the distribution of Random Forest predicted purity in the reference dataset (2,801 biologically independent samples). Purity estimates have been transformed into five categories indicated by different shades of blue. The exact case-by-case values are given in Supplementary Table 2. The median estimated purity in the reference cohort is 66% (range 42% to 87%) and 78% of samples have an estimated purity of at least 60%. c, t-SNE representation of the reference cohort (2,801 biologically independent samples) overlayed with Random Forest predicted purity categories. Methylation classes are generally composed of mixed tumour purity categories. Tumour purity shows some association with the WHO grade (WHO I median tumour purity 60%, range 39–77%; WHO II median 66%, range 43–80%; WHO III median 68% range 54–84%; WHO IV median 69% range 49–87%). A further association of tumour purity with the composition of classes in the unsupervised t-SNE analysis was not evident. d, t-SNE representation of the reference cohort (2,801 biologically independent samples) overlayed with predicted TCGA pan-glioma DNA methylation classes according to Ceccarelli et al. 2016. Pan-glioma methylation classes were predicted by training a Random Forest (RF) on the Ceccarelli et al. 2016 dataset including methylation data of 418 low grade glioma and 377 glioblastoma samples acquired using the Illumina 450k and 27k platforms. The RF was trained using the 1,300 CpG signature as described by the authors and using the default settings of the RF algorithm implemented in the R package randomForest. Pan-glioma class prediction was only performed for subsets of mostly adult astrocytomas, oligodendrogliomas and glioblastomas (magnified areas) included in the Ceccarelli et al. 2016 data set. LGm1, LGm2 and LGm3 show a high overlap with the methylation classes A IDH HG, A IDH and O IDH, respectively. LGm4 shows highest overlap with methylation class GBM RTK II. LGm5 shows highest overlap with methylation classes GBM MES and GBM RTK I. LGm6 show highest overlap with DMG K27, GBM MID and GBM MYCN.
Extended Data Figure 4 |
Extended Data Figure 4 |. Development of the Random Forest classifier.
a, The RF training consists of four steps. First, a basic filtering for probes that are not included on the EPIC array, probes located on the X and Y- chromosomes, probes affected by SNPs, and probes not mapping uniquely to the genome is performed. In a second step, the probe-wise batch effects between samples from FFPE and frozen material are estimated and adjusted by a linear model approach. In a third step, feature selection is performed by training a RF using all probes and selecting the 10,000 probes with highest variable importance measure. In a last step, the final RF is trained using only the 10,000 selected probes. The validation of the RF classifier involves a three-fold nested cross-validation (CV). In the outer loop of the CV the complete RF training procedure described before is applied to the training data and the resulting RF is used to predict the test data to generate RF scores. In the inner loop of the CV a three-fold CV is applied to training data of the outer loop in order to generate RF scores independent of the test data in the outer loop. These scores are then used to fit a calibration model, i.e. a L2-penalized, multinomial, logistic regression that takes the RF scores of the test data in the outer CV loop to estimate tumour class probabilities (P1, P2, P3). To fit a calibration model to estimate class probabilities of diagnostic samples using all data in the reference set, the RF scores generated in the outer CV loop are used. b, Schematic depiction of three exemplary binary decision trees of the Random Forest classifier (left), and magnification on five exemplary decisions nodes relevant for glioblastoma classification (right). For prediction, a diagnostic sample enters the root node of each of the 10,000 trees. At every decision node, the decision path is determined on the methylation level of a single CpG, until reaching a terminal node that provides the class prediction. The joint class prediction of all trees represents the raw prediction score. The colour code and abbreviations are identical to Figure 1a.
Extended Data Figure 5 |
Extended Data Figure 5 |. Comparison of raw and calibrated classifier scores and threshold definition.
a, Density plots illustrating the distribution of raw and calibrated classifier scores for samples correctly classified during cross-validation (n=2,701 independent biological samples for raw and n=2769 independent biological samples for calibrated), depicted for each methylation class or methylation class family (MCF). Score calibration results in a harmonization of score distribution and allows the establishment of a shared classification threshold. Three thresholds for maximizing specificity (0.958), maximizing the Youden index (0.836), and the cutoff used in this study (0.9) are indicated by red lines (see also panels d and e). b, Multivariate score calibration exemplified in a ternary plot showing scores of the three ATRT subclasses (MYC, SHH, and TYR; together n=112 independent biological samples). Arrows indicate transformation of the scores for individual samples by the calibration model, which increases the discrimination between the three subclasses. c, The accuracy of prediction of the Random Forest classifier constructed of n=2801 biologically independent samples (measured by misclassification error, area under receiver operating characteristic curve (AUC), Brier score, multiclass Sensitivity and Specificity) is improved by score calibration and by combining classes into methylation class families (MCF). d, To determine a common threshold for the calibrated MCF scores, we performed a Receiver Operating Characteristic (ROC) analysis of the maximum calibrated MCF scores of all n=2801 biologically independent samples calculated via cross-validation. For this ROC analysis we defined a new binary class, i.e. samples correctly classified during the CV using the maximum calibrated MCF score for classification were considered as ‘classifiable’ (n=2769) and samples that got falsely classified by using this score were considered ‘non classifiable’ (n=32). Three thresholds for different sensitivity and specificity are highlighted in the ROC curve: A threshold of 0.958 achieving a maximum specificity of 1 with a sensitivity of 0.827, a threshold of 0.836 obtaining a maximum Youden index with Specificity 0.938 and sensitivity 0.934, and our recommended compromise threshold of 0.9 that results in a specificity of 0.938 and a sensitivity of 0.9. Bootstrapped 95% confidence intervals for estimated sensitivity and specificity are indicated in grey. e, Sensitivity and specificity for all possible thresholds applied to cross-validated maximum MCF classifier scores of all n=2801 biologically independent samples. Three thresholds for maximizing specificity (0.958), maximizing the Youden index (0.836) and 0.9 are highlighted by red lines.
Extended Data Figure 6 |
Extended Data Figure 6 |. Diagnostic utility of the DNA-methylation based classifier, assessed at different centres.
a, Implementation of the DNA methylation classifier by five external centres. In total, 401 independent biological samples were analysed. 78% matched to an established class with a cut-off score of ≥0.9 (class colours as in Figure 1a). A new diagnosis was established in 12% of cases. b, Depiction of individual centre results, illustrating the different composition of samples included in the analysis, variation in the rate of non-matching cases, and of cases where a new diagnosis was established. Case-by-case details are given in Supplementary Table 6.
Extended Data Figure 7 |
Extended Data Figure 7 |. Inter-centre and inter-platform reproducibility of DNA methylation-based classification.
a, Calibrated scores of 53 independent biological samples representing diagnostic CNS tumour cases analysed at the University of Heidelberg and at the New York University pathology department. Both laboratories performed independent DNA extraction, array hybridization, and data analysis. Cases falling into green areas were classified identically in both centres (96%); cases in the red area were non-classifiable in one centre (4%). None of the 53 samples was assigned to a different methylation class by the two centres. b, Copy-number profiles calculated from the array data generated at both centres were highly comparable and allowed identification of chromosomal gains, losses, amplifications, and deletions. Calculations and interpretation were performed once at each centre. c, Plot of maximum raw classification scores of 16 different tumour samples generated using both 450k and EPIC arrays. All cases fall close to the bisecting line (red) indicating a high concordance of the scores. Further, the methylation class prediction was identical for all samples. d, The CNS tumour classifier also performs well with data generated by whole-genome bisulfite sequencing (WGBS). The plot shows classifier scores calculated from WGBS and 450k arrays of 50 cases comprising 11 different brain tumour entities (bisecting line in red). Methylation beta-values were calculated from high-coverage WGBS data (>10 fold average coverage) and run through the CNS tumour classifier and plotted against the same case analysed using 450k arrays. The highest class prediction score was identical in all cases.
Extended Data Figure 8 |
Sample website PDF report of a IDH wildtype glioblastoma sample.
Extended Data Figure 9 |
Exemplary workflow and timeline of diagnostic methylation profiling.
Figure 1 |
Figure 1 |. Establishing of the DNA methylation-based CNS tumour reference cohort.
a, Overview of the 82 CNS tumour methylation classes and nine control tissue methylation classes of the reference cohort. The methylation classes are grouped by histology and color-coded. Category 1 methylation classes are equivalent to a WHO entity, category 2 methylation classes are a subgroup of a WHO entity, category 3 methylation classes are not equivalent to a unique WHO entity with combining of WHO grades, category 4 methylation classes are not equivalent to a unique WHO entity with combining of WHO entities, and category 5 methylation classes are not recognized as a WHO entity. Full names and further details of the abbreviated 91 classes are given in Supplementary Table 1. Embryonal tumours: shades of blue; Glioblastomas: shades of green; Other gliomas: shades of violet; Ependymomas: shades of red; Glio-neuronal tumours: shades of orange; IDH-mutated gliomas: shades of yellow; Choroid plexus tumours: shades of brown; Pineal region tumours: shades of mint green; Melanocytic tumours: shades of dark blue; Sellar region tumours: shades of cyan; Mesenchymal tumours: shades of pink; Nerve tumours: shades of beige; Haematopoietic tumours: shades of dark purple; Control tissues: shades of grey. b, Unsupervised clustering of reference cohort samples (n=2,801) using t-SNE dimensionality reduction. Individual samples are colour-coded in the respective class colour (n=91) and labelled with the class abbreviation. The colour code and abbreviations are identical to Figure 1a.
Figure 2 |
Figure 2 |. Development and cross-validation of the DNA methylation-based CNS tumour classifier.
a, Schematic of principal classifier components (grey) and processing steps for individual test samples (white). The most informative probes are selected for training of the Random Forest classifier. The classifier produces raw scores representing the number of decision trees assigning a test sample to a specific methylation class. To enable inter-class-comparability a calibration model is used, which transforms raw into calibrated scores. Calibrated scores represent an estimated probability measure of methylation class assignment. b, Heatmap showing results of a three-fold cross-validation of the Random Forest classifier incorporating information of n=2801 biologically independent samples allotted to 91 methylation classes. Deviations from the bisecting line represent misclassification errors (using the maximum calibrated score for class prediction). Methylation class families (MCF) are indicated by black squares. The colour code and abbreviations are identical to Figure 1a.
Figure 3 |
Figure 3 |. Implementation of the classifier in diagnostic practice.
a, Classifier validation by an independent prospective cohort of diagnostic samples. Pathological diagnosis was established by current pathological standard according to the 2016 version of the WHO classification of CNS tumours and compared to classification by methylation profiling. Cases were categorized as “confirmation of diagnosis”, “establishing new diagnosis”, “misleading profile”, or “no match to defined class”. b, Overview of methylation profiling result from 1,155 diagnostic samples and integration with pathological diagnosis.
Figure 4 |
Figure 4 |. Reassessment of discrepant cases and establishment of new diagnosis.
Discrepancy between pathological diagnosis (left) and methylation profiling (middle) was observed for 139 cases. For 129 cases histological and molecular reassessment (Supplementary Table 5) resulted in change of the initial diagnosis with formulation of a new integrated diagnosis (right). For 92 cases this involved change of WHO grading, with both down- (blue) and upgrading (red). Integrated diagnoses in brackets are not recognized as a WHO entity. For methylation class abbreviations see Supplementary Table 1.
Figure 5 |
Figure 5 |. DNA methylation-based identification of potential new CNS tumour entities.
a, Unsupervised clustering of the combined reference (n=2,801, grey) and diagnostic cohort (n=1,104, coloured) using t-SNE dimensionality reduction. Abbreviated names indicate the reference cohort classes as in Figure 1. The diagnostic samples are colour coded as “confirmation of diagnosis” (n=838, green), “establishing new diagnosis” (n=129, blue), “misleading profile” (n=10, red) and “no match to defined class” (n=127, dark grey). The matching (green) and reclassified (blue) cases show high overlap with the reference cases. The non-classifiable (black) and the misleading (red) cases frequently fall in the periphery of the reference classes or are completely separate of these. The magnification (right) highlights two non-classifiable cases (here in magenta for easier identification) that group together in the t-SNE representation. b, Both highlighted non-classifiable cases occurred in female children, and had primitive neuroectodermal histology (glioblastoma- or embryonal tumour-like). Histology was assessed by three independent pathologists with similar results. c, Both cases shared a high-level amplification of chromosome 6q24.2 (common amplified region chr6:144,149,293–144,649,987). The common region includes only 5 protein coding genes: LTV1 (LTV1 ribosome biogenesis factor), ZC2HC1B (zinc finger C2HC-type containing 1B), PLAGL1 (PLAG1 like zinc finger 1), SF3B5 (splicing factor 3b subunit 5) and STX11 (syntaxin 11). This amplification was not observed in any of the other tumours from the reference or diagnostic cohort. Copy number analysis was performed once using copy number information deriving from the methylation array data.

Comment in

Similar articles

Cited by

References

    1. Louis DN, Ohgaki H, Wiestler OD & Cavenee WK WHO Classification of Tumours of the Central Nervous System (revised 4th edition). (IARC, 2016).
    1. van den Bent MJ Interobserver variation of the histopathological diagnosis in clinical trials on glioma: a clinician’s perspective. Acta Neuropathol . 120, 297–304, doi:10.1007/s00401-010-0725-7 (2010). - DOI - PMC - PubMed
    1. Ellison DW et al. Histopathological grading of pediatric ependymoma: reproducibility and clinical relevance in European trial cohorts. J Negat Results Biomed 10, 7, doi:10.1186/1477-5751-10-7 (2011). - DOI - PMC - PubMed
    1. Sturm D et al. New Brain Tumor Entities Emerge from Molecular Classification of CNS-PNETs. Cell 164, 1060–1072, doi:10.1016/j.cell.2016.01.015 (2016). - DOI - PMC - PubMed
    1. Fernandez AF et al. A DNA methylation fingerprint of 1628 human samples. Genome Res . 22, 407–419, doi:10.1101/gr.119867.110 (2012). - DOI - PMC - PubMed

Online Only References

    1. Korshunov A et al. Histologically distinct neuroepithelial tumors with histone 3 G34 mutation are molecularly similar and comprise a single nosologic entity. Acta Neuropathol . 131, 137–146, doi:10.1007/s00401-015-1493-1 (2016). - DOI - PubMed
    1. Korshunov A et al. Embryonal tumor with abundant neuropil and true rosettes (ETANTR), ependymoblastoma, and medulloepithelioma share molecular similarity and comprise a single clinicopathological entity. Acta Neuropathol . 128, 279–289, doi:10.1007/s00401-013-1228-0 (2014). - DOI - PMC - PubMed
    1. Holsken A et al. Adamantinomatous and papillary craniopharyngiomas are characterized by distinct epigenomic as well as mutational and transcriptomic profiles. Acta Neuropathol Commun 4, 20, doi:10.1186/s40478-016-0287-6 (2016). - DOI - PMC - PubMed
    1. Heim S et al. Papillary Tumor of the Pineal Region: A Distinct Molecular Entity. Brain Pathol . 26, 199–205, doi:10.1111/bpa.12282 (2016). - DOI - PMC - PubMed
    1. Koelsche C et al. Melanotic tumors of the nervous system are characterized by distinct mutational, chromosomal and epigenomic profiles. Brain Pathol . 25, 202–208, doi:10.1111/bpa.12228 (2015). - DOI - PMC - PubMed

Publication types