. 2018 Mar 14;19(1):31.
doi: 10.1186/s13059-018-1416-2.

Single-cell RNA-seq analysis unveils a prevalent epithelial/mesenchymal hybrid state during mouse organogenesis

Affiliations

Single-cell RNA-seq analysis unveils a prevalent epithelial/mesenchymal hybrid state during mouse organogenesis

Ji Dong et al. Genome Biol. .

Abstract

Background: Organogenesis is crucial for proper organ formation during mammalian embryonic development. However, the similarities and shared features between different organs and the cellular heterogeneity during this process at single-cell resolution remain elusive.

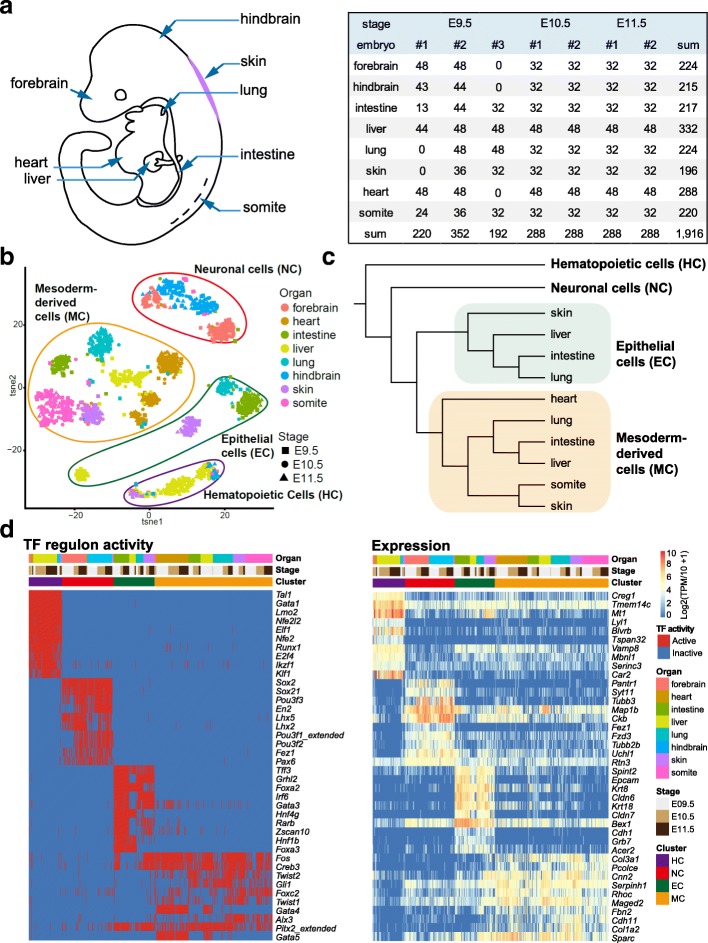
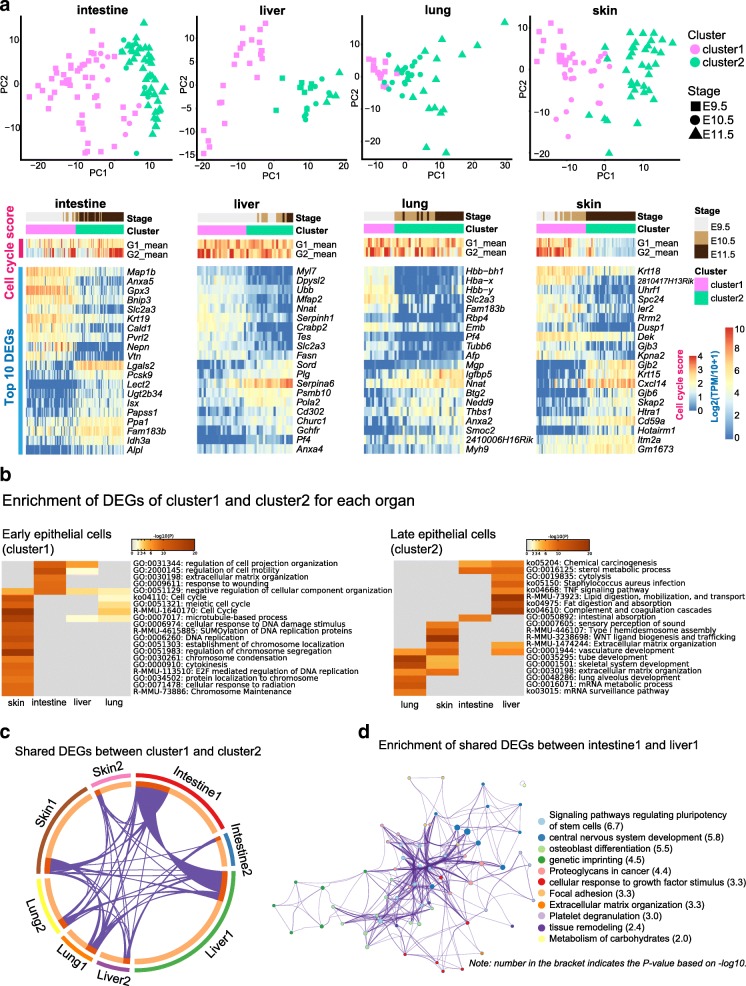
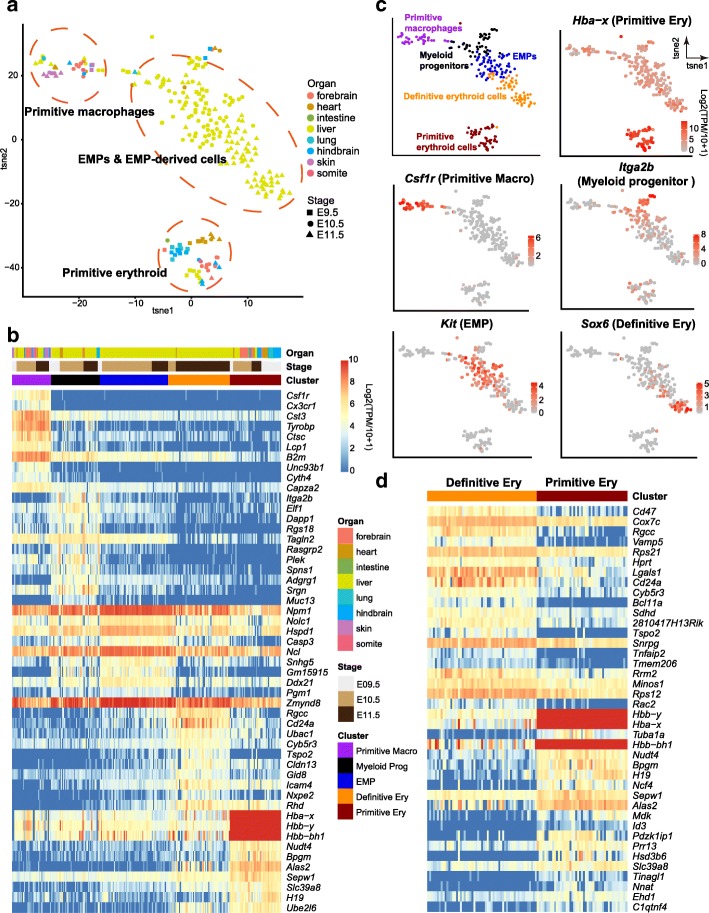
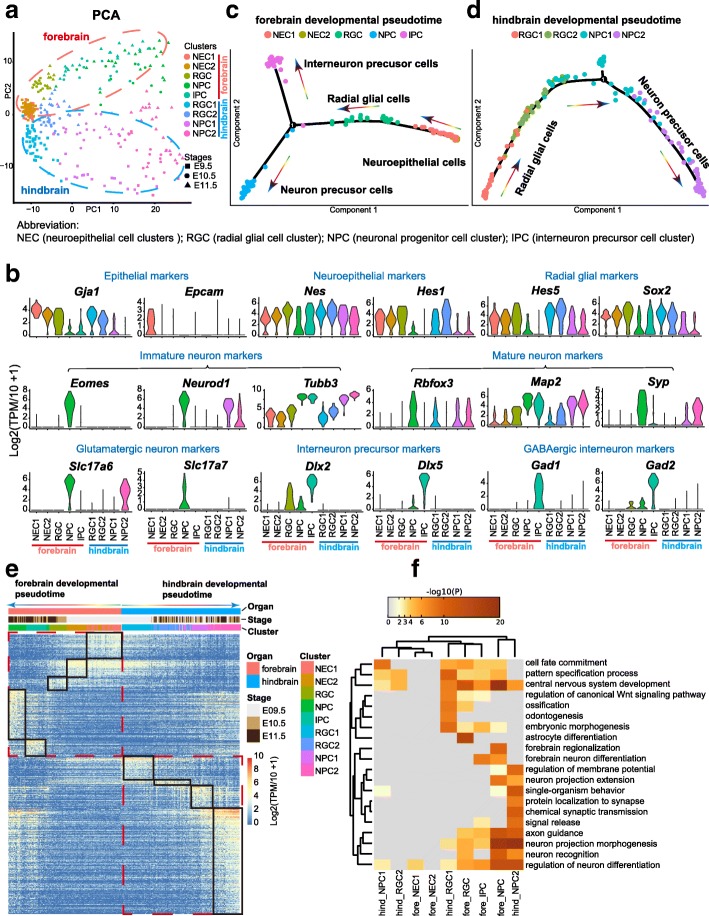
Results: We perform single-cell RNA sequencing analysis of 1916 individual cells from eight organs and tissues of E9.5 to E11.5 mouse embryos, namely, the forebrain, hindbrain, skin, heart, somite, lung, liver, and intestine. Based on the regulatory activities rather than the expression patterns, all cells analyzed can be well classified into four major groups with epithelial, mesodermal, hematopoietic, and neuronal identities. For different organs within the same group, the similarities and differences of their features and developmental paths are revealed and reconstructed.

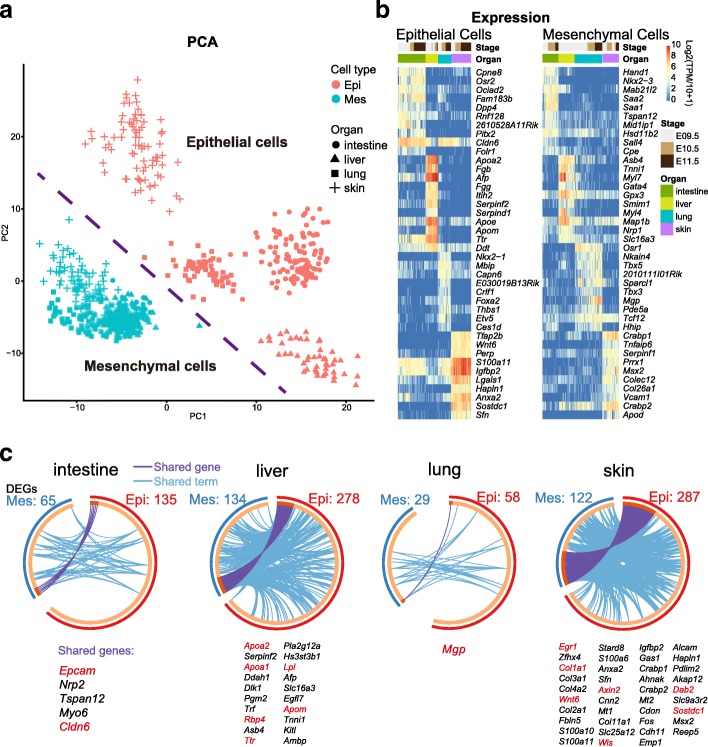
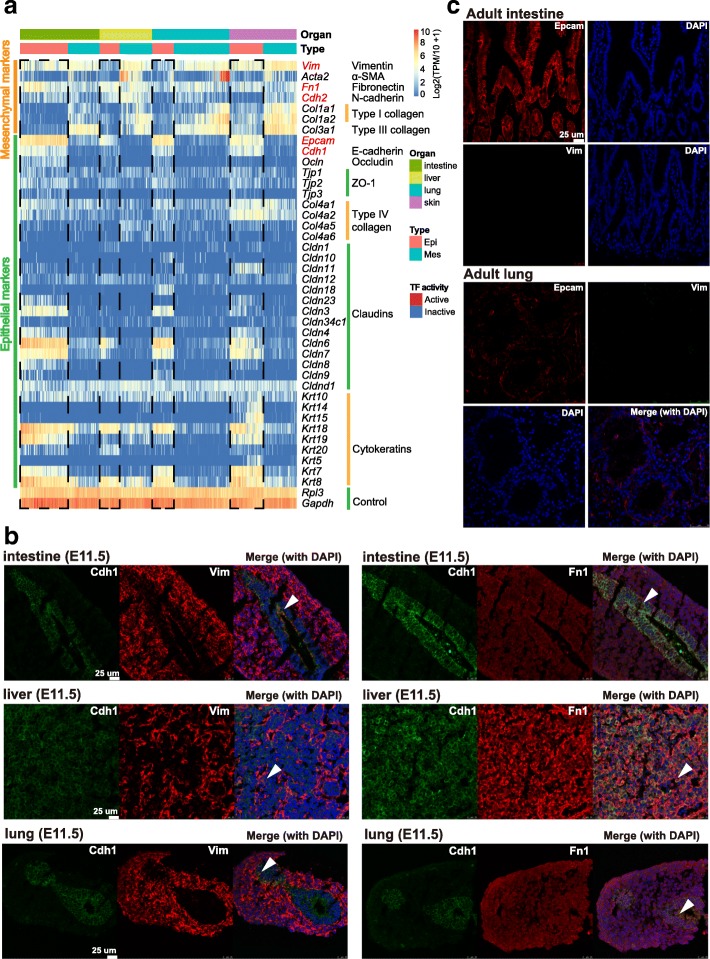
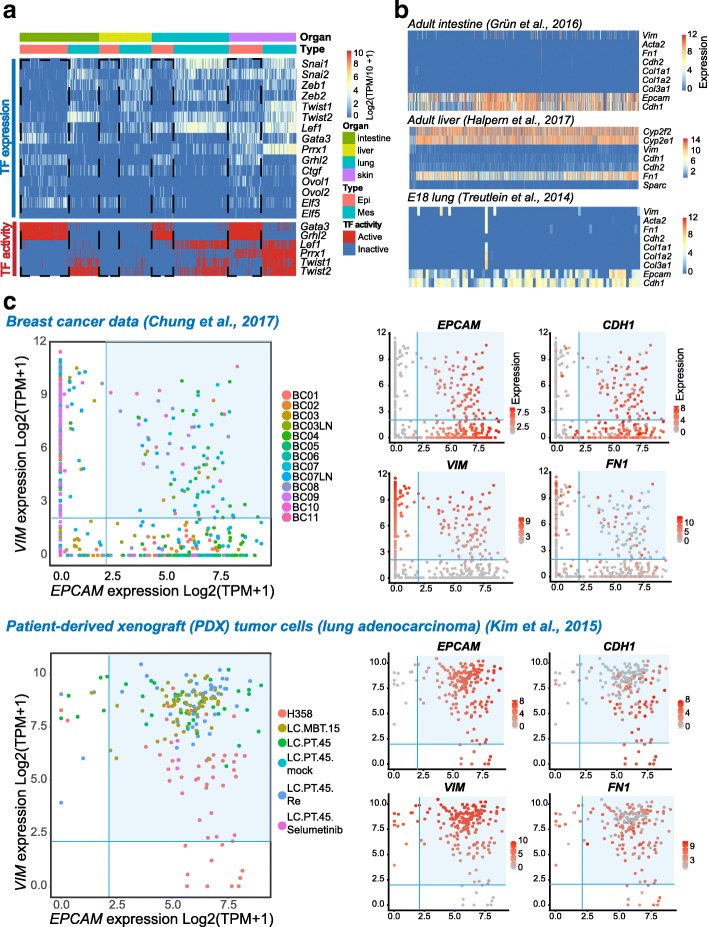
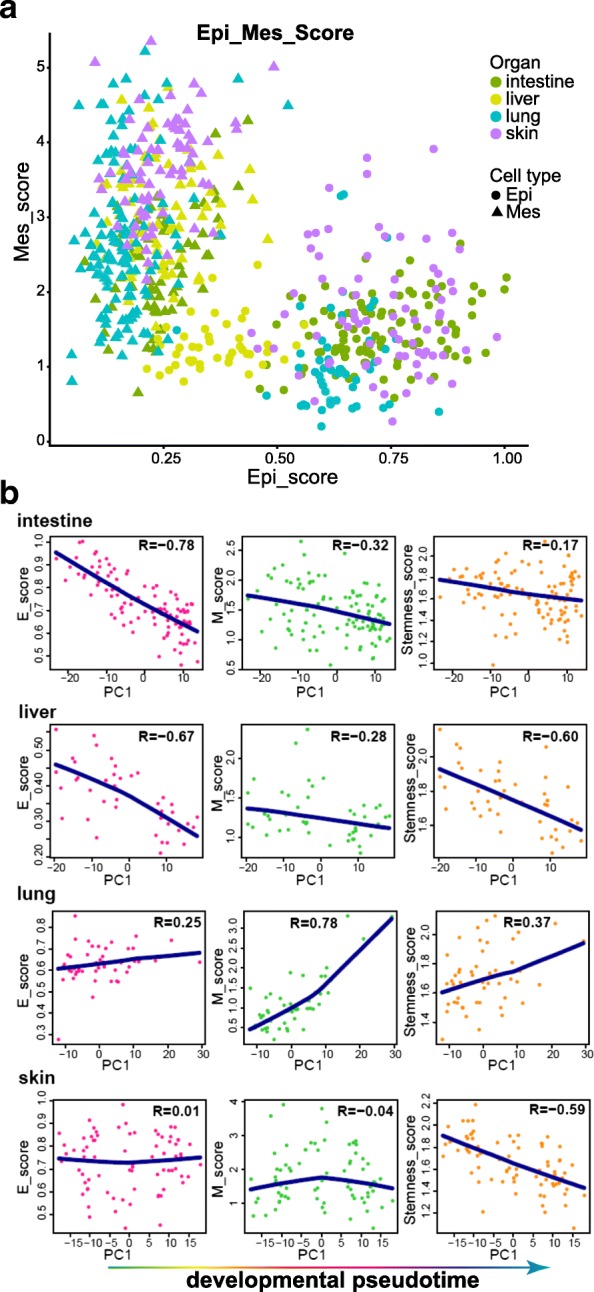
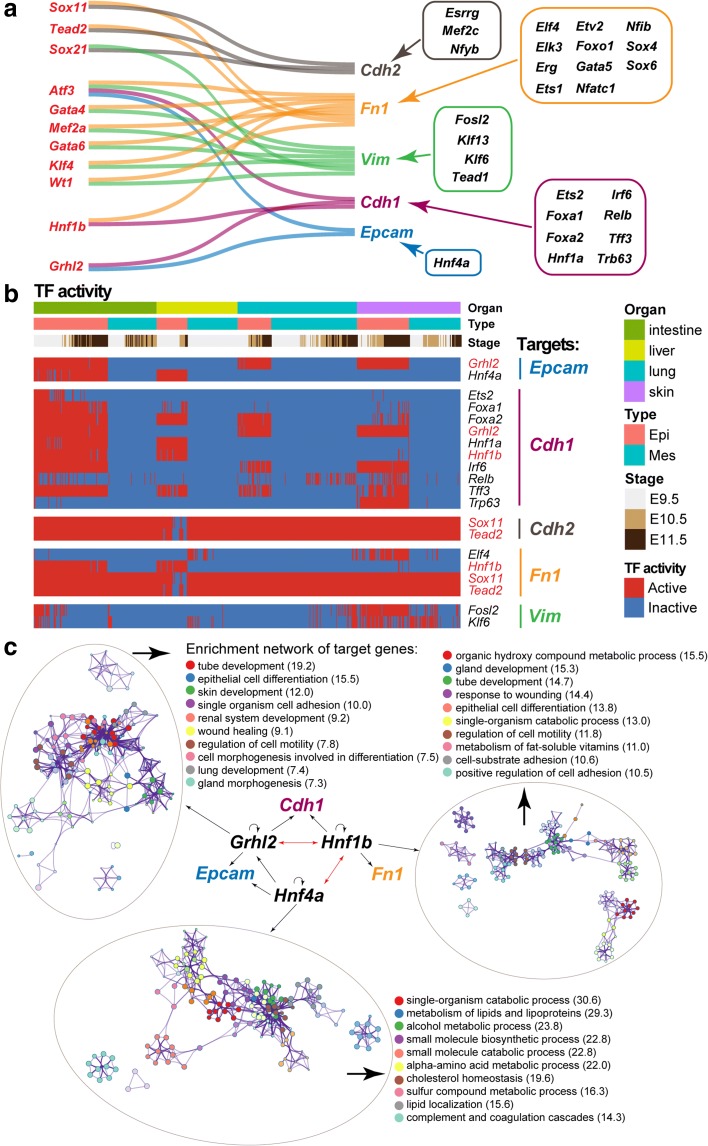
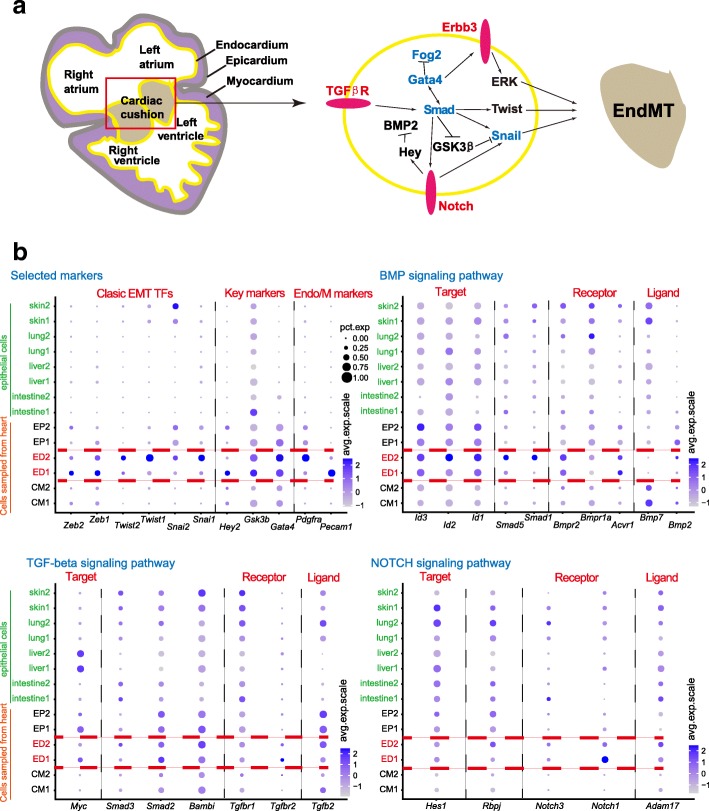
Conclusions: We identify mutual interactions between epithelial and mesenchymal cells and detect epithelial cells with prevalent mesenchymal features during organogenesis, which are similar to the features of intermediate epithelial/mesenchymal cells during tumorigenesis. The comprehensive transcriptome at single-cell resolution profiled in our study paves the way for future mechanistic studies of the gene-regulatory networks governing mammalian organogenesis.

Keywords: Epithelial/mesenchymal hybrid state; Interactions between mesenchyme and epithelium; Organogenesis; Single-cell RNA-seq.


Conflict of interest statement

Ethics approval

The study was approved by the Peking University Institutional Animal Care and Use Committee (IACUC). All the animal experiments were conducted following their guidelines.

Competing interests

The authors declare that they have no competing interests.

Publisher’s Note

Springer Nature remains neutral with regard to jurisdictional claims in published maps and institutional affiliations.

Figures

Fig. 1
Fig. 1
Global patterns of single-cell expression profiles and the identification of cell types. a Schematic of the sampling position (left) and sampling information (right) of each mouse organ and tissue. b Regulon matrix-based t-distributed stochastic neighbor embedding (t-SNE) plot showing the origin and embryonic stage of the cells. Organ types are indicated by colors, and developmental stages are indicated by shapes. The major groups identified are circled and annotated. c Hierarchical clustering through the regulon matrix showing the relationships of cells sampled from different organs and major groups identified by the regulon matrix. d Heatmaps showing the top 10 group-specific transcription factors (TFs, left) and differentially expressed genes (DEGs, right) of each major group. The color key from blue to red indicates low to high gene expression or TF activity, respectively
Fig. 2
Fig. 2
Interaction between epithelial and mesenchymal cells sampled from intestine, liver, lung, and skin. a Principal component analysis (PCA) of epithelial and mesenchymal cells. Cell types are indicated by colors, and organ types are indicated by shapes. b Heatmaps showing the top 10 DEGs of epithelial (left) and mesenchymal (right) cells sampled from each organ. The color key from blue to red indicates low to high gene expression, respectively. c Circos plots showing interaction between epithelial and mesenchymal cells. The shared genes are linked by purple lines, and the different genes falling into the same term are linked by blue lines
Fig. 3
Fig. 3
Development of epithelial cells sampled from intestine, liver, lung, and skin. a Principal component analysis (PCA) of epithelial cells sampled from different organs (top). Clusters are indicated by colors, and developmental stages are indicated by shapes. Heatmaps showing the top 10 DEGs of each cluster in different organs (bottom). The color key from blue to red indicates low to high gene expression, respectively. b Heatmaps showing enrichment of DEGs of all early epithelial cells (cluster1, left) and all late epithelial cells (cluster2, right). The color key from gray to brown indicates high to low P values, respectively. c Circos plots showing shared DEGs among clusters of epithelial cells. The shared genes are linked by purple lines. d Enrichment network of shared DEGs between intestine1 and liver1. Each term is indicated by a circular node. The number of input genes falling into that term is represented by the circle size and the cluster identities are represented by colors. P values based on –log10 are given in the brackets
Fig. 4
Fig. 4
Prevalent epithelial/mesenchymal hybrid state in epithelial cells during organogenesis. a Heatmap showing the representative epithelial and mesenchymal markers in epithelial and mesenchymal cells. The color key from blue to red indicates low to high gene expression, respectively. b Immunostaining of Cdh1, Vim, and Fn1 in E11.5 intestine, liver, and lung. The white arrow indicates potential co-expression of Cdh1 and Vim. c Immunostaining for Epcam and Vim in adult intestine and lung
Fig. 5
Fig. 5
Expression pattern of representative EMT-related TFs and expression pattern of representative markers in late-stage or adult organs and two carcinoma datasets. a Heatmaps showing the representative EMT-related TFs in epithelial and mesenchymal cells. The color key from blue to red indicates low to high gene expression or TF activity, respectively. b Heatmaps showing the representative markers in adult intestine, adult liver, and E18 lung [15, 30, 31]. c Scatterplots showing the expression of representative markers in two carcinoma datasets [32, 33]. Cells sampled from different sources are represented by colors at the first plot of each dataset. For all plots, the x-axis measures the expression value of EPCAM, and the y-axis measures the expression value of VIM. Cells whose expression values of both EPCAM and VIM exceed 2 are shadowed in blue, indicating the potential E/M hybrid state. The expression values of representative markers are indicated by colors. The color key from gray to red indicates low to high gene expression, respectively
Fig. 6
Fig. 6
Epithelial, mesenchymal, and stemness scores of cells sampled from intestine, liver, lung, and skin. a Scatterplots showing the epithelial and mesenchymal scores for cells sampled from intestine, liver, lung, and skin. Organs are indicated by colors, and cell types are indicated by shapes. The x-axis represents the epithelial score, and the y-axis represents the mesenchymal score. b Scatterplots showing the changes in epithelial, mesenchymal, and stemness scores for epithelial cells sampled from intestine, liver, lung, and skin during development, as inferred by PC1 in Fig. 3a. The Pearson correlation coefficient between each score and PC1 is calculated
Fig. 7
Fig. 7
Transcription factors (TFs) regulating key epithelial and mesenchymal markers. a TFs that positively regulate key epithelial and mesenchymal markers. TFs on the left can regulate more than one marker, and marker-specific TFs are shown on the right. TFs and their targets are linked by lines. b Heatmap showing the TF activity in epithelial and mesenchymal cells sampled from intestine, liver, lung, and skin. The color key from blue to red indicates low to high TF activity, respectively. c Enrichment networks for target genes of Grhl2, Hnf1b, and Hnf4a. Their interactions are also indicated by arrows
Fig. 8
Fig. 8
Expression patterns of hematopoietic cells. a Expression-based t-SNE plot of hematopoietic cells. Cells sampled from different organs are indicated by colors, and their developmental stages are indicated by shapes. b Heatmaps showing the top 10 DEGs of each cluster. The color key from blue to red indicates low to high gene expression, respectively. c The expression of representative markers mapped on the t-SNE plot in a. d Heatmaps showing the top 20 DEGs between definitive primitive erythroid cells
Fig. 9
Fig. 9
Expression patterns of neuronal cells. a PCA plot showing the neuronal cells sampled from the forebrain and hindbrain. Cells from different clusters are indicated by colors, and their developmental stages are indicated by shapes. Abbreviation information is shown on the bottom. b Violin plots showing the expression of representative markers in each cluster. c Developmental pseudotime of forebrain cells inferred by Monocle2. Clusters are indicated by colors. d Developmental pseudotime of hindbrain cells inferred by Monocle2. Clusters are indicated by colors. e Heatmaps showing the DEGs of each cluster compared with all other clusters. Cells are arranged by the developmental pseudotime from c and d. f Heatmaps showing enrichment of DEGs of each cluster. The color key from gray to brown indicates high to low P values, respectively
Fig. 10
Fig. 10
Expression patterns of representative markers during endothelial-to-mesenchymal transition (EndMT) in heart. a Schematic of EndMT and the key markers and signaling pathways modified from Lim and Thiery [5]. b The expression of key markers and signaling pathways during EndMT in heart. The epithelial clusters of intestine, liver, lung, and skin are also shown. The color key from gray to purple indicates low to high average gene expression, respectively. The dot size indicates percentage of cells expressing a certain marker

Similar articles

Cited by

References

    1. Cunha GR, Baskin L. Mesenchymal-epithelial interaction techniques. Differentiation. 2016;91:20–27. doi: 10.1016/j.diff.2015.10.006. - DOI - PMC - PubMed
    1. Baskin L, Hayward S, Sutherland R, DiSandro M, Thomson A, Goodman J, Cunha G. Mesenchymal-epithelial interactions in the bladder. World J Urol. 1996;14:301–309. doi: 10.1007/BF00184602. - DOI - PubMed
    1. Cunha GR, Hom YK. Role of mesenchymal-epithelial interactions in mammary gland development. J Mammary Gland Biol Neoplasia. 1996;1:21–35. doi: 10.1007/BF02096300. - DOI - PubMed
    1. Thiery JP. Epithelial-mesenchymal transitions in development and pathologies. Curr Opin Cell Biol. 2003;15:740–746. doi: 10.1016/j.ceb.2003.10.006. - DOI - PubMed
    1. Lim J, Thiery JP. Epithelial-mesenchymal transitions: insights from development. Development. 2012;139:3471–3486. doi: 10.1242/dev.071209. - DOI - PubMed

Publication types