. 2018 Mar 15;19(1):32.
doi: 10.1186/s13059-018-1405-5.

Genomic positional conservation identifies topological anchor point RNAs linked to developmental loci

Affiliations

Genomic positional conservation identifies topological anchor point RNAs linked to developmental loci

Paulo P Amaral et al. Genome Biol. .

Abstract

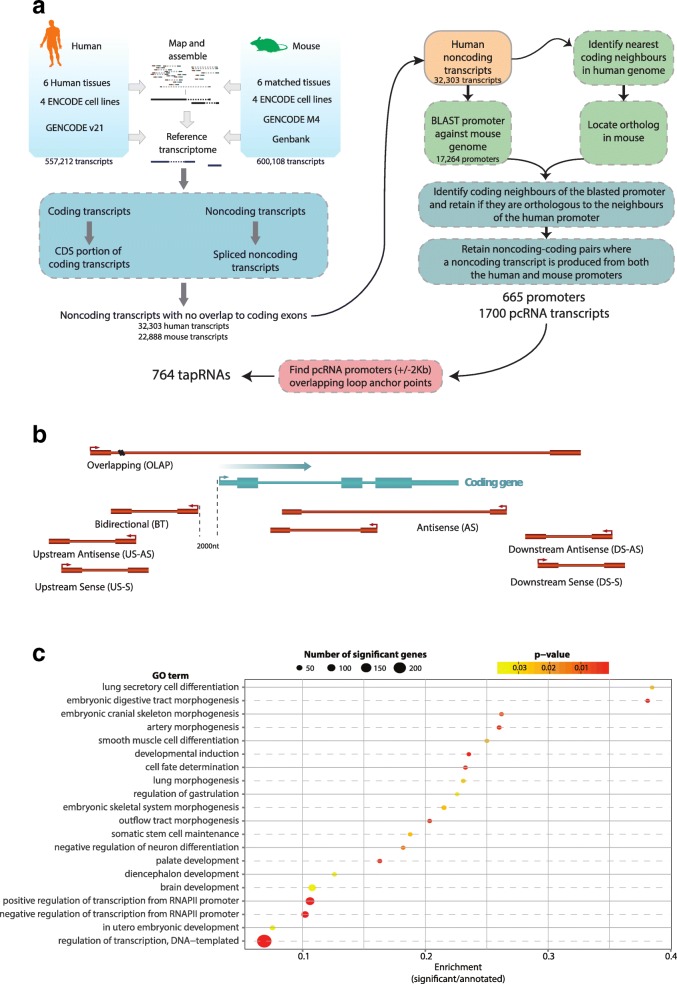
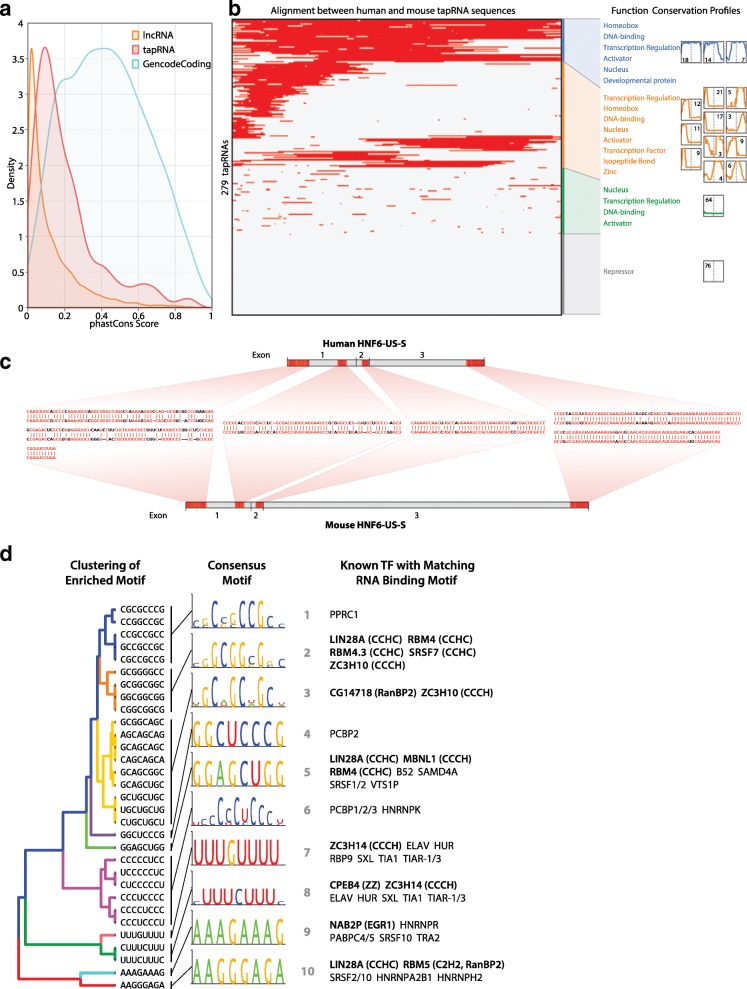
Background: The mammalian genome is transcribed into large numbers of long noncoding RNAs (lncRNAs), but the definition of functional lncRNA groups has proven difficult, partly due to their low sequence conservation and lack of identified shared properties. Here we consider promoter conservation and positional conservation as indicators of functional commonality.

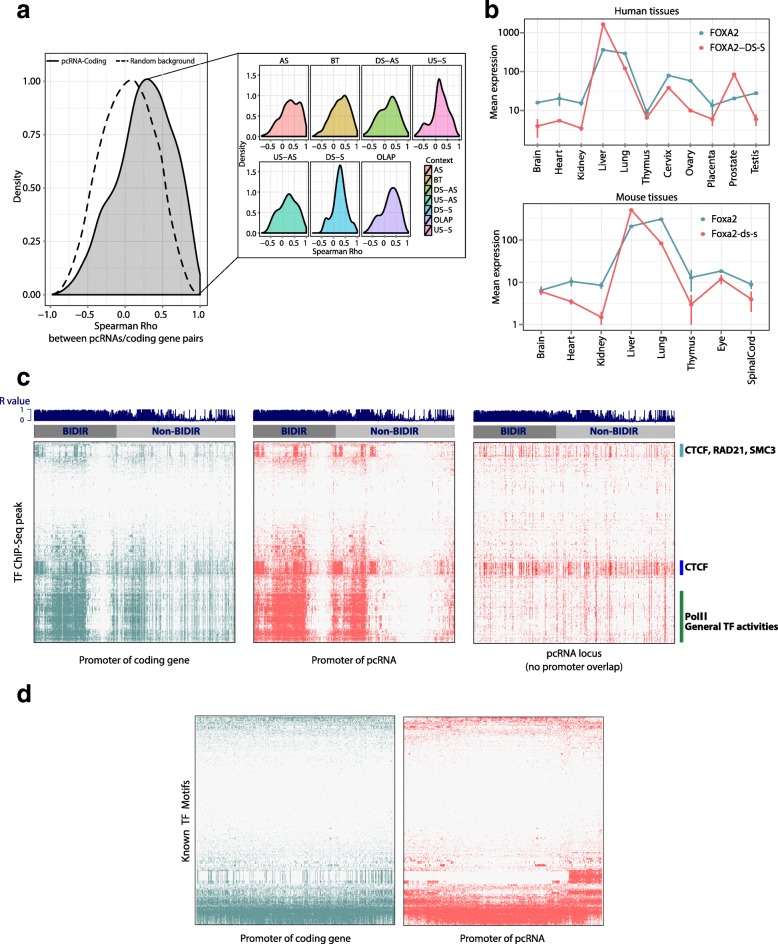
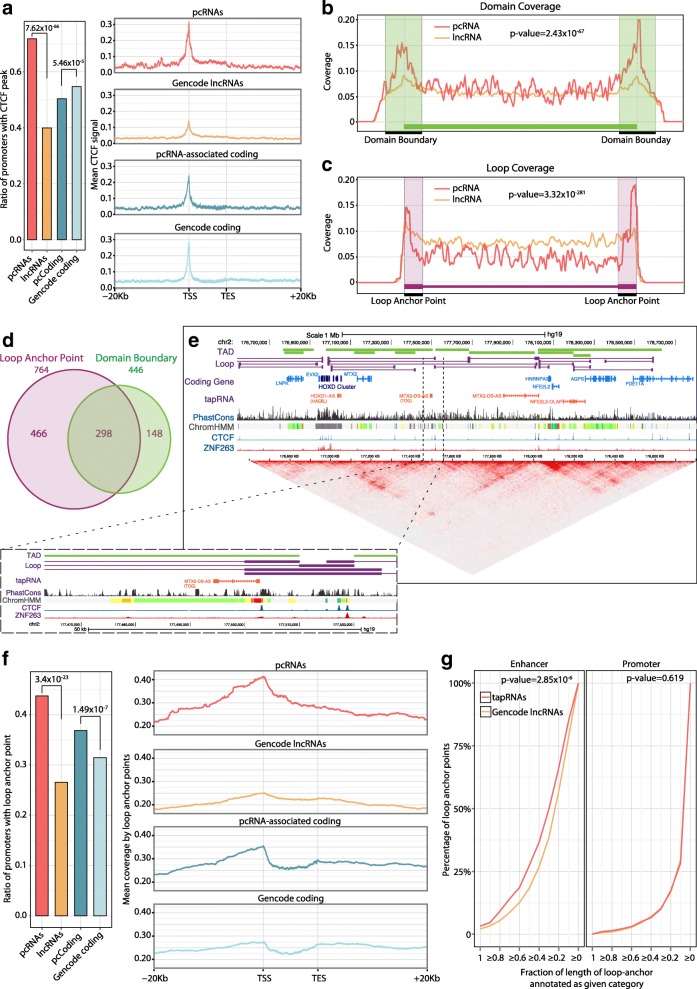
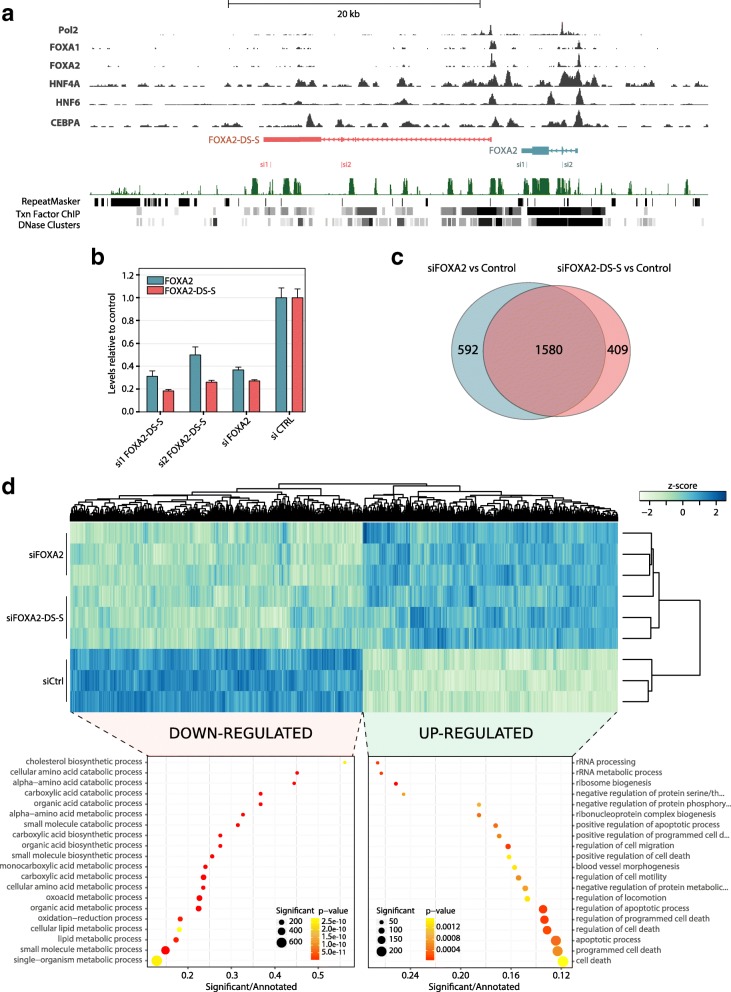
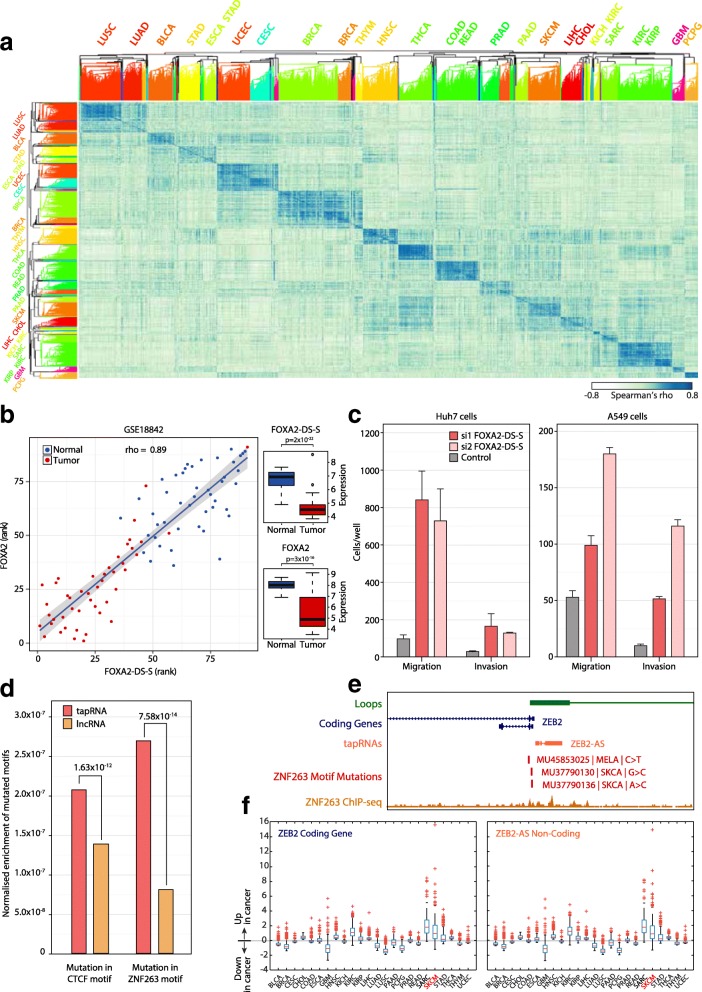
Results: We identify 665 conserved lncRNA promoters in mouse and human that are preserved in genomic position relative to orthologous coding genes. These positionally conserved lncRNA genes are primarily associated with developmental transcription factor loci with which they are coexpressed in a tissue-specific manner. Over half of positionally conserved RNAs in this set are linked to chromatin organization structures, overlapping binding sites for the CTCF chromatin organiser and located at chromatin loop anchor points and borders of topologically associating domains (TADs). We define these RNAs as topological anchor point RNAs (tapRNAs). Characterization of these noncoding RNAs and their associated coding genes shows that they are functionally connected: they regulate each other's expression and influence the metastatic phenotype of cancer cells in vitro in a similar fashion. Furthermore, we find that tapRNAs contain conserved sequence domains that are enriched in motifs for zinc finger domain-containing RNA-binding proteins and transcription factors, whose binding sites are found mutated in cancers.

Conclusions: This work leverages positional conservation to identify lncRNAs with potential importance in genome organization, development and disease. The evidence that many developmental transcription factors are physically and functionally connected to lncRNAs represents an exciting stepping-stone to further our understanding of genome regulation.

Keywords: Cancer; Chromatin architecture; Development; Topology; Zinc finger; lncRNAs.


Conflict of interest statement

Ethics approval and consent to participate

Not applicable.

Consent for publication

Not applicable.

Competing interests

The authors declare that they have no competing interests.

Publisher’s Note

Springer Nature remains neutral with regard to jurisdictional claims in published maps and institutional affiliations.

Figures

Fig. 1
Fig. 1
Identification of pcRNAs and tapRNAs. a Workflow used for the identification of pcRNAs and tapRNAs. b The possible orientations of a pcRNA (red) relative to a coding gene (blue). c Gene Ontology (GO) enrichment analysis of pcRNA-associated coding genes. The x-axis shows the enrichment score, calculated as the number of pcRNA-associated genes in a given GO category divided by the total number of genes in the category. The size of the points indicates the absolute number of pcRNA-associated genes in the given GO category. The colour-coding indicates the adjusted p value. CDS coding sequence
Fig. 2
Fig. 2
pcRNA expression and regulation. a Density distribution of the Spearman’s correlation coefficients between pcRNAs and corresponding coding genes in human tissues and cell lines (mean Spearman’s rho 0.25, permutation test p value < 10−6). The dotted line shows the background distribution of all pairwise Spearman’s correlations between pcRNAs and pcRNA-associated coding genes. Inset: Distributions of the Spearman’s correlation coefficients divided by the positional category of the pcRNA. AS antisense, BT bidirectional, DS-AS downstream antisense, DS-S downstream sense, OLAP overlapping, US-AS upstream antisense, US-S upstream sense. b Nanostring expression profiles of FOXA2 and FOXA-DS-S across human (top) and mouse (bottom) tissues. The points indicate the mean value of two technical replicates, while the vertical bars report the value of each replicate. c Transcription factor binding patterns in the promoters of pcRNAs (middle), their associated coding genes (left), and across pcRNA loci (right). The heatmaps present the distribution of experimentally validated TF-binding sites from 2216 ENCODE ChIP-Seq experiments (y-axis), showing a high degree of co-occupancy between the promoters of pcRNAs (x-axis) and their associated coding genes. The blue bar graph on top of each heatmap shows correlation (r values) between a pcRNA and its associate coding gene. The color bars next to the right heatmap indicate the TF groups showing dominant binding patterns. d Same as in c but indicating the presence of TF-binding motifs based on known motifs annotated in JASPAR (freeze 2014–12–10, 263 motifs), in Kheradpour and Kellis [100] (2065 motifs) and in Jolma et al. [101] (843 motifs)
Fig. 3
Fig. 3
Identification of tapRNAs. a The proportion of pcRNAs, pcRNA-associated coding genes, Gencode lncRNAs and Gencode coding genes with a CTCF peak (based on Encode ChIP-Seq data) overlapping their promoter. The p values reported were calculated with hypergeometric tests. Right: CTCF peak coverage of loci of pcRNAs, pcRNA-associated coding genes, Gencode lncRNAs and Gencode coding genes. The plots report the loci from 20 kb upstream of the transcription start site (TSS) to 20 kb downstream of the transcription end site (TES). For visualization purposes these profiles show the coverage of a random sample of 5000 Gencode lncRNAs and 5000 random Gencode coding genes. b, c Aggregation density plots showing the distribution of the TSS of pcRNAs (red) and lncRNAs (orange) relative to chromatin topological domains (b) and chromatin loop anchor points (c). Domains and loop anchor points were defined based on HiC data. d Venn diagram showing the number of pcRNAs whose promoters overlap a loop anchor point (purple) or a domain boundary (green). e The HOXD locus showing the tapRNAs and chromatin loops defined by HiC data [43]. Modified from a screenshot of the UCSC genome browser. f The proportion of pcRNAs, pcRNA-associated coding genes, Gencode lncRNAs and Gencode coding genes with a HiC loop overlapping their promoter. The p values reported were calculated with hypergeometric tests. Right: HiC loop coverage of loci of pcRNAs, pcRNA-associated coding genes, Gencode lncRNAs and Gencode coding genes. The plotted genomic regions encompass the loci from 20 kb upstream of the TSS to 20 kb downstream of the TES. For visualization purposes these profiles show the coverage of a random sample of 5000 Gencode lncRNAs and 5000 random Gencode coding genes. g Cumulative distribution plot showing the percentage of distal genomic regions in contact with pcRNA promoters (y-axis) as a function of the fraction of length of loop-end annotated as enhancer (left) or promoter (right). For example, the “≥ 0.4” point (x-axis) of the red line in the first plot indicates that ~ 37 % (y-axis) of the distal genomic regions in contact with pcRNA promoters are annotated as enhancer for 40 % or more of their length. Promoters of pcRNAs are significantly more often in contact through loops with enhancer elements compared to generic Gencode lncRNAs (p value 2.85 × 10⁻⁶). The indicated p values were calculated using the Kolmogorov-Smirnov test
Fig. 4
Fig. 4
Conserved sequence motifs in tapRNAs. a Comparison of conservation between tapRNAs, lncRNAs and protein coding genes. The curves are kernel density estimation (KDE) of conservation scores calculated from the phastCons multiple alignments of 100 vertebrate species. b Clustered heatmap of conserved domains in transcribed tapRNAs. Aligned sequences (shown in red) in 279 non-redundant tapRNA isoforms are clustered (Euclidean distance). Sixteen minor clusters were identified and grouped into four major clusters. Each minor cluster’s centroids are shown with the number of tapRNAs belonging to each minor cluster. Thirty-nine tapRNAs (top group, blue) have a more than ~ 73 % conserved domain in their transcribed sequences. Functional category annotation search reveals that tapRNAs of the top group are highly related to developmental proteins or Homeobox proteins. In contrast, 76 tapRNAs of the bottom cluster (grey) do not have any sequence conservation and do not show significant common functionality. There are also some minor groups in which position-specific conservation is clearly present (e.g. 5′ end-specific or 3′ end-specific). c Example of conserved domains in a tapRNA. RNA sequence alignments of regions conserved between human and mouse HNF6-US-S tapRNA are represented in red. d Enriched RNA-binding motif in conserved domains of tapRNAs. Thirty-two significantly enriched 8-mer motifs (Additional file 2: Figure S13b; p value 1 × 10⁻⁴) in conserved domains in tapRNAs are identified and clustered into ten consensus motifs. De novo motif analysis discovers known RNA-binding proteins (RBPs) with matching binding consensus motifs. Seven out of ten consensus motifs are part of binding motifs of zinc finger proteins
Fig. 5
Fig. 5
FOXA2-DS-S regulates FOXA2 expression. a Screenshot from the Dalliance genome browser [50] showing the FOXA2 locus with tracks displaying coverage data for ChIP-Seq experiments for Pol2, FOXA1, FOXA2, HNF4A, HNF6 and CEBPA. The ChIP-Seq tracks were produced by the ENCODE project on HepG2 cells. b Real time PCR data showing the expression of FOXA2 and FOXA2-DS-S in Huh7 cells upon knock-down. Si1 and si2 FOXA2-DS-S indicate two different, non-overlapping siRNAs designed against FOXA2-DS-S. The data are expressed relative to the expression of the control transfected with scrambled siRNAs; the error bars indicate the standard error of the mean across three replicate experiments. c Venn diagram showing the number of significantly differentially expressed genes (adjusted p value < 0.05 and log2 fold change > or < 1.25) in the microarray experiment on Huh7 knock-down of FOXA2 or FOXA-DS-S. d Heatmap showing microarray data upon knock-down of FOXA2 or FOXA-DS-S in Huh7 cells. The colour scale indicates normalised intensities (z-score). The heatmap contains all genes that were significantly altered (adjusted p < 0.05) upon knoc- down of either FOXA2 or FOXA-DS-S. The scatter plots in the lower part of the panel show GO enrichment data for genes that were significantly down-regulated (left) or up-regulated (right) in either siFOXA2 or siFOXA-DS-S
Fig. 6
Fig. 6
pcRNAs are differentially expressed in cancer. a Spearman’s rank-order correlation heatmap between tapRNAs and their associated coding genes in TCGA RNA-Seq V2 level 3 data. The correlation was calculated between the two matrices of TCGA RNA-Seq fold changes (Additional file 2: Figure S18a, b) and shows that the expression of pcRNAs and corresponding coding genes is correlated within specific cancers. b Spearman correlation between the expression of FOXA2 and FOXA2-DS-S in lung cancers (GSE18842 dataset). Tumour and normal individual samples are represented as blue and red dots, respectively. Boxplots on the right show that both transcripts are down-regulated in tumour compared to normal samples (Student’s t-test p values are indicated). c Invasion and migration assay analysis of Huh7 (left) and A549 (right) cells upon knock-down of FOXA2-DS-S using two different siRNAs (si1 and si2) compared to negative control siRNA. The bars show the mean of three biological replicate experiments. The error bars indicate the standard error of the mean. d Mutational analysis of CTCF and ZNF263 motifs associated with tapRNA loci. CTCF and ZNF263 motifs inside of tapRNA loci have significantly higher chances to be mutated in cancer. In total, we catalogued 241 CTCF motif mutations in 171 motif sites (37 cancer types) and 196 ZNF263 motif mutations in 135 motif sites (27 cancer types). e Example of a mutational analysis of CTCF and ZNF263 motifs associated within the ZEB2/ZEB2-AS/BT tapRNA locus, depicting the mutations found in melanomas. f Expression profile of ZEB2 and ZEB2-AS/BT in different cancers, showing concordant increased expression in malignancies, including skin cutaneous melanoma (SKCM)

Similar articles

Cited by

References

    1. Iyer MK, Niknafs YS, Malik R, Singhal U, Sahu A, Hosono Y, Barrette TR, Prensner JR, Evans JR, Zhao S, et al. The landscape of long noncoding RNAs in the human transcriptome. Nat Genet. 2015;47:199–208. doi: 10.1038/ng.3192. - DOI - PMC - PubMed
    1. Zhao Y, Li H, Fang S, Kang Y, Wu W, Hao Y, Li Z, Bu D, Sun N, Zhang MQ, Chen R. NONCODE 2016: an informative and valuable data source of long non-coding RNAs. Nucleic Acids Res. 2016(44):D203–8. - PMC - PubMed
    1. Liu SJ, Horlbeck MA, Cho SW, Birk HS, Malatesta M, He D, Attenello FJ, Villalta JE, Cho MY, Chen Y, et al. CRISPRi-based genome-scale identification of functional long noncoding RNA loci in human cells. Science. 2017;355(6320):eaah7111. - PMC - PubMed
    1. Engreitz JM, Haines JE, Perez EM, Munson G, Chen J, Kane M, McDonel PE, Guttman M, Lander ES. Local regulation of gene expression by lncRNA promoters, transcription and splicing. Nature. 2016;539:452–455. doi: 10.1038/nature20149. - DOI - PMC - PubMed
    1. Amaral PP, Mattick JS. Noncoding RNA in development. Mamm Genome. 2008;19:454–492. doi: 10.1007/s00335-008-9136-7. - DOI - PubMed

Publication types