

Concerted evolution of body mass and cell size: similar patterns among species of birds (Galliformes) and mammals (Rodentia)
- PMID: 29540429
- PMCID: PMC5936057
- DOI: 10.1242/bio.029603
Concerted evolution of body mass and cell size: similar patterns among species of birds (Galliformes) and mammals (Rodentia)
Abstract
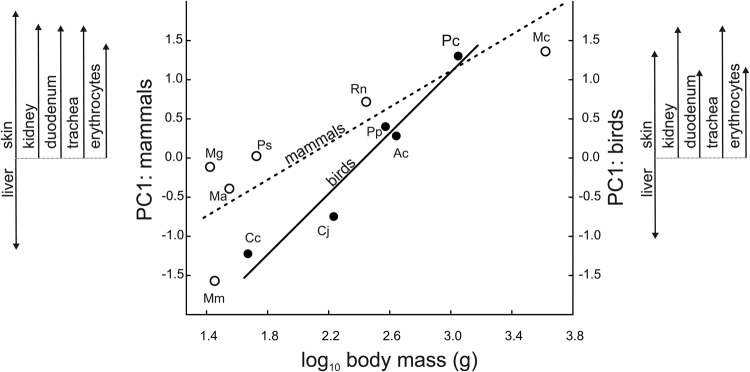
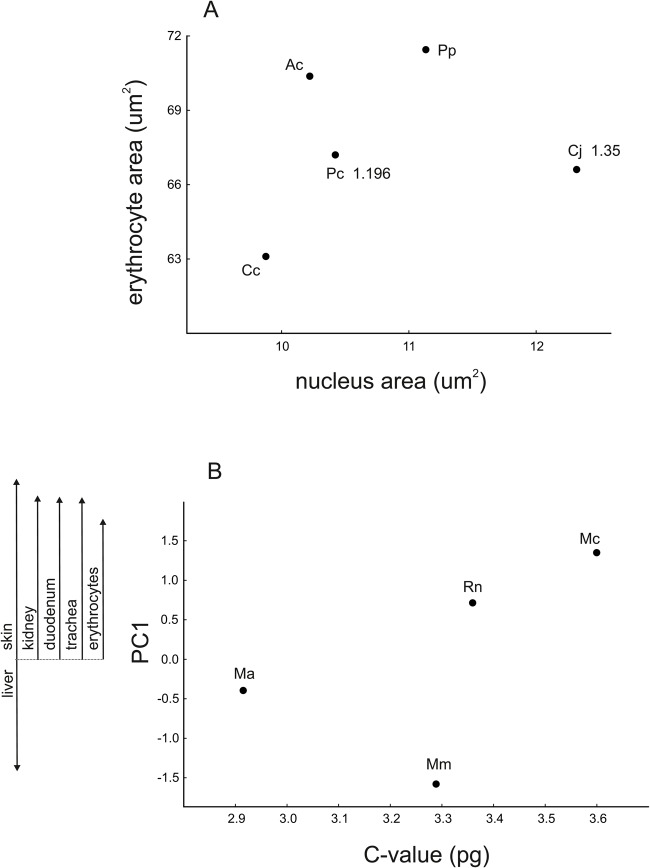
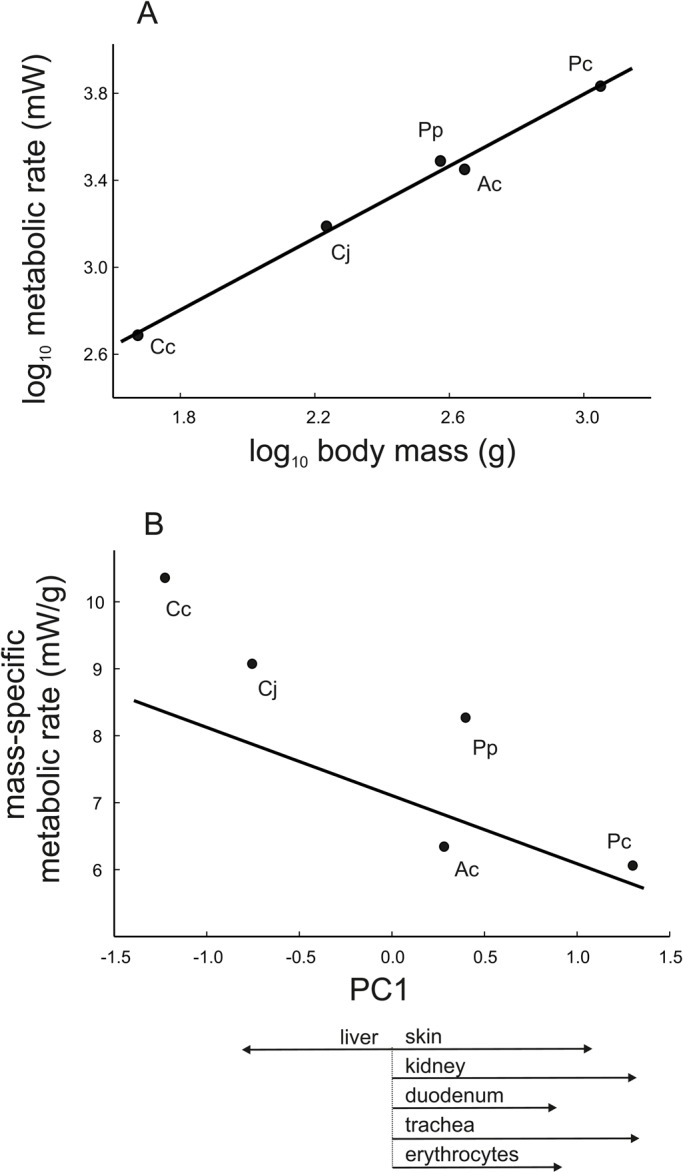
Cell size plays a role in body size evolution and environmental adaptations. Addressing these roles, we studied body mass and cell size in Galliformes birds and Rodentia mammals, and collected published data on their genome sizes. In birds, we measured erythrocyte nuclei and basal metabolic rates (BMRs). In birds and mammals, larger species consistently evolved larger cells for five cell types (erythrocytes, enterocytes, chondrocytes, skin epithelial cells, and kidney proximal tubule cells) and evolved smaller hepatocytes. We found no evidence that cell size differences originated through genome size changes. We conclude that the organism-wide coordination of cell size changes might be an evolutionarily conservative characteristic, and the convergent evolutionary body size and cell size changes in Galliformes and Rodentia suggest the adaptive significance of cell size. Recent theory predicts that species evolving larger cells waste less energy on tissue maintenance but have reduced capacities to deliver oxygen to mitochondria and metabolize resources. Indeed, birds with larger size of the abovementioned cell types and smaller hepatocytes have evolved lower mass-specific BMRs. We propose that the inconsistent pattern in hepatocytes derives from the efficient delivery system to hepatocytes, combined with their intense involvement in supracellular function and anabolic activity.
Keywords: Allometry; BMR; Body size; Concerted evolution; Interspecific scaling; Karyoplasmic ratio; Metabolic rate; Optimal cell size; Species diversity.
© 2018. Published by The Company of Biologists Ltd.
Conflict of interest statement
Competing interestsThe authors declare no competing or financial interests.
Figures
Similar articles
-
Mice divergently selected for high and low basal metabolic rates evolved different cell size and organ mass.J Evol Biol. 2014 Mar;27(3):478-87. doi: 10.1111/jeb.12306. Epub 2014 Jan 13. J Evol Biol. 2014. PMID: 24417348
-
Concerted evolution of body mass, cell size and metabolic rate among carabid beetles.J Insect Physiol. 2021 Jul;132:104272. doi: 10.1016/j.jinsphys.2021.104272. Epub 2021 Jun 26. J Insect Physiol. 2021. PMID: 34186071
-
Not all cells are equal: effects of temperature and sex on the size of different cell types in the Madagascar ground gecko Paroedura picta.Biol Open. 2017 Aug 15;6(8):1149-1154. doi: 10.1242/bio.025817. Biol Open. 2017. PMID: 28630354 Free PMC article.
-
Body size, energy metabolism and lifespan.J Exp Biol. 2005 May;208(Pt 9):1717-30. doi: 10.1242/jeb.01556. J Exp Biol. 2005. PMID: 15855403 Review.
-
Membranes and the setting of energy demand.J Exp Biol. 2005 May;208(Pt 9):1593-9. doi: 10.1242/jeb.01482. J Exp Biol. 2005. PMID: 15855390 Review.
Cited by
-
Scaling of thermal tolerance with body mass and genome size in ectotherms: a comparison between water- and air-breathers.Philos Trans R Soc Lond B Biol Sci. 2019 Aug 5;374(1778):20190035. doi: 10.1098/rstb.2019.0035. Epub 2019 Jun 17. Philos Trans R Soc Lond B Biol Sci. 2019. PMID: 31203753 Free PMC article.
-
Effects of thermal and oxygen conditions during development on cell size in the common rough woodlice Porcellio scaber.Ecol Evol. 2020 Aug 18;10(17):9552-9566. doi: 10.1002/ece3.6683. eCollection 2020 Sep. Ecol Evol. 2020. PMID: 32953083 Free PMC article.
-
Coevolution of body size and metabolic rate in vertebrates: a life-history perspective.Biol Rev Camb Philos Soc. 2020 Oct;95(5):1393-1417. doi: 10.1111/brv.12615. Epub 2020 Jun 10. Biol Rev Camb Philos Soc. 2020. PMID: 32524739 Free PMC article.
-
Systemic orchestration of cell size throughout the body: influence of sex and rapamycin exposure in Drosophila melanogaster.Biol Lett. 2023 Mar;19(3):20220611. doi: 10.1098/rsbl.2022.0611. Epub 2023 Mar 22. Biol Lett. 2023. PMID: 36946132 Free PMC article.
-
Semiautomated pipeline for quantitative analysis of heart histopathology.J Transl Med. 2023 Sep 26;21(1):666. doi: 10.1186/s12967-023-04544-2. J Transl Med. 2023. PMID: 37752535 Free PMC article.
References
LinkOut - more resources
Full Text Sources
Other Literature Sources
