

Sprouty2 loss-induced IL6 drives castration-resistant prostate cancer through scavenger receptor B1
- PMID: 29540470
- PMCID: PMC5887544
- DOI: 10.15252/emmm.201708347
Sprouty2 loss-induced IL6 drives castration-resistant prostate cancer through scavenger receptor B1
Abstract
Metastatic castration-resistant prostate cancer (mCRPC) is a lethal form of treatment-resistant prostate cancer and poses significant therapeutic challenges. Deregulated receptor tyrosine kinase (RTK) signalling mediated by loss of tumour suppressor Sprouty2 (SPRY2) is associated with treatment resistance. Using pre-clinical human and murine mCRPC models, we show that SPRY2 deficiency leads to an androgen self-sufficient form of CRPC Mechanistically, HER2-IL6 signalling axis enhances the expression of androgen biosynthetic enzyme HSD3B1 and increases SRB1-mediated cholesterol uptake in SPRY2-deficient tumours. Systemically, IL6 elevated the levels of circulating cholesterol by inducing host adipose lipolysis and hepatic cholesterol biosynthesis. SPRY2-deficient CRPC is dependent on cholesterol bioavailability and SRB1-mediated tumoral cholesterol uptake for androgen biosynthesis. Importantly, treatment with ITX5061, a clinically safe SRB1 antagonist, decreased treatment resistance. Our results indicate that cholesterol transport blockade may be effective against SPRY2-deficient CRPC.
Keywords: androgen receptor; cholesterol; interleukin 6; prostate cancer; scavenger receptor B1.
© 2018 The Authors. Published under the terms of the CC BY 4.0 license.
Figures
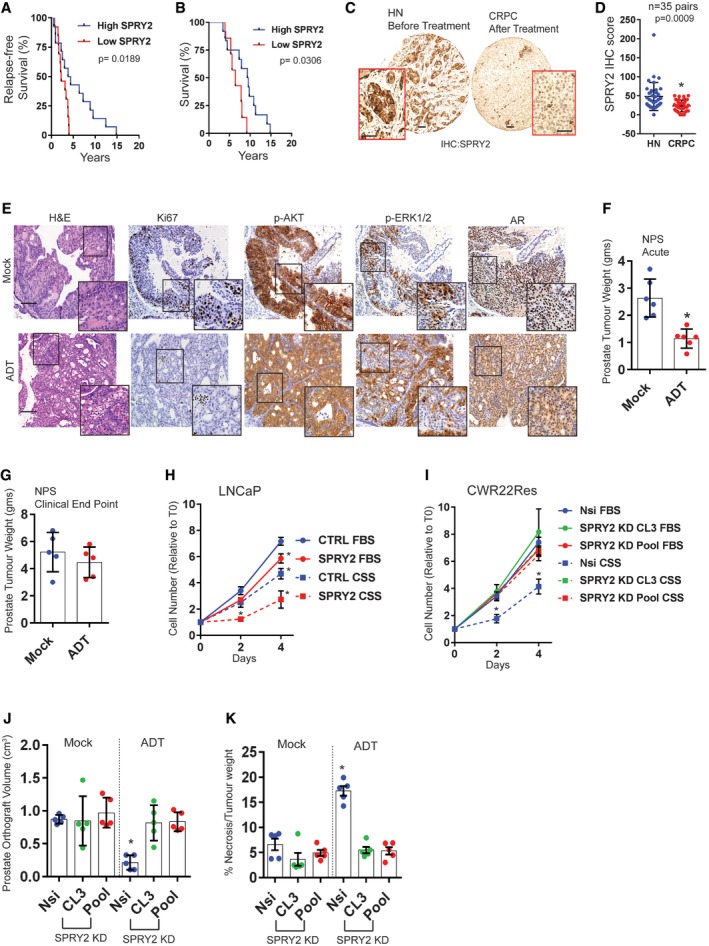
- A
Kaplan–Meier plot for the relapse‐free survival of prostate cancer patients treated with androgen deprivation therapy (ADT). SPRY2‐high patients, n = 14; SPRY2‐low patients, n = 13; log‐rank (Mantel–Cox) test; P = 0.0189.
- B
Kaplan–Meier plot for overall (post‐diagnosis) survival of ADT‐treated prostate cancer patients. SPRY2‐high patients, n = 12; SPRY2‐low patients, n = 7; log‐rank (Mantel–Cox) test; P = 0.0306.
- C
Representative images for immunostaining for SPRY2 in HN (hormone‐naïve) and CRPC (castration‐resistant prostate cancer) matched clinical prostate cancer sections. Scale bars = 100 μm.
- D
Immunostaining for SPRY2 in HN and CRPC matched clinical prostate cancer sections represented as IHC (immunohistochemistry) scores (n = 35 pairs; paired two‐tailed Student's t‐test; *P = 0.0009).
- E
Representative H&E and immunostained images of prostate sections from Nkx3.1 Pten fl/+ Spry2 fl/+ (NPS) mice. Scale bars = 100 μm.
- F
Prostate tumour burden 1 month post‐ADT in NPS mice (n = 6 mice per group; unpaired two‐tailed Student's t‐test; *P = 0.0009).
- G
Prostate tumour burden at clinical endpoint in NPS mice (n = 5 mice per group).
- H, I
Growth rate of LNCaP control and SPRY2‐overexpressing cells (H); and CWR22Res Nsi (non‐silencing) control and CL3 and Pool stable SPRY2 knockdown cell lines (I) relative to T0 (Day 0) in hormone‐proficient (FBS) medium and hormone‐depleted (CSS) medium (n = 3; *P < 0.05; ANOVA Tukey's test).
- J
CWR22Res prostate orthograft tumour volumes from 60‐days timed experiment (n = 5 mice per group; *P < 0.05; ANOVA Tukey's test).
- K
The effects of ADT on the CWR‐22 prostate orthografts from 60‐days timed experiment represented as % necrosis/tumour weight (n = 5 mice per group; *P < 0.05; ANOVA Tukey's test).
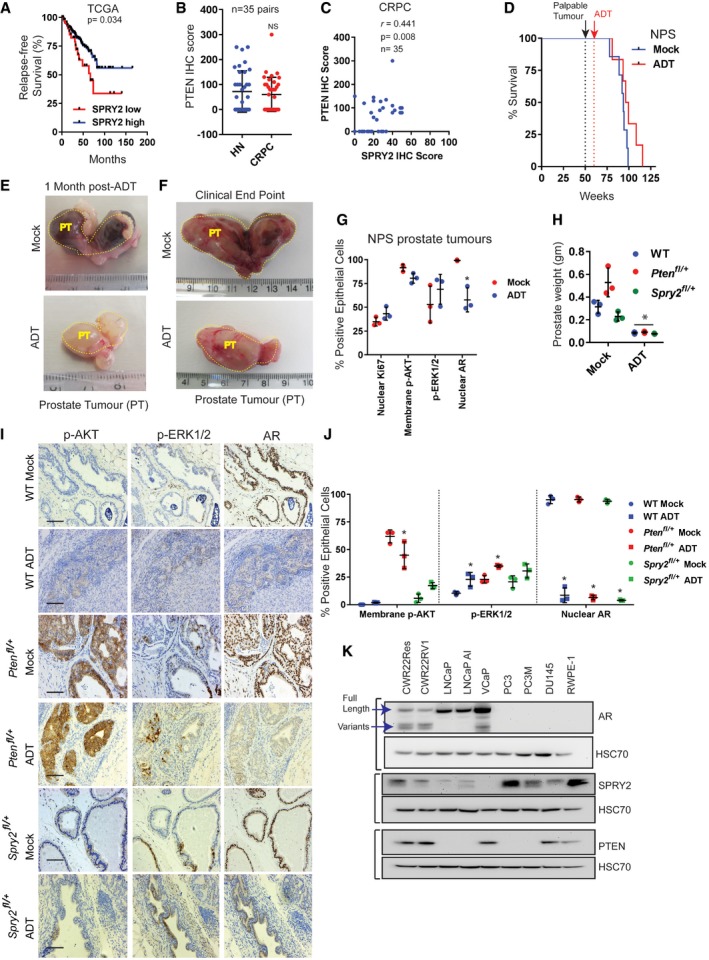
Kaplan–Meier plot for relapse‐free survival in TCGA prostate cancer 2015 dataset showing cases with low SPRY2 mRNA expression z‐scores (RNA seq V2 RSEM) (EXP < −1.3) n = 48 and rest of the cases with higher SPRY2 expression (n = 443); log‐rank (Mantel–Cox) test; P = 0.034.
Immunostaining for PTEN in HN and CRPC matched clinical prostate cancer sections represented as IHC (immunohistochemistry) scores.
Scatter plot showing correlation of PTEN and SPRY2 IHC scores in CRPC samples.
Kaplan–Meier plot for overall survival of NPS mice treated with ADT after palpable tumour was detected after 50 weeks (mock = 7; ADT = 6). After 50 weeks, palpable tumour was detected (black dotted line). The mice were then randomised into mock treatment or ADT treatment (red dotted line).
Representative images of prostate tumours (PT) from mock and ADT‐treated NPS mice 1 month after ADT.
Representative images of prostate tumours from mock and ADT‐treated NPS mice at clinical endpoints (˜77–115 weeks).
IHC quantifications in NPS tumours (n = 3 mice per group; *P < 0.05; ANOVA Sidak's test).
Prostate tissue weights at 1 month following mock or ADT treatment in Nkx3.1 Pten +/+ Spry2 +/+ wild‐type (WT), Nkx3.1 Pten fl/+ and Nkx3.1 Spry2 fl/+ mice (n = 3 mice per group; *P < 0.05 compared to respective mocks; ANOVA Sidak's test).
Representative immunostained images of mouse prostate sections from Nkx3.1 Pten +/+ Spry2 +/+ wild‐type (WT), Nkx3.1 Pten fl/+ and Nkx3.1 Spry2 fl/+ mice 1 month following mock or ADT treatment. Scale bar = 10 μm.
IHC quantifications for Nkx3.1 Pten +/+ Spry2 +/+ wild‐type (WT), Nkx3.1 Pten fl/+ and Nkx3.1 Spry2 fl/+ mock‐ and ADT‐treated control prostate sections (n = 3 mice per group; *P < 0.05 compared to respective mock controls; ANOVA Tukey's test).
Representative immunoblot images for indicated proteins from cell lysates of a panel of prostate cancer cell lines along with non‐tumorigenic RWPE‐1 prostate epithelial cells. HSC70 is used as loading control.
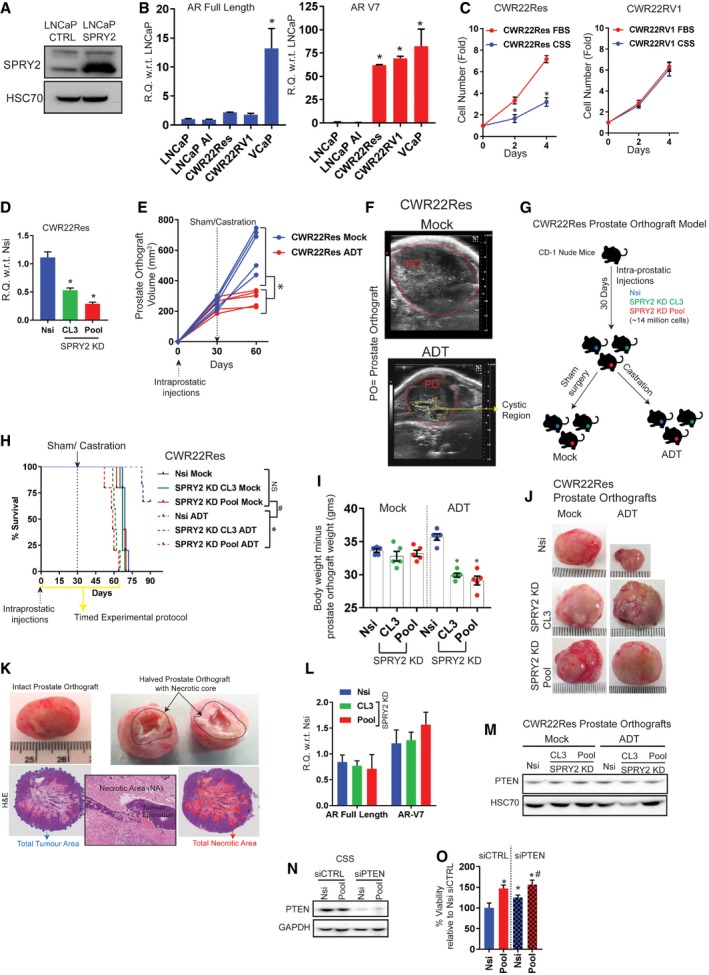
Representative immunoblot images for indicated proteins from cell lysates of control and SPRY2‐overexpressing LNCaP cells. HSC70 is used as loading control.
Relative levels of AR full‐length and AR‐V7 transcripts in indicated cell lines (n = 3; *P < 0.05 ANOVA Sidak's test).
Growth rate of CWR22Res and CWR22RV2 cells relative to Day 0 (T0) in hormone‐proficient (FBS) medium and hormone‐depleted (CSS) medium (n = 3; *P < 0.05; ANOVA Sidak's test).
The relative quantitation of SPRY2 mRNA in CWR22Res prostate cancer cells stably transfected with non‐silencing scrambled shRNA (Nsi) and shRNA targeting SPRY2 (CL3 and Pool SPRY2 knockdown clones) (n = 3; *P < 0.05 compared to Nsi; ANOVA Dunnett's test).
Ultrasound‐based CWR22Res prostate orthograft tumour volume measurements. Each animal is represented by single line and each observation by a data point (n = 5 mice per group; *P < 0.05 at 60 days’ time point; ANOVA Sidak's test).
Representative ultrasound images of mock‐ and ADT‐treated CWR22Res prostate orthografts (POs) at 60 days’ time point (E). The dotted red lines highlight the POs. The cystic region observed in the ultrasound in ADT‐treated orthograft may represent necrotic central core of the orthografts as shown in (K).
Approximately 14 × 106 of CWR22Res‐derived cells (Nsi and SPRY2 KD clones—CL3 and Pool, respectively) were injected in one of the anterior prostate lobes in CD‐1 nude mice. At day 30 post‐intra‐prostatic injections, mice were randomised for further treatments with either sham surgical incision (mock) or androgen deprivation therapy (ADT) by bilateral orchiectomy based on the abdominal palpation for the tumour burden.
Kaplan–Meier plot for overall survival of CD‐1 mice after intra‐prostatic injection of CWR22Res prostate cancer cells (Nsi control or CL3/Pool SPRY2 KD clones). The mice were randomised and treated with sham surgery or ADT (by castration) at 30 days post‐injections when the prostate orthografts were palpable. The clinical end point as per project licence was used as the measure for survival of the tumour‐bearing mice. Yellow line indicates refined 60 days protocol defined from this experiment (n = 5 mice per group; *P < 0.05 between ADT‐treated mice; # P < 0.05 respective orthograft‐bearing mock‐ versus ADT‐treated mice; log‐rank Mantel–Cox test).
Analysis of body weights without the weights of the respective orthografts following ADT and mock treatments (n = 5 mice per group; *P < 0.05 ANOVA Tukey's test).
Representative images of indicated CWR22Res orthografts from mock and ADT‐treated mice (n = 5 mice per group).
Representative images of prostate orthograft (intact and halved). The black dotted area in the halved prostate orthograft marks the necrotic core. Representative H&E images of a prostate orthograft depicting the use of image analyser for calculating the percentage of the necrotic area (red area) normalised to total tumour area (blue dotted area). Insert image shows necrotic area (NA) surrounding the tumour epithelium (TE). Scale bar = 10 μm.
Relative levels of AR full‐length and AR‐V7 transcripts in Nsi control and CL3/Pool SPRY2 KD CWR22Res cell lines (n = 3).
Representative immunoblot images for indicated proteins from cell lysates of CWR22Res orthografts. HSC70 is used as loading control.
Representative immunoblot images for indicated proteins from cell lysates of CWR22Res‐derived cells with different SPRY2 and PTEN expression. GAPDH is used as loading control.
Relative survival measured by WST‐1 assay in CWR22Res cells with transient knockdown of PTEN grown in CSS‐containing medium (n = 3; *P < 0.05 compared to Nsi siCTRL; # P < 0.05 compared to Nsi siPTEN; ANOVA Tukey's test).
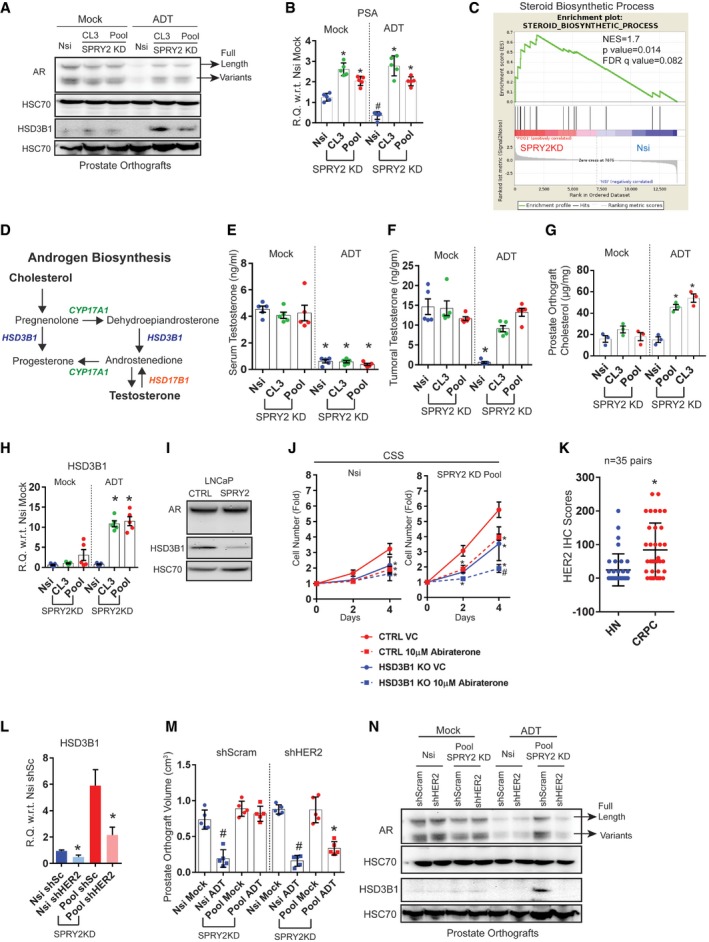
- A
Representative immunoblot images for indicated proteins in lysates from indicated CWR22Res orthografts from 60‐days timed experiment. HSC70 is used a loading control.
- B
Relative quantitation of PSA mRNA in CWR22Res prostate orthografts from 60‐days timed experiment (n = 5 mice per group; # P < 0.05 compared to Nsi mock; *P < 0.05 compared to respective Nsi treatment; ANOVA Tukey's test).
- C
GSEA analysis showing steroid biosynthetic process gene enrichment in CWR22Res SPRY2‐deficient (Pool) cells compared to Nsi control cells.
- D
Schematic presentation of androgen biosynthesis pathway.
- E, F
Serum (E) and intra‐tumoral (F) testosterone from mice bearing indicated orthografts from 60‐days timed experiment measured using ELISA (n = 5 mice per group; *P < 0.05; ANOVA Tukey's test).
- G
Total cholesterol levels in indicated prostate orthografts from 60‐days timed experiment (n = 3 mice per group; *P < 0.05; ANOVA Tukey's test).
- H
Relative quantitation of human 3‐β‐hydroxysteroid dehydrogenase (HSD3B1) mRNA in CWR22Res prostate orthografts from 60‐days timed experiment (n = 5 mice per group; *P < 0.05; ANOVA Tukey's test).
- I
Representative immunoblot images for indicated proteins in lysates from control and SPRY2‐expressing LNCaP cells. HSC70 is used a loading control.
- J
Growth rate of HSD3B1 KO CWR22Res Nsi control and Pool stable SPRY2 KD cells relative to T0 in hormone‐depleted (CSS) medium with indicated treatments (n = 3; *P < 0.05 compared to CTRL VC at the indicated time; # P < 0.05 compared to all treatments at the indicated time; ANOVA Tukey's test).
- K
Immunostaining for HER2 in HN and CRPC matched clinical prostate cancer sections represented as IHC scores (n = 35 pairs; *P < 0.0001; paired two‐tailed Student's t‐test).
- L
Relative quantitation of HSD3B1 mRNA in Nsi and Pool (SPRY2 KD) CWR22Res prostate cancer cells with stable expression of shSc (shScram) or shHER2 (n = 3; *P < 0.05—shHER2 compared to respective shSc; unpaired two‐tailed Student's t‐test).
- M
The effects of HER2 knockdown on CWR22Res orthografts represented as tumour volume (n = 5 mice per group; # P < 0.05 for Nsi orthografts; *P < 0.05 for Pool orthografts; ANOVA Tukey's test).
- N
Representative immunoblot images for indicated proteins in lysates from indicated CWR22Res orthografts from 60‐days timed experiment. HSC70 is used a loading control.
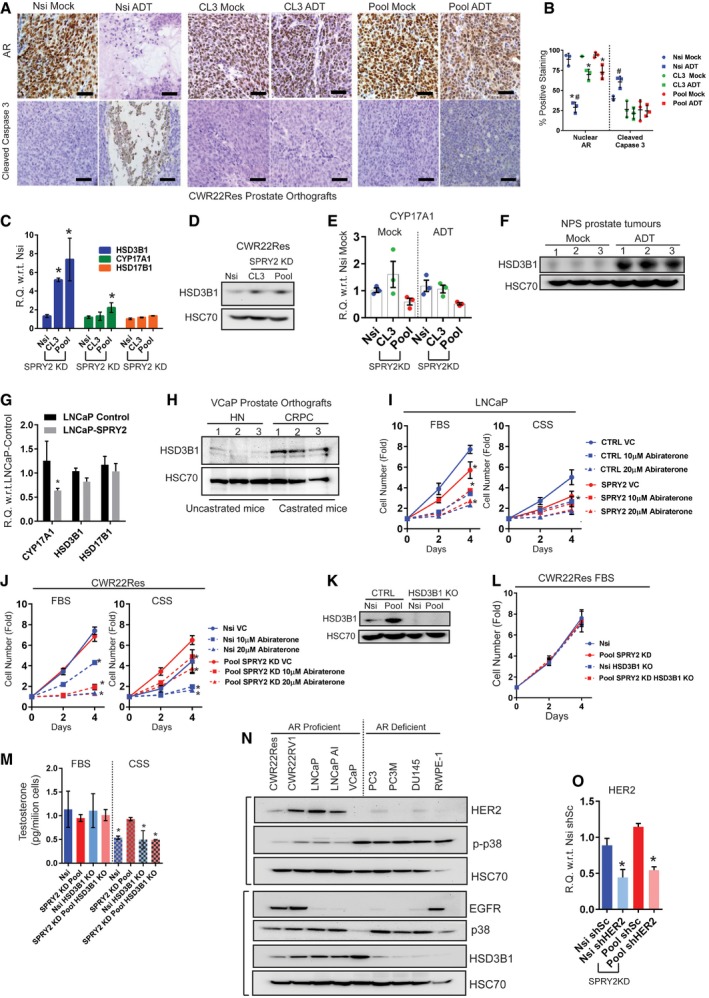
- A
Representative images of indicated CWR22Res prostate orthograft sections immunostained for AR and the apoptotic marker cleaved caspase 3 from mock‐ or ADT‐treated mice (n = 3 mice analysed per group; scale bar = 10 μm).
- B
IHC quantification of indicated markers as presented in (A) (n = 3 mice analysed per group; *P < 0.05 compared to respective mock controls; # P < 0.05 compared to all groups ANOVA Sidak's test).
- C
Relative quantitation of human HSD3B1, CYP17A1 and HSD17B1 mRNA in CWR22Res Nsi control and SPRY2 KD clones (CL3 and Pool) cells (n = 3; *P < 0.05; unpaired two‐tailed Student's t‐test).
- D
Representative immunoblot images for HSD3B1 from cell lysates of indicated CWR22Res cells. HSC70 is used as loading control.
- E
Relative quantitation of human CYP17A1 mRNA in CWR22Res prostate orthografts (n = 3).
- F
Representative immunoblot images for HSD3B1 from tumour lysates from mock‐ and ADT‐treated NPS mice. HSC70 is used as loading control.
- G
Relative quantitation of human HSD3B1, CYP17A1 and HSD17B1 mRNA in control and SPRY2‐expressing LNCaP cells (n = 3; *P = 0.0069; unpaired two‐tailed Student's t‐test).
- H
Representative immunoblot images for HSD3B1 from VCaP prostate orthograft lysates from castrated (ADT) and uncastrated (control) mice. HSC70 is used as loading control.
- I, J
Growth rate of (I) control and SPRY2‐expressing LNCaP cells & (J) Nsi control and Pool SPRY2 KD CWR22Res cells relative to Day 0 (T0) in hormone‐proficient (FBS) medium and hormone‐depleted (CSS) medium (n = 3; *P < 0.05; ANOVA Tukey's test).
- K
Representative immunoblot images for HSD3B1 from indicated CWR22Res cells with HSD3B1 knockout. HSC70 is used as loading control.
- L
Growth rate of Nsi control and Pool SPRY2 KD CWR22Res cells with HSD3B1 knockout relative to Day 0 (T0) in hormone‐proficient (FBS) medium.
- M
Testosterone measured using ELISA in indicated CWR22Res‐derived cells with HSD3B1 knockout grown in medium with 10% FBS or 10% CSS (hormone‐depleted serum) (n = 3; *P < 0.05 compared to Nsi FBS ANOVA Dunnett's test).
- N
Representative immunoblot images for indicated proteins from cell lysates of indicated prostate cancer cell lines and non‐tumorigenic RWPE‐1 cells. HSC70 is used as loading control.
- O
Relative quantitation of HER2 mRNA in Nsi and Pool (SPRY2 KD) CWR22Res prostate cancer cells with stable expression of shSc (shScram) or shHER2 (n = 3; *P < 0.05 shHER2 compared to respective shSc; unpaired two‐tailed Student's t‐test).
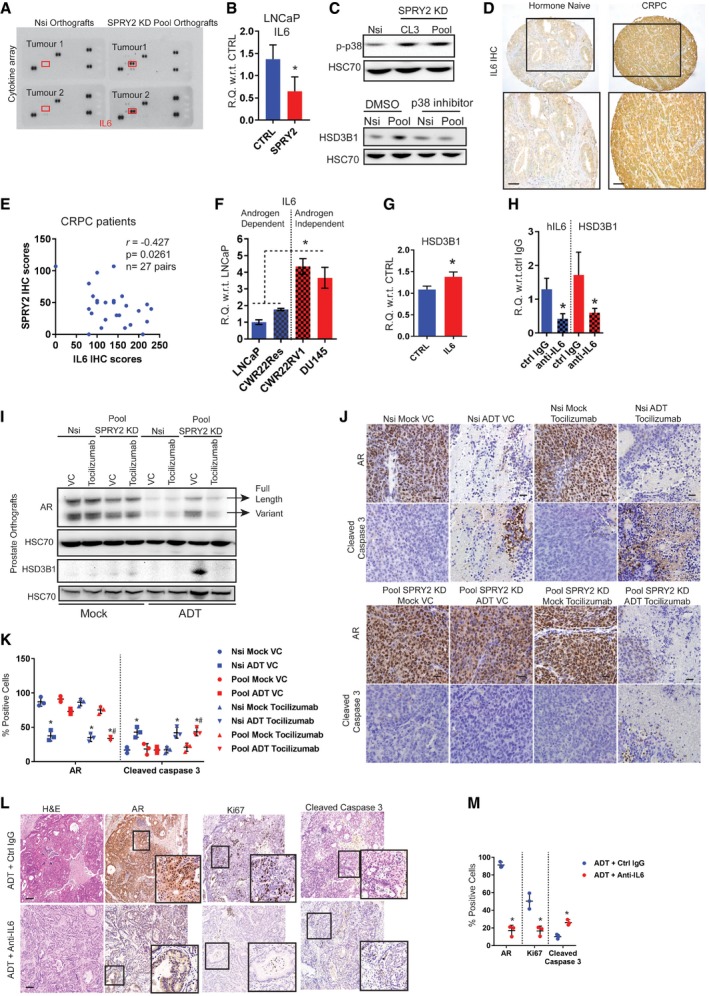
Human cytokine arrays probed with lysates from Nsi and SPRY2 KD (Pool) CWR22Res prostate orthografts (n = 2). Red boxes highlight the location for IL6 detection.
Relative quantitation of IL6 mRNA in control and SPRY2‐expressing LNCaP cells (n = 3; *P = 0.0498; unpaired two‐tailed Student's t‐test).
Representative immunoblot images for indicated proteins from cell lysates of indicated prostate cancer cell lines. For the lower panel, lysates were from cells treated for 16 h with the p38 inhibitor SB203580 (20 μM). HSC70 is used as loading control.
Representative IL6 immunostained images of clinical hormone‐naïve and castration‐resistant (CRPC) prostate cancer samples (n = 35). Scale bars = 100 μm.
Scatter plot showing correlation of SPRY2 and IL6 IHC scores in CRPC patients with evidence of biochemical relapse.
Relative quantitation of IL6 mRNA in indicated cell lines. LNCaP, CWR22Res and DU145 cells were cultured in RPMI medium with 10% FBS. CWR22RV1 cells were cultured in RPMI medium with 10% CSS (hormone‐deficient conditions) (n = 3; *P < 0.05 ANOVA Tukey's test).
Relative quantitation of HSD3B1 mRNA in CWR22Res cells cultured in serum‐free medium with and without 100 pmol/ml hIL6 treatment for 24 h (n = 3; *P = 0.0222; unpaired two‐tailed Student's t‐test).
Relative quantitation of IL6 and HSD3B1 mRNA in Pool (SPRY2 KD clone) CWR22Res cells treated with control or anti‐IL6‐neutralising antibody (0.1 μg/μl) for 16 h (n = 3; *P < 0.05, anti‐IL6 compared to respective ctrl IgG; unpaired two‐tailed Student's t‐test).
Representative immunoblot images for indicated proteins in lysates from indicated CWR22Res orthografts.
Representative images of indicated CWR22Res prostate orthograft sections immunostained for AR and apoptotic marker cleaved caspase 3 from mock or ADT‐treated mice (n = 3 mice analysed per group; scale bar = 10 μm).
IHC quantification of indicated markers as presented in (J) (n = 3 mice analysed per group; *P < 0.05 compared to respective mock controls; # P < 0.05 compared to respective ADT controls ANOVA Tukey's test).
Representative H&E and immunostained images of prostate sections from ADT‐treated NPS mice with and without anti‐IL6 treatment (n = 3 mice analysed per group; scale bar = 10 μm).
IHC quantification of indicated markers as presented in (L) (n = 3 mice analysed per group; *P < 0.05 compared to respective controls; unpaired two‐tailed Student's t‐test).
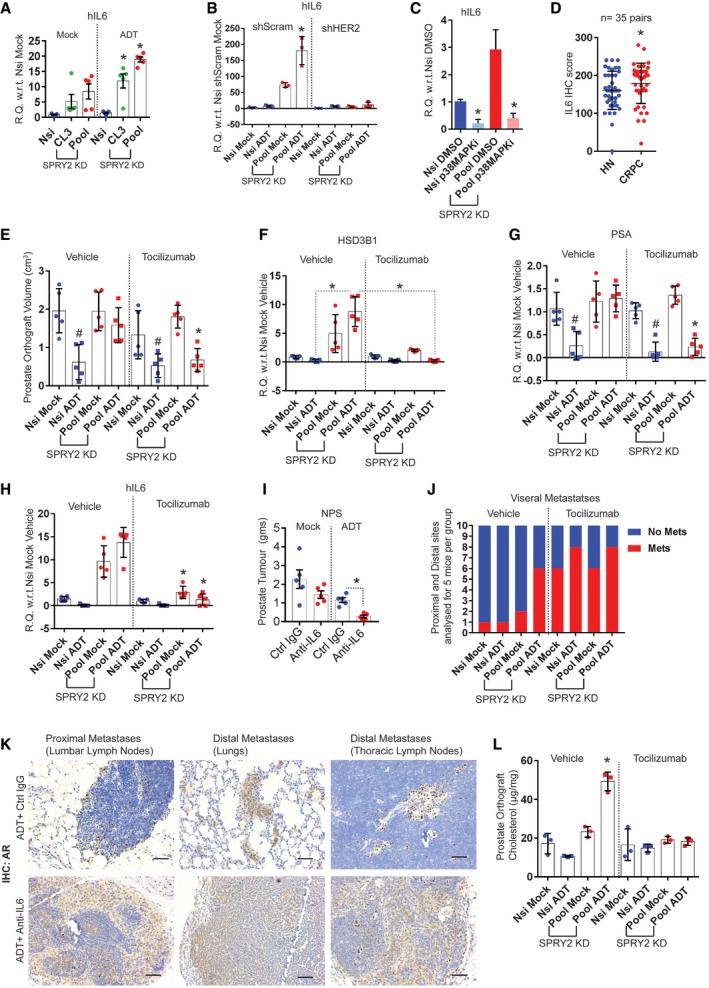
- A, B
Relative quantitation of human IL6 mRNA in the indicated CWR22Res prostate orthografts (n = 5 for A and n = 3 for B mice per group; *P < 0.05 ANOVA Tukey's test).
- C
Relative quantitation of IL6 mRNA in Nsi and SPRY2 KD (Pool) CWR22Res cells treated for 16 h with the p38 inhibitor SB203580 (20 μM) (n = 3; *P < 0.05 compared to respective DMSO control; unpaired two‐tailed Student's t‐test).
- D
Immunostaining for IL6 in HN and CRPC matched clinical prostate cancer sections represented as IHC scores (n = 35 pairs; *P = 0.05 paired two‐tailed Student's t‐test).
- E
The effects of tocilizumab treatment on CWR22Res orthografts represented as tumour volume (n = 5 mice per group; # P < 0.05 for Nsi orthografts; *P < 0.05 for Pool orthografts; ANOVA Dunnett's test).
- F–H
Relative quantitation of human (F) HSD3B1, (G) PSA and (H) IL6 mRNA in CWR22Res prostate orthografts (n = 5 mice per group; # P < 0.05 for Nsi orthografts; *P < 0.05 for Pool orthografts; ANOVA Tukey's test).
- I
Prostate tumour burden in mock‐ or ADT‐treated NPS mice treated for 1 month with anti‐IL6 or anti‐IgG (control antibody) (n = 5 mice per group; *P < 0.05 unpaired two‐tailed Student's t‐test).
- J
Cumulative visceral (proximal and distal as shown in Appendix Fig S1A) metastases incidence analysed from 10 sites per group (two sites: proximal and distal × 5 mice per group) in the mice with indicated CWR22Res orthografts. Chi‐square test: P < 0.001.
- K
Representative AR immunostained images as indicated from NPS mice (n = 3). Scale bars = 10 μm.
- L
Total cholesterol levels in the indicated CWR22Res prostate orthografts (n = 3 mice per group; *P < 0.05 ANOVA Tukey's test).
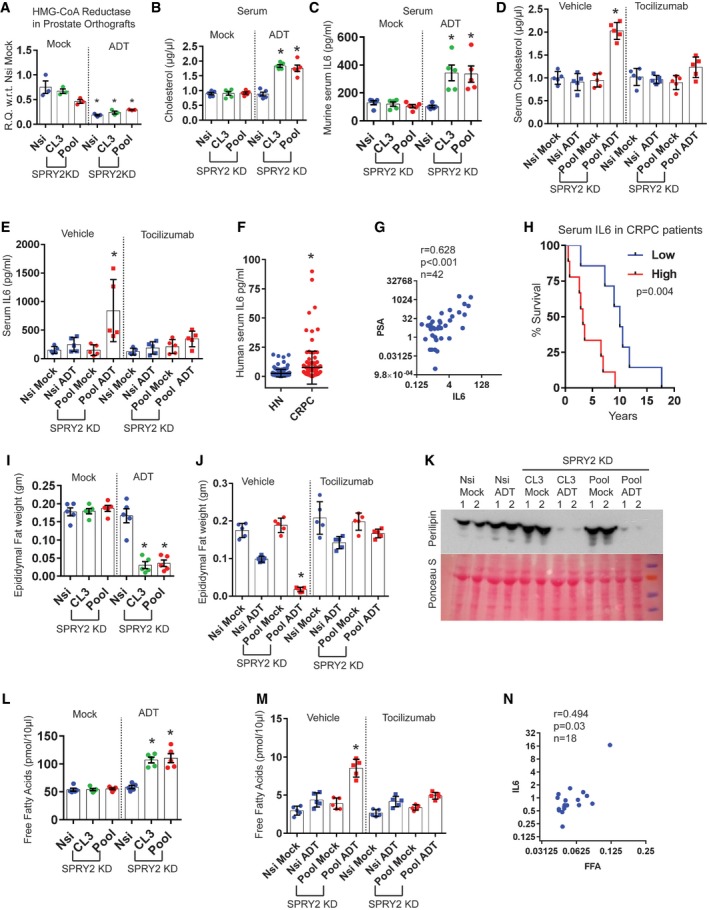
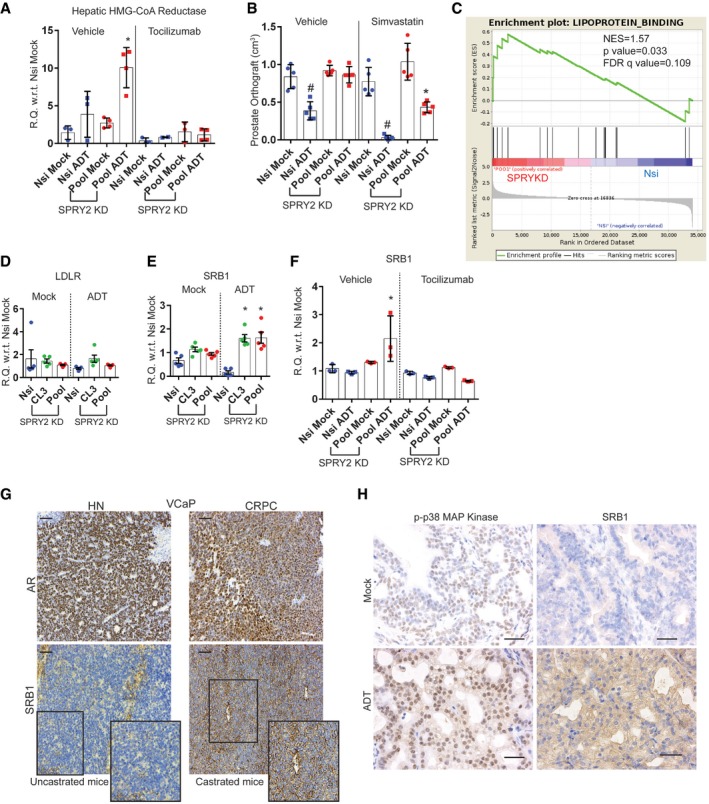
- A
Relative quantitation of human HMGCR mRNA in the indicated CWR22Res orthografts (n = 3 mice per group; *P < 0.05 ANOVA Tukey's test).
- B–E
Total cholesterol (B, D) and IL6 (C, E) in sera from mice with CWR22Res prostate orthografts (n = 5 mice per group; *P < 0.05 ANOVA Tukey's test).
- F
Serum levels of human IL6 in patients with hormone‐naïve (n = 172) or castration‐resistant (n = 129) form of prostate cancer (*P = 0.0002; unpaired two‐tailed t‐test with Welch's correction).
- G
Scatter plot showing correlation of serum levels of PSA and IL6 from prostate cancer patients.
- H
Kaplan–Meier plot for overall (post‐diagnosis) survival of CRPC patients with no evidence of metastases (M0) segregated based on above median (high) and below median (low) serum levels of IL6 (high IL6 = 9; low IL6 = 7; log‐rank Mantel–Cox test; P = 0.004).
- I, J
The epididymal fat weights of mice bearing indicated CWR22Res orthografts (n = 5 mice per group; *P < 0.05 ANOVA Tukey's test).
- K
Representative immunoblot image for perilipin in epididymal adipose tissue lysates from mice with CWR22Res prostate orthografts.
- L, M
Free fatty acids in sera from mice with indicated CWR22Res prostate orthografts (n = 5 mice per group; *P < 0.05 ANOVA Tukey's test).
- N
Scatter plot showing correlation of serum levels of IL6 and free fatty acids (FFAs) from prostate cancer patients.
- A
Relative quantitation of murine Hmgcr mRNA in livers from mice with CWR22Res orthografts as indicated (n = 3 mice per group; *P < 0.05 ANOVA Tukey's test).
- B
The effects of ADT and simvastatin on prostate orthografts represented as volume (n = 5 mice per group; # P < 0.05 for Nsi orthografts; *P < 0.05 for Pool orthografts; ANOVA Tukey's test).
- C
GSEA analyses showed enrichment of lipoprotein binding genes in CWR22Res SPRY2‐deficient prostate cancer cells.
- D–F
Relative quantitation of human LDLR (D) and human SRB1 (E, F) mRNA in CWR22Res prostate orthografts (n = 5 mice per group for D & E and n = 3 mice per group for F; *P < 0.05 ANOVA Tukey's test).
- G
Representative images (n = 3) of AR and SRB1 immunoreactivity in VCaP prostate orthograft grown in intact (uncastrated) or castrated mice, signifying VCaP hormone‐naïve (HN) and VCaP castration resistance (CR) prostate cancer, respectively. Scale bar = 10 μm.
- H
Representative images (n = 3) of immunostained prostate sections from NPS mice as indicated. Scale bar = 10 μm.
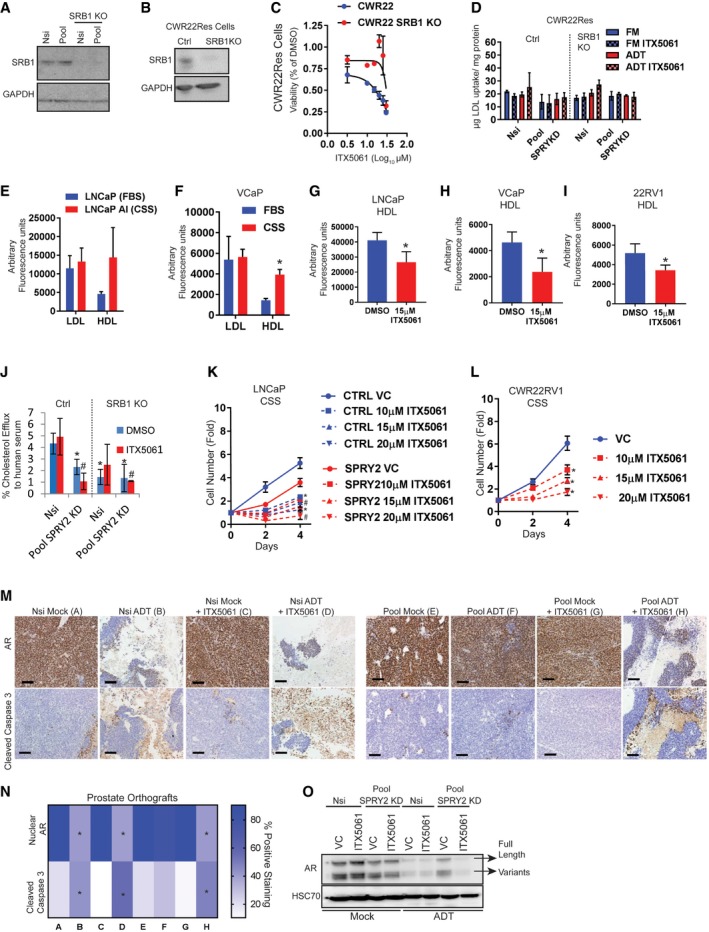
- A, B
Representative immunoblot image for indicated proteins in whole cell lysates from control and SRB1 knockout (KO) cells derived from (A) Nsi control and SPRY2‐deficient (Pool) cells and (B) CWR22Res cells. GAPDH is used as the loading control.
- C
The cytotoxic effects of SRB1 antagonist ITX5061 relative to DMSO on CWR22Res control and SRB1 KO cells cultured for 48 h in RPMI with 10% charcoal‐stripped serum (CSS) mimicking hormone‐deprived (ADT) conditions. IC50 calculated using log (inhibitor) versus response – Variable slope (four parameters) with bottom constraint = 0.0 with GraphPad Prism software. IC50 of ITX5061 in CWR22Res control = 23.87 ± 0.677 and CWR22Res SRB1KO = not calculated due to lack of response (n = 3; IC50 data presented as mean ± SD).
- D
LDL uptake in indicated cells grown in medium with 10% FBS (FM) or 10% charcoal‐stripped serum (ADT) treated with 15 μM ITX5061 (n = 3).
- E
Relative fluorescence in LNCaP (maintained in 10% FBS containing medium) and LNCaP AI (androgen‐independent LNCaP cells maintained in 10% CSS‐containing medium) treated with HDL or LDL bound to 1,1′‐dioctadecyl‐3,3,3′,3′‐tetramethyllindocarbocyanine perchlorate (Dil) [Dil‐HDL or Dil‐LDL] (n = 3).
- F
Relative fluorescence in VCaP prostate cancer cells treated with HDL or LDL bound to 1,1′‐dioctadecyl‐3,3,3′,3′‐tetramethyllindocarbocyanine perchlorate (Dil) [Dil‐HDL or Dil‐LDL] in medium containing 10% FBS or 10% CSS (n = 3; *P = 0.0073 compared to HDL treatment in FBS; unpaired two‐tailed Student's t‐test).
- G–I
Relative fluorescence in LNCaP (G), VCaP (H) and CWR22RV1 (I) cells treated with ITX5061 and HDL bound to 1,1′‐dioctadecyl‐3,3,3′,3′‐tetramethyllindocarbocyanine perchlorate (Dil) [Dil‐HDL] (n = 3; *P < 0.05 compared to HDL treatment in FBS; unpaired two‐tailed Student's t‐test).
- J
% Cholesterol efflux induced by human serum from Nsi control and SPRY2 KD (Pool) CWR22Res with SRB1 knockout (KO) as indicated in presence of 15 μM ITX5061 (n = 3; *P < 0.05 compared to Nsi control DMSO; # P < 0.05 compared to Nsi control ITX5061; ANOVA Tukey's test).
- K
Growth rate of control and SPRY2‐expressing LNCaP cells relative to Day 0 (T0) in medium containing 10% CSS (hormone deficient) with indicated ITX5061 treatments (n = 3; *P < 0.05 compared to LNCaP CTRL; # P < 0.05 compared to LNCaP SPRY2; ANOVA Tukey's test).
- L
Growth rate of CWR22RV1 (CRPC) cells relative to T0 in medium containing 10% CSS (hormone deficient) with indicated ITX5061 treatments (n = 3; *P < 0.05 ANOVA Tukey's test).
- M
Representative images (n = 5) of CWR22Res prostate orthograft sections immunostained for AR and cleaved caspase 3 from mock‐ or ADT‐treated mice. Scale bar = 10 μm.
- N
IHC quantification of indicated markers as presented in (M) (n = 3 mice analysed per group; *P < 0.05 compared to respective controls; unpaired two‐tailed Student's t‐test).
- O
Representative immunoblot images for indicated proteins in lysates from indicated CWR22Res orthografts.
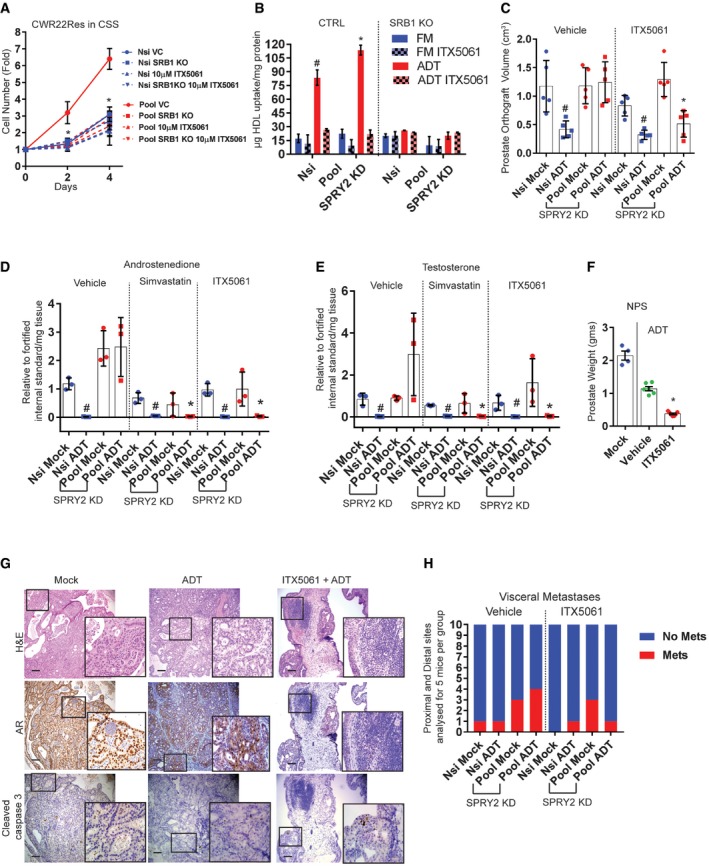
- A
CWR22Res Nsi and SPRY2 (Pool) KD cells were subjected to SRB1 KO and/or treatment with ITX5061 as indicated. Cell numbers were normalised to T0 (Day 0) for each cell line (n = 3; *P < 0.05 ANOVA Tukey's test for all cell lines compared to Pool VC).
- B
HDL uptake in indicated cells grown in medium containing 10% FBS (FM) or 10% charcoal‐stripped serum (ADT) treated with 15 μM ITX5061 (n = 3; *P < 0.05; # P < 0.05 Nsi ADT CTRL compared to Pool ADT CTRL; ANOVA Tukey's test).
- C
The effects of ITX5061 on CWR22Res prostate orthografts represented as tumour volume (n = 5 mice per group; # P < 0.05 for Nsi orthografts; *P < 0.05 for Pool orthografts; ANOVA Tukey's test).
- D, E
LC‐MS‐based detection of androstenedione (testosterone precursor) (# P < 0.05 for Nsi orthografts compared to Pool ADT vehicle; *P < 0.05 for Pool orthografts; ANOVA Tukey's test) (D) and testosterone (# P < 0.05 unpaired two‐tailed Student's t‐test Nsi mock compared to Nsi ADT for respective treatments; *P < 0.05 ANOVA Tukey's test compared to Pool ADT vehicle) (E) in CWR22Res prostate orthografts from mice treated as indicated (n = 3 mice per group).
- F
Prostate tumour weights from NPS mice treated with ITX5061 (n = 6; *P < 0.05 ANOVA Tukey's test).
- G
Representative images (n = 5) of H&E and immunostained prostate sections from NPS mice treated with ITX5061. Scale bar = 10 μm.
- H
Incidence of cumulative visceral metastases was analysed from proximal and distal metastatic sites from mice bearing CWR22Res Nsi or Pool SPRY2 KD orthografts, receiving treatments as indicated. Classification of proximal and distal metastases is shown in Appendix Fig S1A.
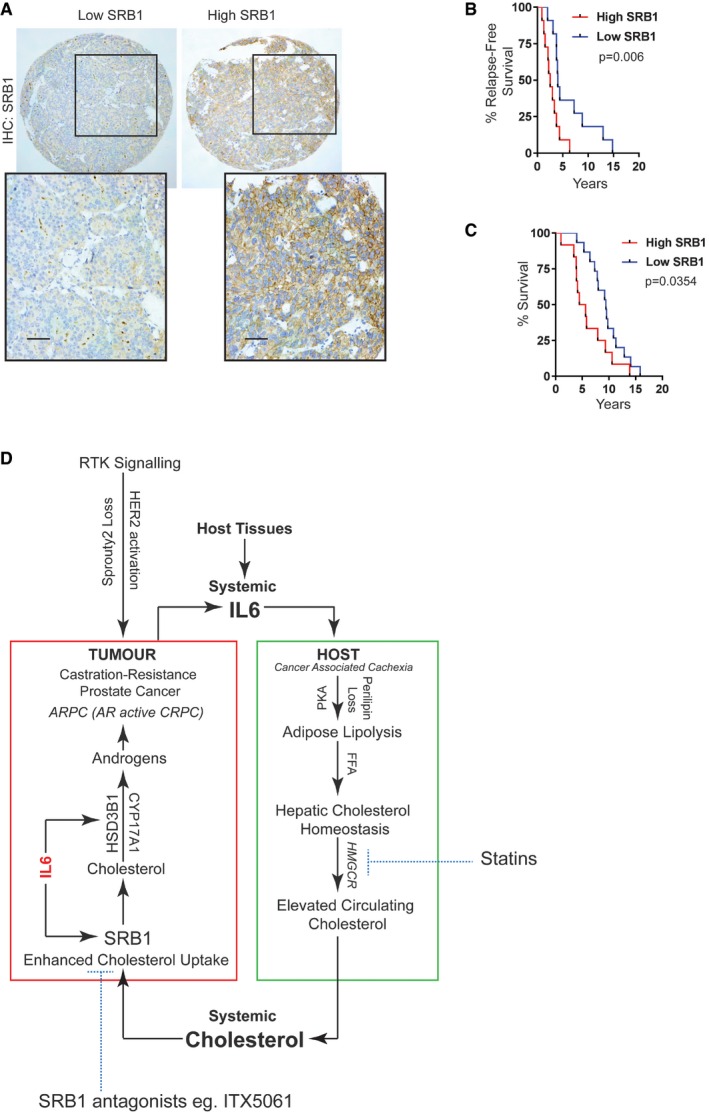
Representative SRB1 immunostained images of prostate cancer samples. High SRB1 (n = 47) represents patients with SR‐B1 IHC score above median, and low SRB1 (n = 43) represents patients with SR‐B1 IHC score below median (scale bar = 10 μm).
Kaplan–Meier plot for relapse‐free survival of ADT‐treated prostate cancer patients (SRB1‐high patients = 11; SRB1‐low patients = 11; log‐rank Mantel–Cox test; P = 0.006).
Kaplan–Meier plot for overall (post‐diagnosis) survival of patients treated with ADT (SRB1‐high patients, n = 12; SRB1‐low patients, n = 16; log‐rank Mantel–Cox test; P = 0.0354).
SPRY2 deficiency facilitates progression of prostate cancer to CRPC through HER2‐mediated induction of IL6, HSD3B1 and SRB1. IL6 cytokine axis, in a paracrine manner, induces host adipose lipolysis and hepatic cholesterol synthesis, resulting in increased circulating cholesterol. ADT‐resistant tumours take up cholesterol through SRB1 for androgen biosynthesis. Normalising the systemic cholesterol homeostasis by statins and blocking SRB1‐mediated cholesterol uptake by tumours may serve as potential approaches to diminish treatment resistance in a subset of prostate cancers with the SPRY2 deficiency or HER2 activation.
References
Publication types
MeSH terms
Substances
Grants and funding
LinkOut - more resources
Full Text Sources
Other Literature Sources
Molecular Biology Databases
Research Materials
Miscellaneous
