. 2018 Apr 27;293(17):6434-6448.
doi: 10.1074/jbc.RA117.000940. Epub 2018 Mar 14.

Pharmacologically targeting the myristoylation of the scaffold protein FRS2α inhibits FGF/FGFR-mediated oncogenic signaling and tumor progression

Affiliations

Pharmacologically targeting the myristoylation of the scaffold protein FRS2α inhibits FGF/FGFR-mediated oncogenic signaling and tumor progression

Qianjin Li et al. J Biol Chem. .

Abstract

Fibroblast growth factor (FGF)/FGF receptor (FGFR) signaling facilitates tumor initiation and progression. Although currently approved inhibitors of FGFR kinase have shown therapeutic benefit in clinical trials, overexpression or mutations of FGFRs eventually confer drug resistance and thereby abrogate the desired activity of kinase inhibitors in many cancer types. In this study, we report that loss of myristoylation of fibroblast growth factor receptor substrate 2 (FRS2α), a scaffold protein essential for FGFR signaling, inhibits FGF/FGFR-mediated oncogenic signaling and FGF10-induced tumorigenesis. Moreover, a previously synthesized myristoyl-CoA analog, B13, which targets the activity of N-myristoyltransferases, suppressed FRS2α myristoylation and decreased the phosphorylation with mild alteration of FRS2α localization at the cell membrane. B13 inhibited oncogenic signaling induced by WT FGFRs or their drug-resistant mutants (FGFRsDRM). B13 alone or in combination with an FGFR inhibitor suppressed FGF-induced WT FGFR- or FGFRDRM-initiated phosphoinositide 3-kinase (PI3K) activity or MAPK signaling, inducing cell cycle arrest and thereby inhibiting cell proliferation and migration in several cancer cell types. Finally, B13 significantly inhibited the growth of xenograft tumors without pathological toxicity to the liver, kidney, or lung in vivo In summary, our study suggests a possible therapeutic approach for inhibiting FGF/FGFR-mediated cancer progression and drug-resistant FGF/FGFR mutants.

Keywords: B13; FRS2; cancer; drug action; fibroblast growth factor (FGF); fibroblast growth factor receptor (FGFR); myristoylation; protein acylation.


Conflict of interest statement

The authors declare that they have no conflicts of interest with the contents of this article

Figures
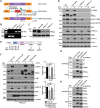
Figure 1.
Figure 1.
Loss of FRS2α myristoylation inhibits FRS2α tyrosine phosphorylation, interaction of FRS2α with downstream proteins SHP2 and GRB2, and FGF/FGFR signaling. A, schematic diagram of CRISPR/Cas9-mediated FRS2α knockout. Cas9 protein, gRNA vector expressing guide RNA that targets downstream of the FRS2α translational start codon, and donor vector containing homologous arms and functional cassette (GFP-Puro) were introduced into NIH-3T3 cells by co-transfection. gRNA vector expressing scrambled RNA was used as control. The locations of primers are indicated for PCR analysis. GF and RR primers were used for detection of WT, and RF and RR primers were used for detection of knockout cells. B, confirmation of homozygous knockout by PCR. Two individual single colonies named FRS2αΔ-1 and FRS2αΔ-2 were selected. Genomic DNA was extracted for use as a template for PCR analysis. C, confirmation of FRS2αΔ-1 and FRS2αΔ-2. Total lysate from two isolated cell lines were analyzed by Western blotting. D, loss of FRS2α inhibits FGF2-mediated signaling. NIH-3T3 WT, FRS2αΔ-1, and FRS2αΔ-2 cell lines were stimulated with/without FGF2 (50 μg/ml, 10 min). Protein lysates were analyzed for FRS2α, p-FRS2α, p-AKT(Thr-308)/p-AKT(Ser-473), total AKT, p-ERK1/2, ERK2, p-PLCγ1, PLCγ1, and γ-tubulin. The red arrow indicates FRS2α shifting toward higher molecular weight with FGF2 induction. E, the protein sequence at the N terminus of WT FRS2α and point mutation in the myristoylation (Myr) site (G2A) resulting in loss of myristoylation. F, FRS2αΔ-1 cells were transduced with control vector, FRS2α(WT), or FRS2α(G2A). Cells were treated with/without FGF2 induction (50 μg/ml, 10 min), including WT NIH-3T3 alone for comparison. Protein lysates were analyzed for FRS2α, p-FRS2α, p-AKT, total AKT, p-ERK1/2, ERK2, RFP, and γ-tubulin. Expression levels of p-AKT and p-ERK1/2 with FGF2 induction were quantified by optical density, as shown in the bar graphs. The level in the WT group was set as 1. Values are mean ± S.D. (error bars) from three independent experiments. N.S., no significance. **, p < 0.01. G and H, the lysates from cells treated with FGF2 (50 μg/ml, 10 min) were immunoprecipitated with the FRS2α antibody, and phosphotyrosine (pY), phosphothreonine (pT), and FRS2α levels were detected by immunoblotting (G). The immunoprecipitates pulled down by the FRS2α antibody were also immunoblotted with GRB2 or SHP2 antibody (H).
Figure 2.
Figure 2.
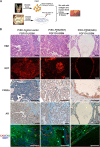
Loss of FRS2α myristoylation inhibits paracrine FGF10-induced tumorigenesis. A, diagram of the in vivo prostate regeneration assay. Freshly isolated prostate epithelial cells were transduced with control vector, FRS2α(WT), or FRS2α(G2A) by lentiviral infection. UGSM cells isolated from 16.5-day-old mouse embryos were transduced with FGF10 or GFP (control) by lentiviral infection. The transduced UGSM cells were mixed with the transduced prostate epithelial cells and collagen and implanted under the kidney capsule of SCID mice. The regenerated prostate tissues were harvested after an 8-week incubation. The regenerated tissues derived from GFP-UGSM (control) are presented in Fig. S2. B, H&E staining, RFP signal, and IHC staining of FRS2α, AR, and CK5 (red)/CK8 (green)/DAPI (blue) in regenerated tissue derived from PrEC-control vector + FGF10-UGSM, PrEC-FRS2α(WT) + FGF10-UGSM, or PrEC-FRS2α(G2A) + FGF10-UGSM groups. These three groups represent grafts containing prostate epithelial cells transduced with control vector, FRS2α(WT), or FRS2α(G2A) mixed with FGF10-UGSM, respectively. Scale bar, 100 μm.
Figure 3.
Figure 3.
B13, an analog of myristoyl-CoA, inhibits the myristoylation and cell membrane localization of FRS2α. A, structures of myristoyl-CoA and B13. B, B13 inhibits NMT1 enzymatic activity. Purified human NMT1 (70 nm) was incubated with a synthesized peptide substrate and myristoyl-CoA (1 μm) with different concentrations of B13. NMT1 activity was calculated according to fluorescence intensity. IC50 of B13 is 79.1 μm. C, myristoylation of FRS2α is inhibited by B13. FRS2αΔ-1 cells were transduced with FLAG-tagged FRS2α(WT). Cells were pretreated with 0, 10, 15, 20, and 25 μm B13 for 2 h. The treated cells were cultured with myristic acid–azide (12-azidododecanoic acid) (30 μm) for 16 h. The cell lysates were subjected to immunoprecipitation with anti-FLAG antibodies. Immunoprecipitated proteins underwent the click chemistry reaction with biotin-alkyne, and myristoylated proteins were detected using horseradish peroxidase–conjugated streptavidin via immunoblotting. D, genetic mutation leading to loss of myristoylation inhibits the association of FRS2α with the cell membrane. FRS2αΔ cells were transduced with control vector (V), FRS2α(WT), or the myristoylation-deficient mutant FRS2α(G2A), and the expression levels of FRS2α were detected in the cytosol and cell membrane fractions. E, the cell membrane protein fractions were isolated from NIH-3T3 cells treated with/without B13 (15 μm) and with/without FGF2 induction (50 μg/ml, 10 min). 100 μg of the cytosol proteins (60 μl) and 20 μg of the cell membrane proteins (20 μl) were loaded. The protein levels of total FRS2α and p-FRS2α were measured in each fraction. Glyceraldehyde-3-phosphate dehydrogenase (GAPDH) and caveolin-1 were markers of the cytosol and cell membrane fractions, respectively. Immunoblots of FRS2α at long and short exposure times are displayed. Error bars, S.D.
Figure 4.
Figure 4.
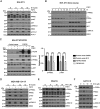
B13 inhibits FGF/FGFR-mediated signaling in cells expressing endogenous or ectopic FGFR2. A, NIH-3T3 cells were treated with 0, 5, 10, and 15 μm of B13 or DMSO for 16 h and with/without FGF2 (50 ng/ml) induction for 10 min. B, NIH-3T3 cells were cultured with/without B13 (15 μm) for 0, 1, 3, 6, 12, and 24 h and with/without FGF2 induction (50 ng/ml) for 10 min. The red arrow indicates FRS2α shifting toward higher molecular weight with FGF2 induction. C, NIH-3T3 cells were transduced with control vector (FUCRW) or FGFR2 by lentiviral infection. Cells were treated with/without B13 (15 μm, 16 h) and with/without FGF2 (50 ng/ml, 10 min). The expression levels of p-FRS2α and p-AKT with FGF2 induction were quantified by optical density, as shown in the bar graphs. The optical density of proteins from cells treated with DMSO was set as 1. Values are mean ± S.D. (error bars), and the data are from three independent experiments. **, p < 0.01. D–F, MDA-MB-134-VI (D), SNU16 (E), and KATO III (F) cancer cells were treated with 0, 5, 10, or 15 μm B13 for 16 h and with/without FGF2 (50 ng/ml, 10 min) induction. The protein levels of FRS2α, p-FRS2α, p-AKT, total AKT, p-ERK1/2, and ERK2 were analyzed in total protein lysates.
Figure 5.
Figure 5.
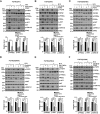
The myristoyl-CoA analog inhibitor B13 or in combination with an FGFR inhibitor (PD173074 or dovitinib) suppresses FGF/FGFR or FGFR2DRM-mediated oncogenic signaling. NIH-3T3 cells were transduced with FGFR2 (A and B), FGFR2(N549K) (C and D), or FGFR2(V564I) (E and F) by lentiviral infection. 3T3-FGFR2 cells (A and B), 3T3-FGFR2(N549K) (C and D), and 3T3-FGFR2(V564I) cells (E and F) were treated with/without B13 (15 μm, 16 h), PD173074 (0.1 μm, 1.5 h), or dovitinib (0.3 μm, 1.5 h), and induced with/without FGF2 (50 ng/ml, 10 min). Total cell lysates were examined for p-FRS2α, FRS2α, p-AKT, AKT, p-ERK1/2, ERK2, p-FGFR, and FGFR2. The relative protein levels of p-FRS2α and p-AKT with FGF2 induction were quantified by optical density, as shown in the bar graphs. The optical density from cells treated with DMSO was set as 1. Values are mean ± S.D. (error bars) and the data are from three independent experiments. N.S., no significance. *, p < 0.05; **, p < 0.01; ***, p < 0.001.
Figure 6.
Figure 6.
B13 inhibits proliferation and migration of cancer cells and arrests the cell cycle and growth of xenograft tumors. A–C, SNU16 (A), KATO III (B), and AGS (C) cells were grown in the ATCC-recommended medium with FGF2 (50 ng/ml) and 0, 1, 5, 10, 15, or 20 μm B13. Cell proliferation was measured by the MTT assay at day 0, 1, 2, 3, 4, and 5. IC50 values of B13 were calculated on day 4. D, inhibition of MDA-MB-134-VI cell migration by B13 measured using the Transwell assay. The number of migrated MDA-MB-134-VI cells in the presence of FGF2 (50 ng/ml) with/without B13 treatment (15 μm) was counted. E–G, SNU16, KATO III, and AGS cancer cells were grown in the presence of FGF2 (50 ng/ml) with/without B13 at the indicated concentrations for 3 days. Cells were stained by propidium iodide and analyzed by flow cytometry. G0/G1, S, and G2/M phases were recorded. Values are mean ± S.D. (error bars). *, p < 0.05; **, p < 0.01. H, KATO III, SNU16, and AGS cells were grown in the medium with/without B13 at the indicated concentrations for 3 days. The expression levels of p21, p27, CDK2, CDK4, CGK6, and γ-tubulin (loading control) were examined by immunoblotting.
Figure 7.
Figure 7.
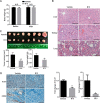
B13 inhibits FGFR-mediated xenograft tumors. SNU16 cells were inoculated subcutaneously in SCID mice. Host mice carrying SNU16 tumors were treated with vehicle control or B13. A, the body weight of SCID mice carrying SNU 16 tumors was recorded before and after B13 treatment. B, H&E staining of the liver, kidney, and lung from mice treated with vehicle or B13. Scale bar, 100 μm. C, the size and weight of xenograft tumors were recorded and measured. Values are represented as mean ± S.E. (error bars). *, p < 0.05. D, expression levels of Ki-67 and CD34 in xenograft tumors derived from mice treated with vehicle or B13 were analyzed by IHC staining and quantified based on the intensity of IHC staining. Scale bar, 100 μm. The expression levels of Ki67 and CD34 in xenograft tumors treated with vehicle were set as 1. Values are represented as mean ± S.D. *, p < 0.05; **, p < 0.01.

Similar articles

Cited by

References

    1. Eswarakumar V. P., Lax I., and Schlessinger J. (2005) Cellular signaling by fibroblast growth factor receptors. Cytokine Growth Factor Rev. 16, 139–149 10.1016/j.cytogfr.2005.01.001 - DOI - PubMed
    1. Dieci M. V., Arnedos M., Andre F., and Soria J. C. (2013) Fibroblast growth factor receptor inhibitors as a cancer treatment: from a biologic rationale to medical perspectives. Cancer Discov. 3, 264–279 10.1158/2159-8290.CD-12-0362 - DOI - PubMed
    1. Nagamatsu H., Teishima J., Goto K., Shikuma H., Kitano H., Shoji K., Inoue S., and Matsubara A. (2015) FGF19 promotes progression of prostate cancer. Prostate 75, 1092–1101 10.1002/pros.22994 - DOI - PubMed
    1. Feng S., Wang J., Zhang Y., Creighton C. J., and Ittmann M. (2015) FGF23 promotes prostate cancer progression. Oncotarget 6, 17291–17301 - PMC - PubMed
    1. Corn P. G., Wang F., McKeehan W. L., and Navone N. (2013) Targeting fibroblast growth factor pathways in prostate cancer. Clin. Cancer Res. 19, 5856–5866 10.1158/1078-0432.CCR-13-1550 - DOI - PMC - PubMed

Publication types

MeSH terms

Substances