. 2018 May 4;293(18):6659-6671.
doi: 10.1074/jbc.RA117.000470. Epub 2018 Mar 14.

Adaptive remodeling of skeletal muscle energy metabolism in high-altitude hypoxia: Lessons from AltitudeOmics

Affiliations

Adaptive remodeling of skeletal muscle energy metabolism in high-altitude hypoxia: Lessons from AltitudeOmics

Adam J Chicco et al. J Biol Chem. .

Abstract

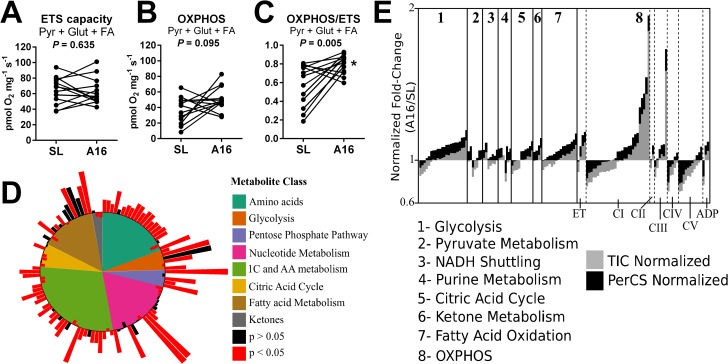
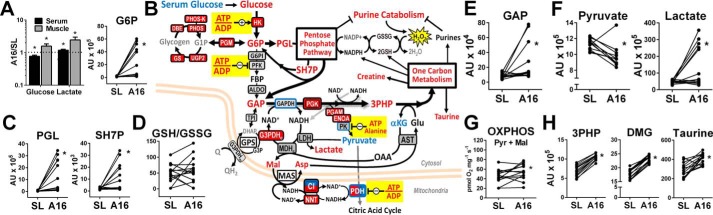
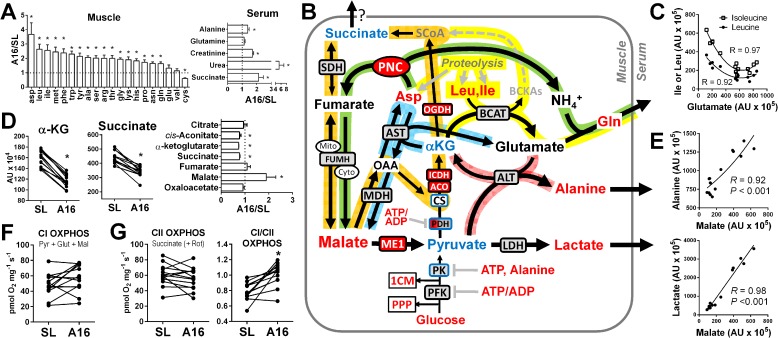
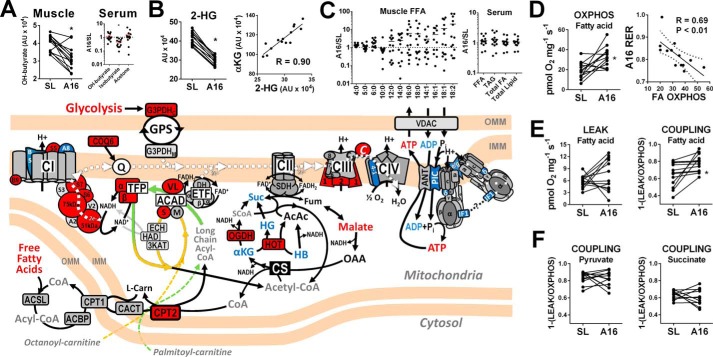
Metabolic responses to hypoxia play important roles in cell survival strategies and disease pathogenesis in humans. However, the homeostatic adjustments that balance changes in energy supply and demand to maintain organismal function under chronic low oxygen conditions remain incompletely understood, making it difficult to distinguish adaptive from maladaptive responses in hypoxia-related pathologies. We integrated metabolomic and proteomic profiling with mitochondrial respirometry and blood gas analyses to comprehensively define the physiological responses of skeletal muscle energy metabolism to 16 days of high-altitude hypoxia (5260 m) in healthy volunteers from the AltitudeOmics project. In contrast to the view that hypoxia down-regulates aerobic metabolism, results show that mitochondria play a central role in muscle hypoxia adaptation by supporting higher resting phosphorylation potential and enhancing the efficiency of long-chain acylcarnitine oxidation. This directs increases in muscle glucose toward pentose phosphate and one-carbon metabolism pathways that support cytosolic redox balance and help mitigate the effects of increased protein and purine nucleotide catabolism in hypoxia. Muscle accumulation of free amino acids favor these adjustments by coordinating cytosolic and mitochondrial pathways to rid the cell of excess nitrogen, but might ultimately limit muscle oxidative capacity in vivo Collectively, these studies illustrate how an integration of aerobic and anaerobic metabolism is required for physiological hypoxia adaptation in skeletal muscle, and highlight protein catabolism and allosteric regulation as unexpected orchestrators of metabolic remodeling in this context. These findings have important implications for the management of hypoxia-related diseases and other conditions associated with chronic catabolic stress.

Keywords: anaplerosis; beta-oxidation; bioenergetics; fatty acid oxidation; glycolysis; hypoxia; mitochondrial metabolism; one-carbon metabolism; oxidation-reduction (redox).


Conflict of interest statement

E. G. is Chief Executive Officer of Oroboros Instruments, Innsbruck, Austria

Figures

Figure 1.
Figure 1.
Remodeling of muscle metabolism in hypoxia. A–C, mitochondrial respiration in permeabilized muscle fibers fueled by a combination of malate, pyruvate (Pyr), glutamate (Glut), and palmitoylcarnitine (FA) representing the maximal noncoupled ETS capacity (A), the maximal ADP-stimulated (OXPHOS) rate (B), and OXPHOS coupling control (OXPHOS/ETS; C). D, summary of targeted LC/MS metabolomic analysis of muscle biopsies (A16/SL; log2 scale). E, summary of tandem-mass tag LC/MS/MS proteomic profiling of muscle biopsies and normalized to total sample peptide ion count (TIC, gray) or citrate synthase expression (PerCS, black) corresponding to the data in Table S2b (A16/SL; log2 scale) (n = 15/group). CI-V, complexes I-V of the oxidative phosphorylation (OXPHOS) system; PerCS, normalized to sample citrate synthase; TIC, total ion count; *, p < 0.05 A16 versus SL.
Figure 2.
Figure 2.
High-energy phosphate and purine nucleotide metabolism. A and B, muscle adenine nucleotides (A) and phosphagen (B) changes from SL to A16 detected by LC/MS. C, schematic summary of muscle high-energy phosphate and purine nucleotide metabolism. Enzymes that increased relative to CS from SL to A16 (q < 0.05) are in red filled boxes. Enzymes shown in boxes were found to increase (red fill), decrease (blue fill), or not change (gray fill) from SL to A16 relative to CS in the muscle proteome corresponding to data in Table S2b (q < 0.05). Metabolites depicted were found to increase (red font), decrease (blue font), or not change (black font) from SL to A16 (q < 0.05), or were undetected (gray font) by LC/MS. D, changes in muscle nucleosides and purine degradation products from SL to A16. E, evidence of elevated MAS activity and stable NADH (NAD) redox status from SL to A16 (n = 10–14). HPX, hypoxanthine; PNC, purine nucleotide cycle; *, q < 0.05 versus SL in FDR-adjusted paired t tests.
Figure 3.
Figure 3.
Hypoxia directs muscle glucose toward biosynthetic pathways. A, serum and muscle glucose and lactate, and muscle glucose 6-phosphate (G6P) changes from SL to A16. B, schematic of muscle glucose metabolism including enzymes that increased (red filled boxes), decreased (blue fill), or were unchanged (gray fill) relative to CS from SL to A16 (q < 0.05) corresponding to data in Table S2b. Blue bordered enzymes decreased relative to total sample peptide from SL to A16 (q < 0.05). Metabolites depicted were found to increase (red font), decrease (blue font), or not change (black font) from SL to A16 (q < 0.05), or were undetected (gray font) by LC/MS. C–H, selected muscle pentose phosphate pathway intermediates (C), the reduced/oxidized GSH ratio (D), pyruvate and lactate (E and F), permeabilized muscle fiber pyruvate + malate OXPHOS capacity (G), and 1 carbon metabolism pathway substrates/products (H) at SL and A16. 3PHP, 3-phospho-hydroxypuruvate; DMG, dimethylglycine; PGL, phosphoglucolactone; SH7P, sedohepulose-7-phosphate; GAP, glyceraldehyde-3-phosphate. *, q < 0.05 versus SL in FDR-adjusted paired t tests.
Figure 4.
Figure 4.
Muscle proteolysis alters balance of CAC intermediates in hypoxia. A, accumulated muscle-free amino acids and serum metabolites reflecting increased muscle proteolysis at A16. B, schematic summary of principal muscle amino acid catabolism reactions (yellow path) and their interaction with the canonical CAC (orange path), malate-aspartate shuttle (blue path), PNC (green path), and pyruvate transamination (pink path). Enzymes shown in boxes were found to increase (red fill), decrease (blue fill), or not change (gray fill) from SL to A16 relative to CS in the muscle proteome corresponding to data in Table S2b (q < 0.05). Metabolites depicted increased (red font), decreased (blue font), or did not change (black font) from SL to A16 (q < 0.05), or were undetected (gray font) by LC/MS. C, correlations (second order polynomial) of muscle leucine (Leu) and isoleucine (Ile) with glutamate. D, selective loss of muscle CAC intermediates between citrate and fumarate from SL to A16. E, correlations of muscle malate with alanine (exponential) and lactate (linear). ADP-stimulated (OXPHOS) respiration of permeabilized muscle fibers with substrates linked to CI (pyruvate + glutamate + malate) (F), CII (succinate + rotenone), and the ratio of the two (CI/CII) (G) (n = 12–14). PPP, pentose phosphate pathway; 1CM, one-carbon metabolism; *, q < 0.05 A16 versus SL.
Figure 5.
Figure 5.
Ketone and fatty acid oxidation. Schematic illustrates mitochondrial fatty acid and ketone oxidation pathways with associated enzymes and electron transfer proteins that increased (red fill), decreased (blue fill), or remained unchanged (gray fill) relative to CS from SL to A16 (corresponding to data in Table S2b; q < 0.05). Metabolites shown increased (red text), decreased (blue), or did not change (black) from SL to A16, or were not detected by LC/MS (gray). A, muscle and serum ketones. B, lower muscle 2-hydroxyglutarate (2-HG) correlates closely with α-KG at A16. C, muscle fatty acids and serum lipids. D, higher ADP-stimulated (OXPHOS) respiratory capacity of muscle fibers with palmitoylcarnitine + malate (fatty acid) correlates inversely with systemic respiratory exchange ratio at A16 (dotted line represents the 95% confidence interval). E, no change in muscle fiber respiration in the absence of ADP (LEAK) equates to higher palmitoylcarnitine OXPHOS coupling efficiency at A16. F, no change in muscle pyruvate- or succinate-linked OXPHOS coupling from SL to A16. See supporting Tables S1 and S2 for complete data and abbreviation listing. *, q < 0.05 versus SL in A and B; *, p < 0.05 by paired t test in D and E.
Figure 6.
Figure 6.
Putative regulators of muscle metabolic adaptation to high-altitude hypoxia. A–D, representative blots (A) and graphical summaries of muscle protein expression (20 μg) of total and phosphorylated AMP kinase-α (AMPKα; B), GTPase optic atrophy 1 (OPA1; C), and PPARα (D). E, individual subject data of paired SL and A16 (same gel) PPARα protein blots (50 + 27 kDa). F, paired A16/SL blot density ratios of total PPARα (50 + 27 kDa) positively correlate with palmitoylcarnitine-supported OXPHOS capacity at A16 (data from Fig. 5E). *, p < 0.05 by paired t test.

References

    1. Martin D. S., Levett D. Z., Grocott M. P., and Montgomery H. E. (2010) Variation in human performance in the hypoxic mountain environment. Exp. Physiol. 95, 463–470 10.1113/expphysiol.2009.047589 - DOI - PubMed
    1. Doehner W., Frenneaux M., and Anker S. D. (2014) Metabolic impairment in heart failure: the myocardial and systemic perspective. J. Am. Coll. Cardiol. 64, 1388–1400 10.1016/j.jacc.2014.04.083 - DOI - PubMed
    1. Puente-Maestu L., Lázaro A., and Humanes B. (2013) Metabolic derangements in COPD muscle dysfunction. J. Appl. Physiol. 114, 1282–1290 10.1152/japplphysiol.00815.2012 - DOI - PubMed
    1. Meyer A., Zoll J., Charles A. L., Charloux A., de Blay F., Diemunsch P., Sibilia J., Piquard F., and Geny B. (2013) Skeletal muscle mitochondrial dysfunction during chronic obstructive pulmonary disease: central actor and therapeutic target. Exp. Physiol. 98, 1063–1078 10.1113/expphysiol.2012.069468 - DOI - PubMed
    1. Cerretelli P., Marzorati M., and Marconi C. (2009) Muscle bioenergetics and metabolic control at altitude. High Alt. Med. Biol. 10, 165–174 10.1089/ham.2008.1096 - DOI - PubMed

Publication types

MeSH terms