. 2018 Apr 5;145(7):dev160663.
doi: 10.1242/dev.160663.

Enhancer identification and activity evaluation in the red flour beetle, Tribolium castaneum

Affiliations

Enhancer identification and activity evaluation in the red flour beetle, Tribolium castaneum

Yi-Ting Lai et al. Development. .

Abstract

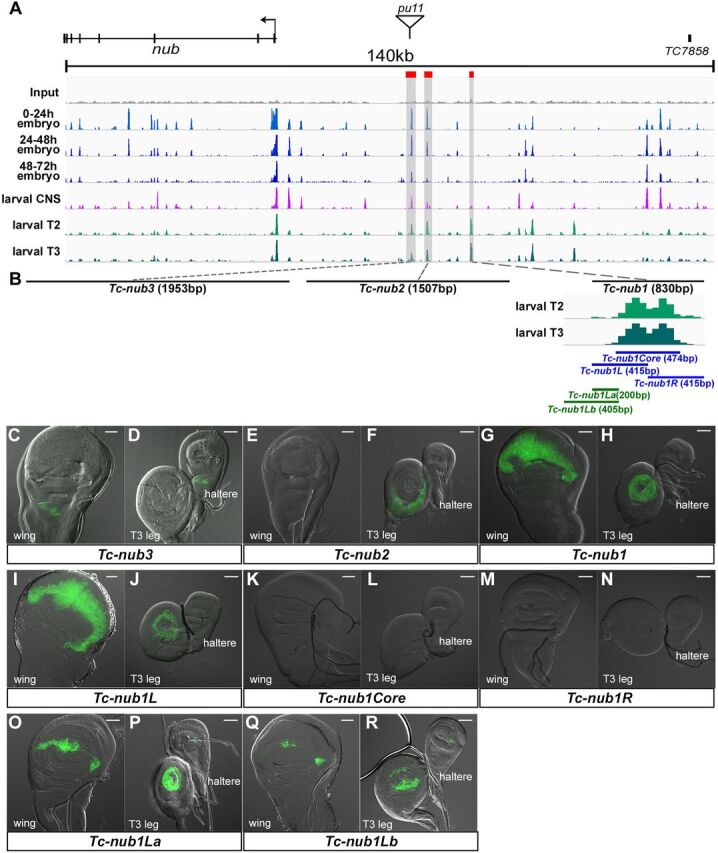
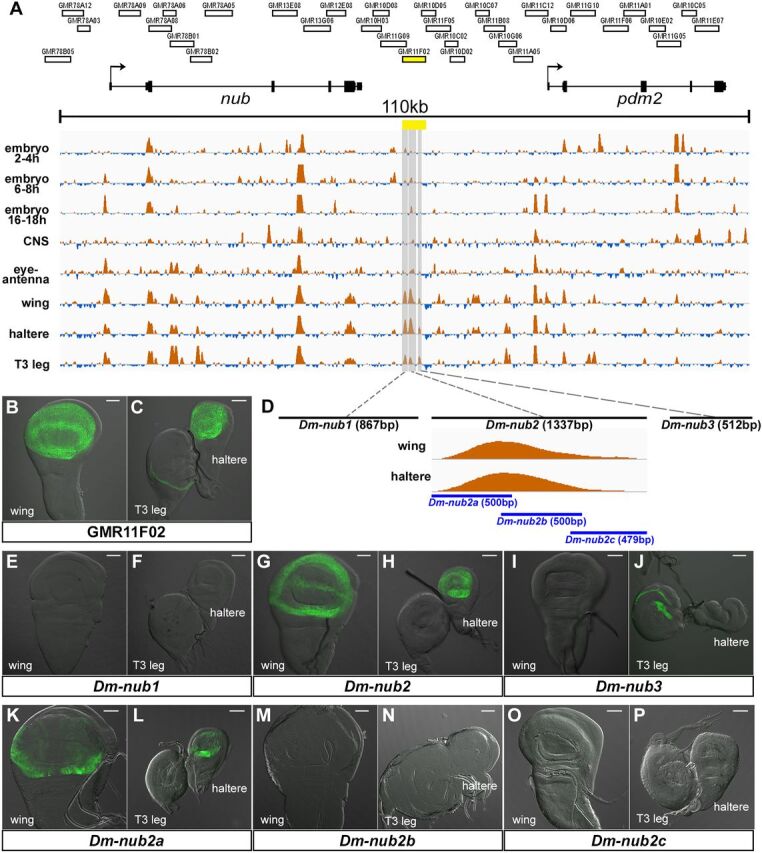
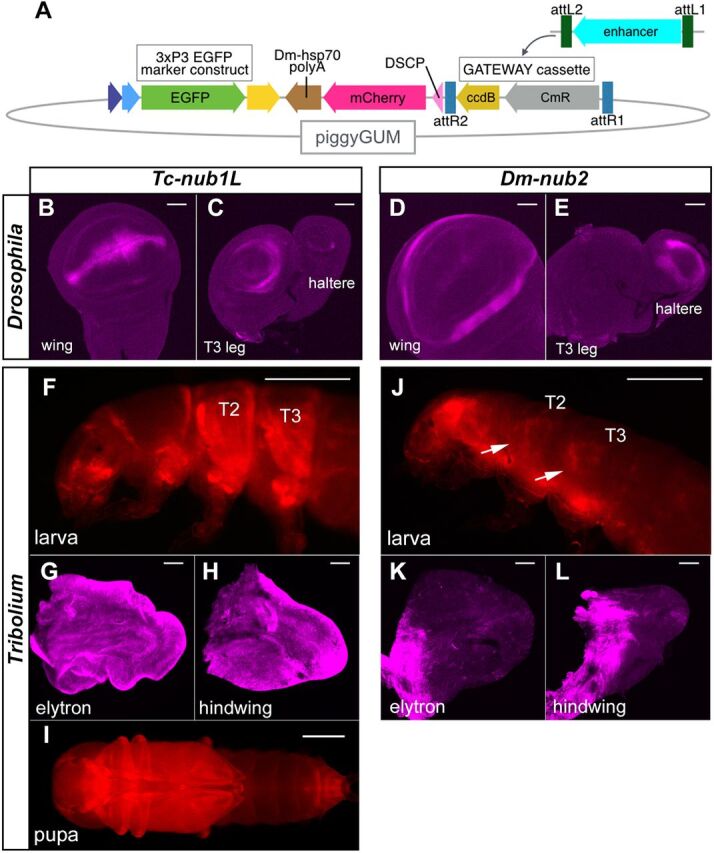
Evolution of cis-regulatory elements (such as enhancers) plays an important role in the production of diverse morphology. However, a mechanistic understanding is often limited by the absence of methods for studying enhancers in species other than established model systems. Here, we sought to establish methods to identify and test enhancer activity in the red flour beetle, Tribolium castaneum To identify possible enhancer regions, we first obtained genome-wide chromatin profiles from various tissues and stages of Tribolium using FAIRE (formaldehyde-assisted isolation of regulatory elements)-sequencing. Comparison of these profiles revealed a distinct set of open chromatin regions in each tissue and at each stage. In addition, comparison of the FAIRE data with sets of computationally predicted (i.e. supervised cis-regulatory module-predicted) enhancers revealed a very high overlap between the two datasets. Second, using nubbin in the wing and hunchback in the embryo as case studies, we established the first universal reporter assay system that works in various contexts in Tribolium, and in a cross-species context. Together, these advances will facilitate investigation of cis-evolution and morphological diversity in Tribolium and other insects.

Keywords: Chromatin profiling; FAIRE-seq; Insects; Reporter assay.


Conflict of interest statement

Competing interestsThe authors declare no competing or financial interests.

Figures

Fig. 1. nub enhancer trap expression in Drosophila and Tribolium. (A,B) The nub enhancer trap expression in the wing disc (A), and the haltere and T3 leg discs (B) in Drosophila. (C,D) Expression pattern of the nub enhancer trap line (pu11) at the larval (C) and pupal (D) stages in Tribolium. (E) The piggyBac construct inserted near the nub locus in the pu11 beetles. The Dm-hsp70 minimal promoter within the 3xP3 construct appears to have trapped the wing enhancer of nub in pu11, driving EYFP in the pattern identical to the endogenous nub wing expression. In contrast, the eye expression in pu11 is due to the 3xP3 construct and is independent of nub enhancer activity. The polyubiquitin promoter-Gal4 construct appears to be non-functional in pu11 (Y.T., unpublished observation). Scale bars: 0.5 mm.
Fig. 1.
nub enhancer trap expression in Drosophila and Tribolium. (A,B) The nub enhancer trap expression in the wing disc (A), and the haltere and T3 leg discs (B) in Drosophila. (C,D) Expression pattern of the nub enhancer trap line (pu11) at the larval (C) and pupal (D) stages in Tribolium. (E) The piggyBac construct inserted near the nub locus in the pu11 beetles. The Dm-hsp70 minimal promoter within the 3xP3 construct appears to have trapped the wing enhancer of nub in pu11, driving EYFP in the pattern identical to the endogenous nub wing expression. In contrast, the eye expression in pu11 is due to the 3xP3 construct and is independent of nub enhancer activity. The polyubiquitin promoter-Gal4 construct appears to be non-functional in pu11 (Y.T., unpublished observation). Scale bars: 0.5 mm.
Fig. 2. Identification of the Tribolium nub wing enhancer using FAIRE and cross-species reporter assay. (A) FAIRE profiles at the Tribolium nub locus in six different tissues/stages. The pu11 insertion site is indicated with a triangle. Three peaks near the pu11 insertion site that were chosen for evaluating enhancer activity are marked with red boxes. (B) Summary of the regions that were tested by the reporter assay. The distance between Tc-nub1, Tc-nub2 and Tc-nub3 are not scaled. The magnified view of the FAIRE peak corresponding to Tc-nub1L is also presented. (C-R) Enhancer activity of each Tribolium genomic region tested in the Drosophila imaginal discs. Scale bars: 50 µm.
Fig. 2.
Identification of the Tribolium nub wing enhancer using FAIRE and cross-species reporter assay. (A) FAIRE profiles at the Tribolium nub locus in six different tissues/stages. The pu11 insertion site is indicated with a triangle. Three peaks near the pu11 insertion site that were chosen for evaluating enhancer activity are marked with red boxes. (B) Summary of the regions that were tested by the reporter assay. The distance between Tc-nub1, Tc-nub 2 and Tc-nub 3 are not scaled. The magnified view of the FAIRE peak corresponding to Tc-nub1L is also presented. (C-R) Enhancer activity of each Tribolium genomic region tested in the Drosophila imaginal discs. Scale bars: 50 µm.
Fig. 3. Identification of the Drosophila nub wing enhancer. (A) FAIRE profiles from eight different tissues/stages at the nub and pdm2 loci in Drosophila. The regions surveyed in the FlyLight project are also indicated. The region that shows wing enhancer activity is marked in yellow. (B,C) Expression driven by GMR11F02 in the Drosophila imaginal discs. (D) Summary of the regions within GMR11F02 that were tested by the reporter assay. The relative distance between Dm-nub1, Dm-nub2 and Dm-nub3 are not to scale. The magnified view of the Dm-nub2 peak is also included. (E-P) Enhancer activity of each Drosophila genomic region tested in the Drosophila imaginal discs. Scale bars: 50 µm.
Fig. 3.
Identification of the Drosophila nub wing enhancer. (A) FAIRE profiles from eight different tissues/stages at the nub and pdm2 loci in Drosophila. The regions surveyed in the FlyLight project are also indicated. The region that shows wing enhancer activity is marked in yellow. (B,C) Expression driven by GMR11F02 in the Drosophila imaginal discs. (D) Summary of the regions within GMR11F02 that were tested by the reporter assay. The relative distance between Dm-nub1,Dm-nub 2 and Dm-nub 3 are not to scale. The magnified view of the Dm-nub2 peak is also included. (E-P) Enhancer activity of each Drosophila genomic region tested in the Drosophila imaginal discs. Scale bars: 50 µm.
Fig. 4. Reporter assay with the Tc-hsp68 promoter construct in Drosophila and Tribolium. (A) The piggyGHR construct. (B-E) Enhancer activity of Tc-Nub1L (B,C) and Dm-nub2 (D,E) tested with the piggyGHR construct in Drosophila. (F-M) Enhancer activity of Tc-nub1L (F-K) and Dm-nub2 (L,M) tested with piggyGHR at the pupal stage in Tribolium. Six independent lines for Tc-nub1L (F-K) and two for Dm-nub2 (L,M) are shown. Scale bars: 50 µm (B-E); 0.5 mm (F-M); scale bars in F and L apply to F-K and L,M, respectively.
Fig. 4.
Reporter assay with the Tc-hsp68 promoter construct in Drosophila and Tribolium. (A) The piggyGHR construct. (B-E) Enhancer activity of Tc-Nub1L (B,C) and Dm-nub2 (D,E) tested with the piggyGHR construct in Drosophila. (F-M) Enhancer activity of Tc-nub1L (F-K) and Dm-nub2 (L,M) tested with piggyGHR at the pupal stage in Tribolium. Six independent lines for Tc-nub1L (F-K) and two for Dm-nub2 (L,M) are shown. Scale bars: 50 µm (B-E); 0.5 mm (F-M); scale bars in F and L apply to F-K and L,M, respectively.
Fig. 5. Reporter assay with the DSCP construct in Drosophila and Tribolium. (A) The piggyGUM construct. (B-E) Enhancer activity of Tc-Nub1L (B,C) and Dm-nub2 (D,E) tested with the piggyGUM construct in Drosophila. (F-L) Reporter expression of piggyGUM-Tc-nub1L (F-I) and piggyGUM-Dm-nub2 (J-L) in Tribolium. Scale bars: 50 µm (B-E,G,H,K,L); 0.5 mm (F,I,J).
Fig. 5.
Reporter assay with the DSCP construct in Drosophila and Tribolium. (A) The piggyGUM construct. (B-E) Enhancer activity of Tc-Nub1L (B,C) and Dm-nub2 (D,E) tested with the piggyGUM construct in Drosophila. (F-L) Reporter expression of piggyGUM-Tc-nub1L (F-I) and piggyGUM-Dm-nub2 (J-L) in Tribolium. Scale bars: 50 µm (B-E,G,H,K,L); 0.5 mm (F,I,J).
Fig. 6. Reporter assay with the Tribolium endogenous promoters in Drosophila and Tribolium. (A) The piggyNub-proR construct. (B) The piggyAct5cR construct. (C-F) Enhancer activity of Tc-Nub1L tested with the piggyNub-proR construct. dsRed reporter expression is completely absent (C,E), even though EGFP (D,F) confirms the presence of the transgenic construct. (G,H) The piggyNub-proR reporter expression in Drosophila imaginal discs. (I) dsRed expression of the piggyAct5cR at the larval stage in Tribolium. (J) dsRed expression of the piggyNub-proR with Tc-Nub1L at the larval stage in Tribolium, with the same exposure time as I. Scale bars: 0.5 mm (C-F,I,J); 50 µm (G,H).
Fig. 6.
Reporter assay with the Tribolium endogenous promoters in Drosophila and Tribolium. (A) The piggyNub-proR construct. (B) The piggyAct5cR construct. (C-F) Enhancer activity of Tc-Nub1L tested with the piggyNub-proR construct. dsRed reporter expression is completely absent (C,E), even though EGFP (D,F) confirms the presence of the transgenic construct. (G,H) The piggyNub-proR reporter expression in Drosophila imaginal discs. (I) dsRed expression of the piggyAct5cR at the larval stage in Tribolium. (J) dsRed expression of the piggyNub-proR with Tc-Nub1L at the larval stage in Tribolium, with the same exposure time as I. Scale bars: 0.5 mm (C-F,I,J); 50 µm (G,H).
Fig. 7. hb enhancer analysis in Tribolium. (A) FAIRE profiles at the hb locus. Orange bar, blastoderm enhancer activity when introduced in Drosophila; purple, SCRMshaw predictions; red, the 1340 bp fragment tested in this study (hb-PE1). (B) hb expression at the early germband stage detected by in situ hybridization for hb transcript. (C) mCherry reporter gene expression of piggyGUM-hb-PE1 detected by in situ hybridization for mCherry transcript. Scale bars: 100 µm.
Fig. 7.
hb enhancer analysis in Tribolium. (A) FAIRE profiles at the hb locus. Orange bar, blastoderm enhancer activity when introduced in Drosophila; purple, SCRMshaw predictions; red, the 1340 bp fragment tested in this study (hb-PE1). (B) hb expression at the early germband stage detected by in situ hybridization for hb transcript. (C) mCherry reporter gene expression of piggyGUM-hb-PE1 detected by in situ hybridization for mCherry transcript. Scale bars: 100 µm.

Similar articles

Cited by

References

    1. Angelini, D. R. , Smith, F. W. and Jockusch, E. L. (2012). Extent with modification: leg patterning in the beetle Tribolium castaneum and the evolution of serial homologs. G3 2, 235-248. 10.1534/g3.111.001537 - DOI - PMC - PubMed
    1. Bellés, X. (2010). Beyond Drosophila: RNAi in vivo and functional genomics in insects. Annu. Rev. Entomol. 55, 111-128. 10.1146/annurev-ento-112408-085301 - DOI - PubMed
    1. Bischof, J. , Maeda, R. K. , Hediger, M. , Karch, F. and Basler, K. (2007). An optimized transgenesis system for Drosophila using germ-line-specific phiC31 integrases. Proc. Natl. Acad. Sci. USA 104, 3312-3317. 10.1073/pnas.0611511104 - DOI - PMC - PubMed
    1. Brown, S. J. , Mahaffey, J. P. , Lorenzen, M. D. , Denell, R. E. and Mahaffey, J. W. (1999). Using RNAi to investigate orthologous homeotic gene function during development of distantly related insects. Evol. Dev. 1, 11-15. 10.1046/j.1525-142x.1999.99013.x - DOI - PubMed
    1. Bucher, G. , Scholten, J. and Klingler, M. (2002). Parental RNAi in tribolium (Coleoptera). Curr. Biol. 12, R85-R86. 10.1016/S0960-9822(02)00666-8 - DOI - PubMed

Publication types

LinkOut - more resources