. 2018 Mar 14;285(1874):20172687.
doi: 10.1098/rspb.2017.2687.

Predicting drug resistance evolution: insights from antimicrobial peptides and antibiotics

Affiliations

Predicting drug resistance evolution: insights from antimicrobial peptides and antibiotics

Guozhi Yu et al. Proc Biol Sci. .

Abstract

Antibiotic resistance constitutes one of the most pressing public health concerns. Antimicrobial peptides (AMPs) of multicellular organisms are considered part of a solution to this problem, and AMPs produced by bacteria such as colistin are last-resort drugs. Importantly, AMPs differ from many antibiotics in their pharmacodynamic characteristics. Here we implement these differences within a theoretical framework to predict the evolution of resistance against AMPs and compare it to antibiotic resistance. Our analysis of resistance evolution finds that pharmacodynamic differences all combine to produce a much lower probability that resistance will evolve against AMPs. The finding can be generalized to all drugs with pharmacodynamics similar to AMPs. Pharmacodynamic concepts are familiar to most practitioners of medical microbiology, and data can be easily obtained for any drug or drug combination. Our theoretical and conceptual framework is, therefore, widely applicable and can help avoid resistance evolution if implemented in antibiotic stewardship schemes or the rational choice of new drug candidates.

Keywords: antibiotics; antimicrobial peptides; pharmacodynamics; resistance evolution.


Conflict of interest statement

We declare we do not have competing interests.

Figures

Figure 1.
Figure 1.
The revised mutant selection window (MSW) and pharmacodynamic parameters. (a) The MSW is defined as the antimicrobial concentration range in which resistant mutants are selected [13]. Following [14], we determine the MSW using net growth curves of a susceptible strain S and a resistant strain R. Mathematically, net growth is described with the pharmacodynamic function ψ(a) ([15], see Material and methods and the electronic supplementary material, figure S3 for details). In short, the function consists of the four pharamcodynamic parameters: net growth in the absence of antibicrobials ψmax, net growth in the presence of a dose of antimicrobials, which effects the growth maximal, ψmin, the minimum inhibitory concentration (MIC) and the parameter κ, which describes the steepness of the pharamcodynamic curve. Here, the two pharmacodynamics functions ψS(a) (continuous pink line) and ψR(a) (dotted black line) describe the net growth of the S and R, respectively, in relation to the drug concentration a. Cost of resistance c is included as a reduction of the maximum growth rate of the resistant strain ψmax,R, with c = 1 − ψmax,R/ψmax,S. Note that with this definition, cost of resistance is expressed as reduction in net growth rate in the absence of antimicrobials (a = 0). The lower bound of the MSW is the concentration for which the net growth rate of the resistant strain is equal to the net growth rate of the sensitive strain and is called the minimal selective concentration (MSC) (see Material and methods for analytic solution; see the electronic supplementary material, figure S1 for how the MSC is influenced by pharamcodynamic parameters of the sensitive strain). The upper bound is given by the MIC of the resistant strain MICR. We calculate the size of the MSW as: formula image
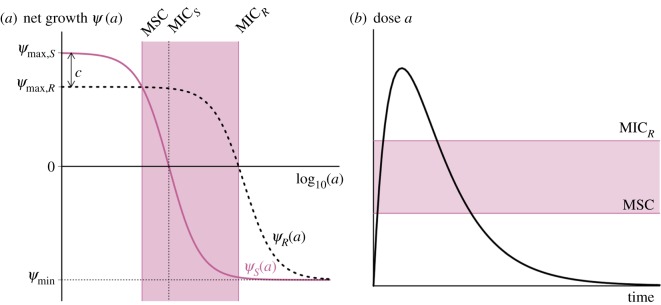
. (b) Following the original approach to define the MSW [13], the boundaries of the MSW can also be applied to the pharmacokinetics of the system. The black line represents the change in antimicrobial concentration over time due to input (increase) and decay (decrease). The lower and upper boundaries of the shaded area indicate the MSW.
Figure 2.
Figure 2.
The mutant selection window (MSW) for arbitrary mutant strains. The two boundaries of the MSW, MSC and MICR, are influenced differently by the pharmacodynamic parameters of the sensitive strain S and the resistant strain R. (a) The lower boundary of the MSW (MSC) depends primarily on the pharmacodynamic parameters of the sensitive strain, assuming that the net growth rate of the resistant strain below the MSC is approximately at the same level as without antimicrobials: ψR(a) ≈ ψmax,S(1 − c) = ψR,approx, for 0 < a < MSC (ψR: dotted black line; ψR,approx: continuous black line) (see Material and methods for details). The effect of each of the four pharamcodynamic parameters and of the cost of resistance on the MSC is depicted in the electronic supplementary material, figure S1. We plotted the pharmacodynamic function ψS(a) of two sensitive strains with varying κ values: ψS,1(a) representative for antibiotics with a small κ (κ = 1.5, pink) and ψS,2(a) representative for AMPs with a large κ (κ = 5, blue). Increasing the κ value results in increasing the MSC (MSC1 (pink) <MSC2 (blue)). (b) The upper boundary of the MSW is per definition the MICR, which is linked to its fitness cost, i.e. the upper boundary MICR increases with costs c (data from [27]). Here, the log-linear regression and the 95% confidence interval (CI) are plotted. See Materials and methods for details of the statistics. (c) The relationship between the cost of resistance, other pharmacodynamic parameters and the size of the MSW is complex. We show that because both boundaries of the MSW—the MSC and the MICR—are influenced by costs of resistance c, the lowest MSW window size is achieved at intermediate cost of resistance c. Note that although the data plotted in (b) shows that resistance mutation can also be advantageous in terms of fitness (c < 0), the size of the MSW can only be determined for 0 ≤ c ≤ 1, because formula image
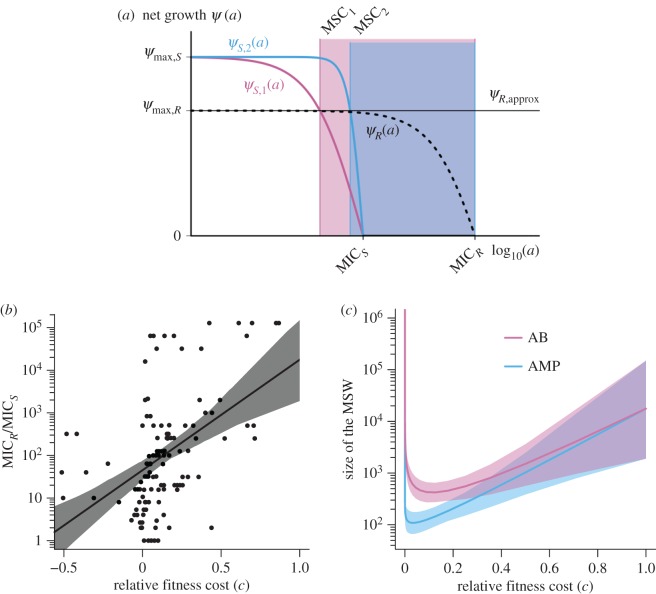
.We plotted the size of the MSW (line) and the 95% CIs for both AMP-like and antibiotic (AB)-like pharmacodynamics, with ψmax,S = 1, MICS = 1, ψmin,S,AB = −5, ψmin,S,AMP = −50, κS,AB = 1.5 and κS,AMP = 5. ψmax,R was calculated using the relationship log10(MICR/MICS) = 2.59c + 1.65.
Figure 3.
Figure 3.
Evolution of drug resistance determined by pharmacodynamics. (a) At high dose (D = 400; all other parameters see below (AB)) antimicrobials achieve maximal effects and rapidly kill most of the population, preventing resistance evolution (right). At medium dose (D = 45), the sensitive strain will not be eliminated immediately, and resistant mutants emerge (central). At low dose (D = 5), the sensitive strain will not be removed, the mutants also emerge, but will not quickly reach equilibrium owing to substantial fitness costs (left, resistant: pink, susceptible: blue). (b) Simulations comparing the range from ‘pure’ antimicrobial peptides (AMP) to ‘pure’ antibiotics (AB) by altering μ, ψmin and κ. We find that the probabilities of treatment failure (left), of failure caused by resistant strains (middle) and of resistance emergence are always higher under the AB-scenario than the AMP-scenario. A successful treatment requires less AMP than AB. (c) Following [32], we calculate the resistance hazard as the time-averaged proportion of mutants in a patient under a particular treatment dose. We find that AMPs are much less likely to select for resistance across concentrations than antibiotics (inset graph: a log-scale view). (d) Time to resistance is much longer under AMP than AB treatment when the average concentration is below MIC, but shorter around MIC and equal in higher concentrations (inset graph). The parameters for all simulations of this figure are: ψmax,S = 1, ψmax,R = 0.8, κAB = 1.5, κAMP = 5, ψmin,AB = −5, ψmin,AMP = −50, MICS = 10, formula image 
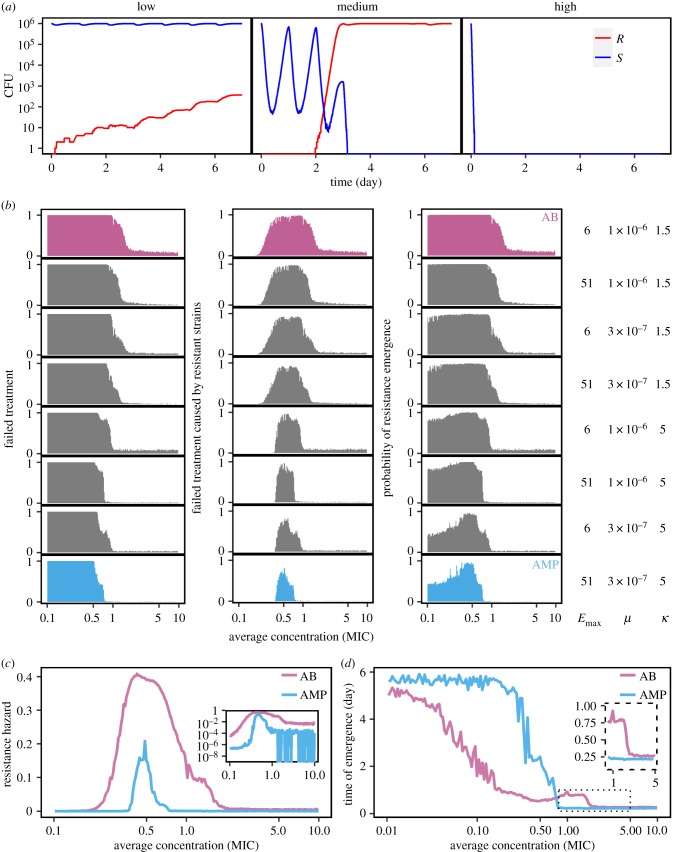
μAMP = 3 × 10⁻⁷, ka = 0.5, ke = 0.2, dn = 0.01, τ = 1/24.

References

    1. Laxminarayan R, Sridhar D, Blaser M, Wang M, Woolhouse M. 2016. Achieving global targets for antimicrobial resistance. Science 9286, 1–4. (10.1126/science.aaf9286) - DOI - PubMed
    1. McClure NS, Day T.. 2014. A theoretical examination of the relative importance of evolution management and drug development for managing resistance. Proc. R. Soc. B 281, 20141861 (10.1098/rspb.2014.1861) - DOI - PMC - PubMed
    1. World Health Organization. 2014. The evolving threat of antimicrobial resistance: options for action. Geneva, Switzerland: WHO.
    1. Czaplewski L, et al. 2016. Alternatives to antibiotics: a pipeline portfolio review. Lancet Infect. Dis. 16, 1–13. (10.1016/S1473-3099(15)00466-1) - DOI - PubMed
    1. Zasloff M. 2002. Antimicrobial peptides of multicellular organisms. Nature 415, 389–395. (10.1038/415389a) - DOI - PubMed

Publication types

MeSH terms

Substances