

Olfaction written in bone: cribriform plate size parallels olfactory receptor gene repertoires in Mammalia
- PMID: 29540522
- PMCID: PMC5879636
- DOI: 10.1098/rspb.2018.0100
Olfaction written in bone: cribriform plate size parallels olfactory receptor gene repertoires in Mammalia
Abstract
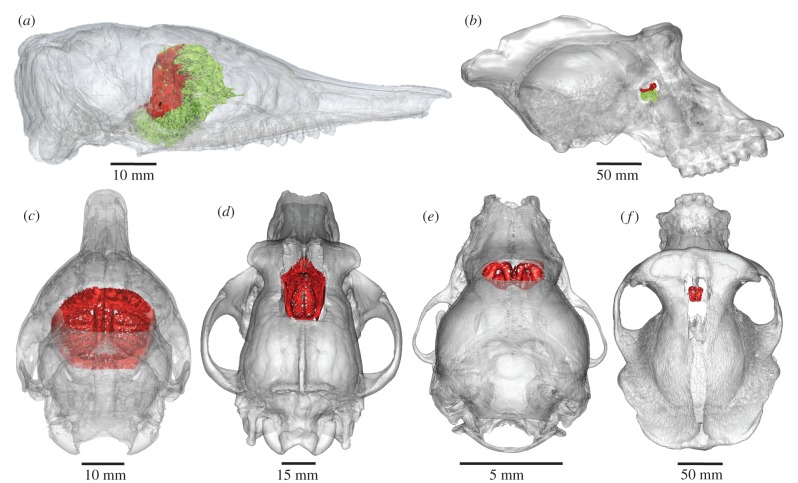
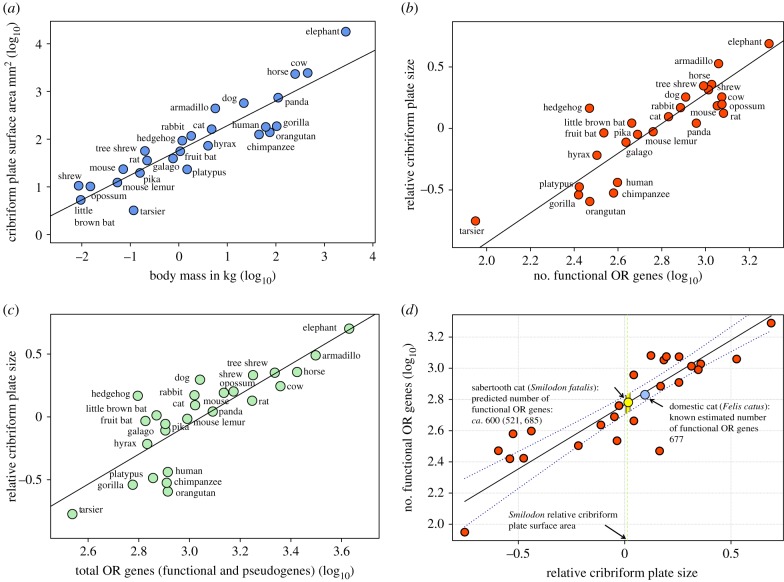
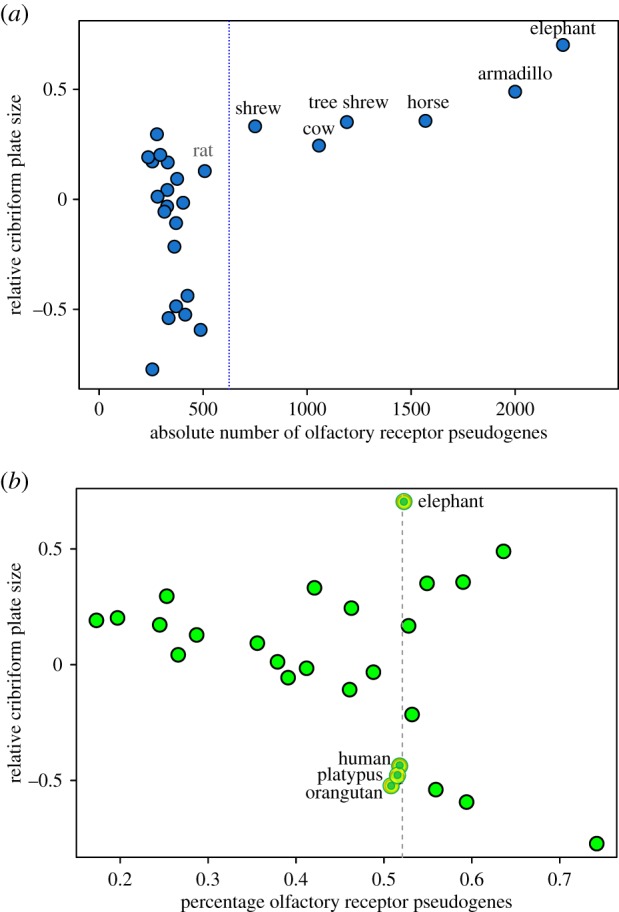
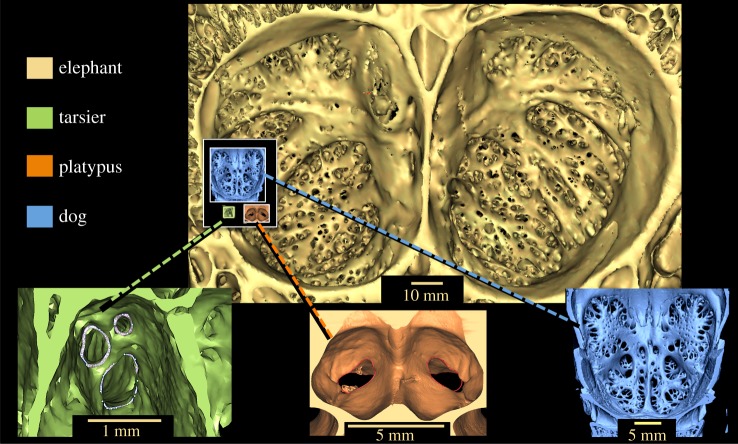
The evolution of mammalian olfaction is manifested in a remarkable diversity of gene repertoires, neuroanatomy and skull morphology across living species. Olfactory receptor genes (ORGs), which initiate the conversion of odorant molecules into odour perceptions and help an animal resolve the olfactory world, range in number from a mere handful to several thousand genes across species. Within the snout, each of these ORGs is exclusively expressed by a discrete population of olfactory sensory neurons (OSNs), suggesting that newly evolved ORGs may be coupled with new OSN populations in the nasal epithelium. Because OSN axon bundles leave high-fidelity perforations (foramina) in the bone as they traverse the cribriform plate (CP) to reach the brain, we predicted that taxa with larger ORG repertoires would have proportionately expanded footprints in the CP foramina. Previous work found a correlation between ORG number and absolute CP size that disappeared after accounting for body size. Using updated, digital measurement data from high-resolution CT scans and re-examining the relationship between CP and body size, we report a striking linear correlation between relative CP area and number of functional ORGs across species from all mammalian superorders. This correlation suggests strong developmental links in the olfactory pathway between genes, neurons and skull morphology. Furthermore, because ORG number is linked to olfactory discriminatory function, this correlation supports relative CP size as a viable metric for inferring olfactory capacity across modern and extinct species. By quantifying CP area from a fossil sabertooth cat (Smilodon fatalis), we predicted a likely ORG repertoire for this extinct felid.
Keywords: cribriform plate; olfactory receptor gene; olfactory sensory neuron; pseudogene; sabertooth cat; skull morphology.
© 2018 The Author(s).
Conflict of interest statement
We declare we have no competing interests.
Figures
Similar articles
-
Quantifying the cribriform plate: influences of allometry, function, and phylogeny in Carnivora.Anat Rec (Hoboken). 2014 Nov;297(11):2080-92. doi: 10.1002/ar.23032. Anat Rec (Hoboken). 2014. PMID: 25312366
-
Domesticating olfaction: Dog breeds, including scent hounds, have reduced cribriform plate morphology relative to wolves.Anat Rec (Hoboken). 2021 Jan;304(1):139-153. doi: 10.1002/ar.24518. Epub 2020 Nov 17. Anat Rec (Hoboken). 2021. PMID: 33205623
-
Scaling of mammalian ethmoid bones can predict olfactory organ size and performance.Proc Biol Sci. 2005 May 7;272(1566):957-62. doi: 10.1098/rspb.2004.2993. Proc Biol Sci. 2005. PMID: 16024352 Free PMC article.
-
Olfactory receptor gene repertoires in mammals.Mutat Res. 2007 Mar 1;616(1-2):95-102. doi: 10.1016/j.mrfmmm.2006.11.012. Epub 2006 Dec 12. Mutat Res. 2007. PMID: 17166524 Review.
-
The influence of olfactory experience on the birthrates of olfactory sensory neurons with specific odorant receptor identities.Genesis. 2024 Jun;62(3):e23611. doi: 10.1002/dvg.23611. Genesis. 2024. PMID: 38888221 Free PMC article. Review.
Cited by
-
Degeneration of the Olfactory System in a Murid Rodent that Evolved Diurnalism.Mol Biol Evol. 2024 Mar 1;41(3):msae037. doi: 10.1093/molbev/msae037. Mol Biol Evol. 2024. PMID: 38376543 Free PMC article.
-
An Evolutionary Microcircuit Approach to the Neural Basis of High Dimensional Sensory Processing in Olfaction.Front Cell Neurosci. 2021 Apr 30;15:658480. doi: 10.3389/fncel.2021.658480. eCollection 2021. Front Cell Neurosci. 2021. PMID: 33994949 Free PMC article.
-
Sculpting the skull through neurosensory epithelial-mesenchymal signaling.Dev Dyn. 2019 Jan;248(1):88-97. doi: 10.1002/dvdy.24664. Epub 2018 Sep 24. Dev Dyn. 2019. PMID: 30117627 Free PMC article. Review.
-
Strategies of vascularization of the ethmoid labyrinth in selected even-toed ungulates (Artiodactyla) and carnivores (Carnivora).J Anat. 2023 Jun;242(6):1067-1077. doi: 10.1111/joa.13829. Epub 2023 Jan 23. J Anat. 2023. PMID: 36688531 Free PMC article.
-
Phylogeny, Ecology, and Gene Families Covariation Shaped the Olfactory Subgenome of Rodents.Genome Biol Evol. 2023 Nov 1;15(11):evad197. doi: 10.1093/gbe/evad197. Genome Biol Evol. 2023. PMID: 37972291 Free PMC article.
References
Publication types
MeSH terms
Substances
Associated data
LinkOut - more resources
Full Text Sources
Other Literature Sources
Miscellaneous
