. 2018 May 15;29(10):1238-1257.
doi: 10.1091/mbc.E17-08-0519. Epub 2018 Mar 22.

Control of insulin granule formation and function by the ABC transporters ABCG1 and ABCA1 and by oxysterol binding protein OSBP

Affiliations

Control of insulin granule formation and function by the ABC transporters ABCG1 and ABCA1 and by oxysterol binding protein OSBP

Syed Saad Hussain et al. Mol Biol Cell. .

Abstract

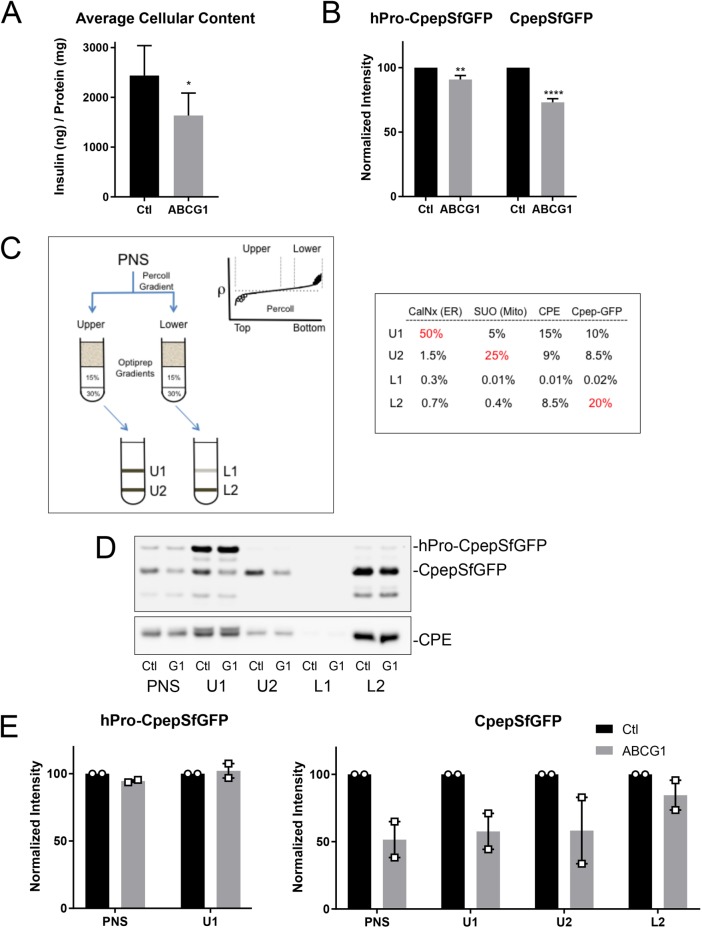
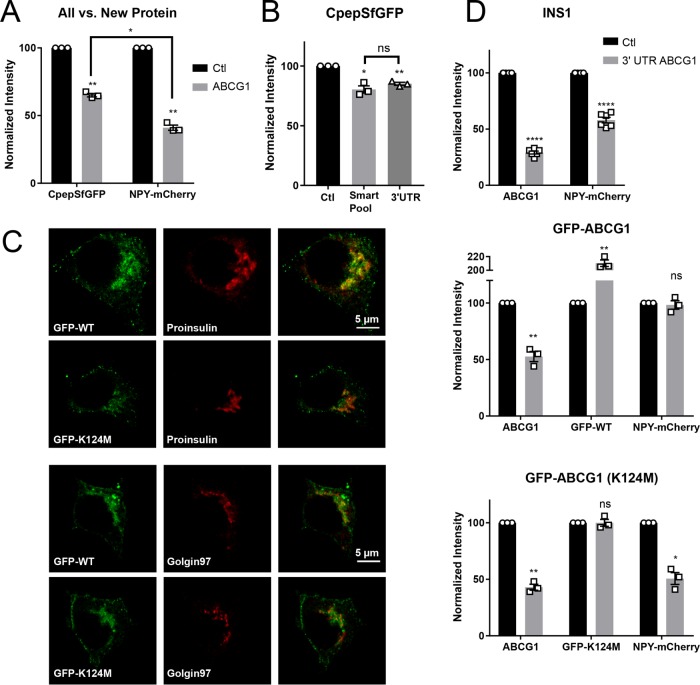
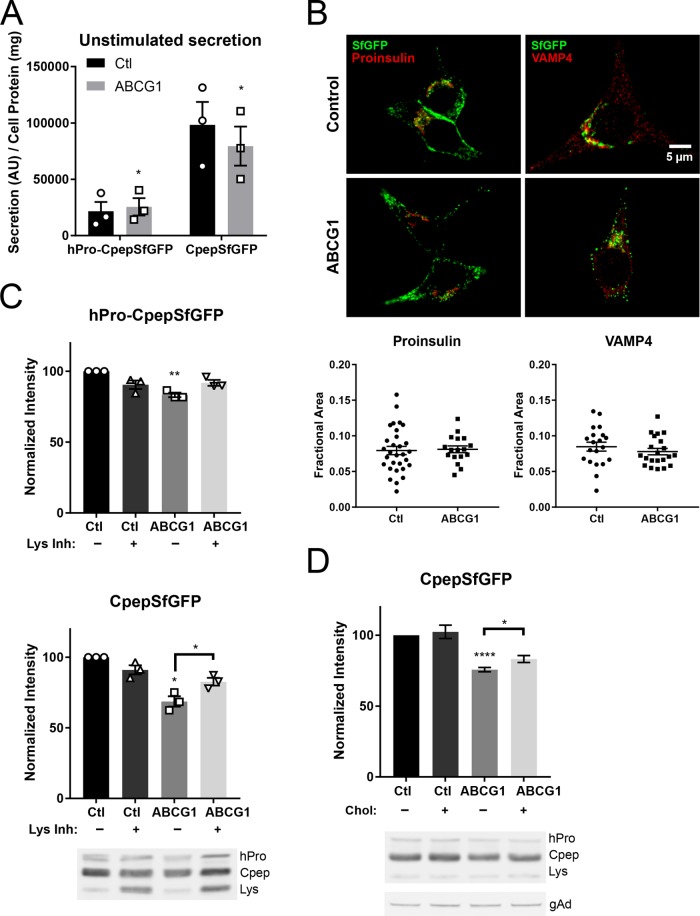
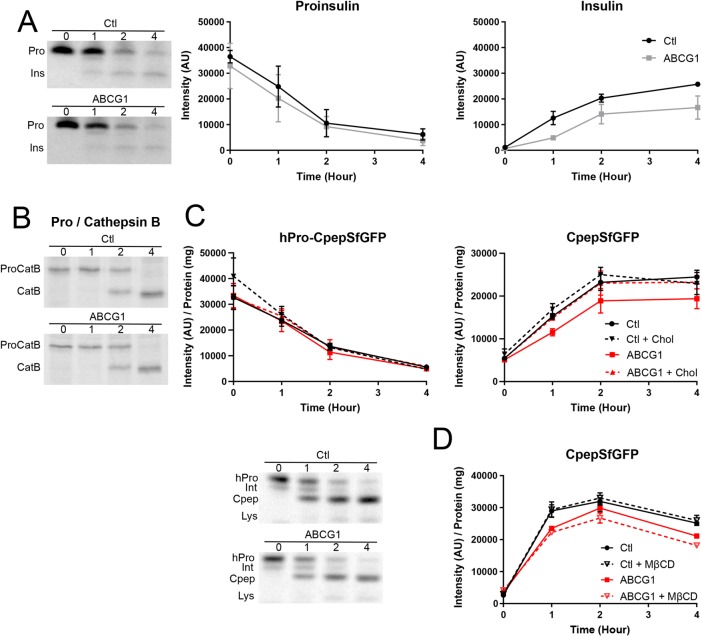
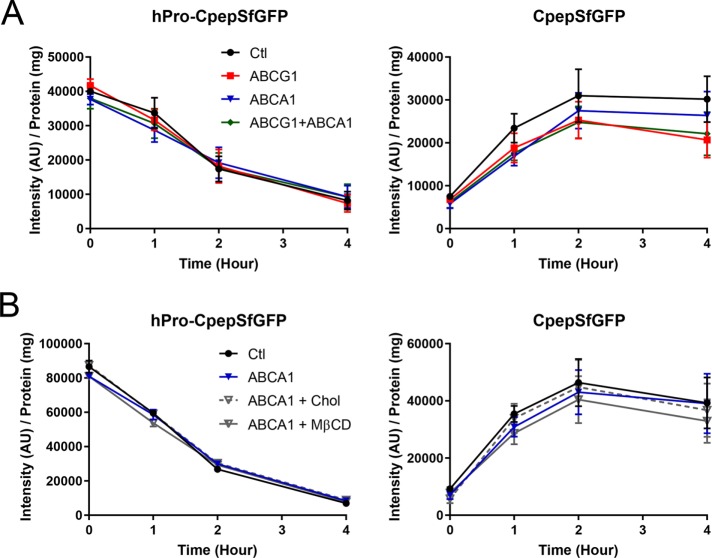
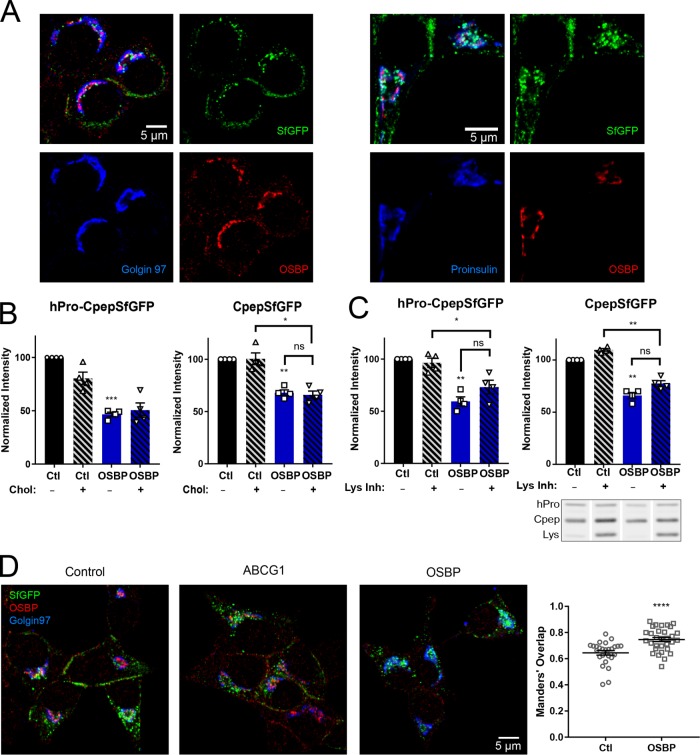
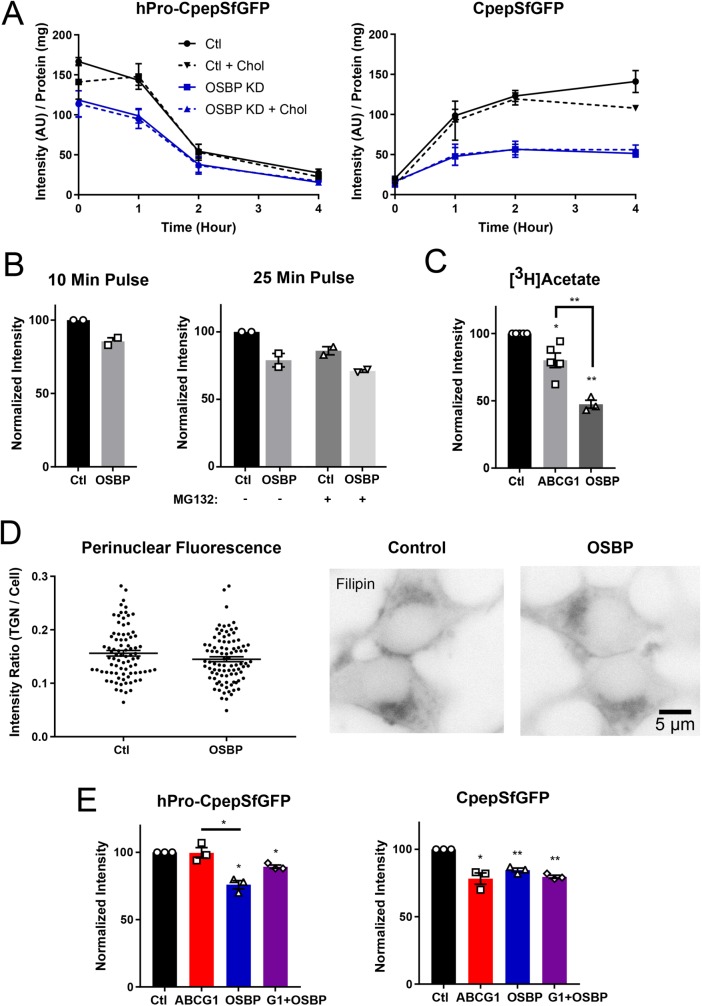
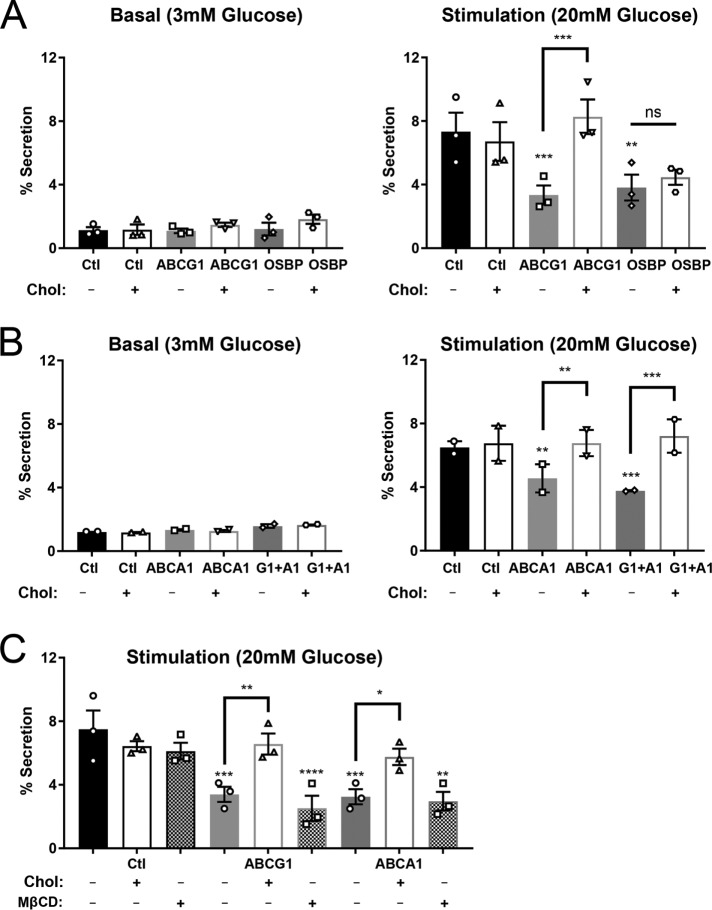
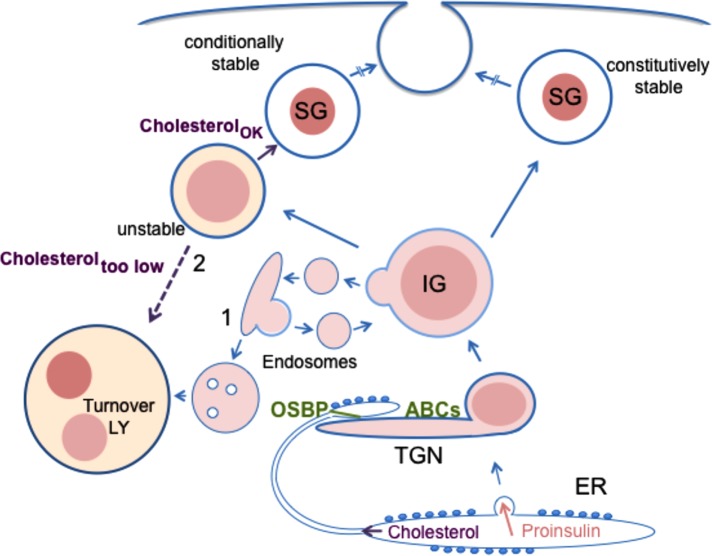
In pancreatic β-cells, insulin granule membranes are enriched in cholesterol and are both recycled and newly generated. Cholesterol's role in supporting granule membrane formation and function is poorly understood. ATP binding cassette transporters ABCG1 and ABCA1 regulate intracellular cholesterol and are important for insulin secretion. RNAi inter-ference-induced depletion in cultured pancreatic β-cells shows that ABCG1 is needed to stabilize newly made insulin granules against lysosomal degradation; ABCA1 is also involved but to a lesser extent. Both transporters are also required for optimum glucose-stimulated insulin secretion, likely via complementary roles. Exogenous cholesterol addition rescues knockdown-induced granule loss (ABCG1) and reduced secretion (both transporters). Another cholesterol transport protein, oxysterol binding protein (OSBP), appears to act proximally as a source of endogenous cholesterol for granule formation. Its knockdown caused similar defective stability of young granules and glucose-stimulated insulin secretion, neither of which were rescued with exogenous cholesterol. Dual knockdowns of OSBP and ABC transporters support their serial function in supplying and concentrating cholesterol for granule formation. OSBP knockdown also decreased proinsulin synthesis consistent with a proximal endoplasmic reticulum defect. Thus, membrane cholesterol distribution contributes to insulin homeostasis at production, packaging, and export levels through the actions of OSBP and ABCs G1 and A1.


Figures

FIGURE 1:
FIGURE 1:
RNAi-mediated depletion of ABCG1 reduces the levels of secretory proteins in insulin-secreting cells and also inhibits stimulated secretion. (A) Levels of insulin in INS1 cells measured by ELISA following treatment with siRNA (control or ABCG1-targeted smart pool); n = 7. (B) Levels of hPro-CpepSfGFP and CpepSfGFP in GRINCH cells quantified from Western blots following control and ABCG1 knockdowns; n = 20. Data are presented as mean ± SEM. p values determined by Student’s t test; *, p < 0.05; **, p < 0.01; ****, p < 0.0001. (C) Isoosmotic fractionation protocol used to resolve granule populations and accompanying distributions of marker proteins in the subfractions (PNS, postnuclear supernatant; U1, U2 and L1, L2) resolved on the iodixanol gradients from the upper (lower density) and lower (higher density) bands of the Percoll gradient, respectively. Markers are as follows: CalNx, calnexin (ER); SUO, succinate-ubiquinone oxidoreductase (mitochondria); CPE, carboxypeptidase (condensing vacuoles, immature and mature granules); Cpep-GFP, CpepSfGFP. Percentages in red show principal concentration sites. (D) Western blots showing the distributions of hPro-CpepSfGFP and CpepSfGFP (upper blot) and CPE (lower blot) in fractions obtained from parallel fractionation of control (Ctl) and ABCG1-depleted (G1) cells. As discussed in the text and shown in Figures 3C and 6C, the band running below CpepSfGFP appears to be an intermediate in the degradation of CpepSfGFP in lysosomes. (E) Two separate fractionations documenting little or no loss of hPro-CpepSfGFP in PNS and U1 but pronounced loss of CpepSfGFP in PNS, U1, and U2 as compared with L2 following ABCG1 knockdown as quantified from Western blots. Supplemental Figure S2 documents similar loss for CPE but no loss of SUO or CalNx in ABCG1-depleted samples.
FIGURE 2:
FIGURE 2:
RNAi-mediated knockdown of ABCG1 causes preferential loss of newly produced secretory protein and the effect reflects a deficiency in ABCG1. (A) Loss of NPY-mCherry (new protein), expressed during the last 24 h of knockdown, is significantly greater than the loss of CpepSfGFP (all protein), a portion of which was present before inducing the knockdown. Quantification from Western blots; n = 3. (B) Comparable loss of CpepSfGFP when siRNA targeted to the 3′-UTR of ABCG1 is substituted for the siRNA smart pool. Quantification from Western blots; n = 3. (C) Fluorescence images showing extensive (but not full) colocalization of stably expressed N-terminally tagged GFP-ABCG1 and of the nonfunctional Walker domain mutant GFP-ABCG1(K124M) with concentrated proinsulin and the trans-Golgi marker Golgin97. (D) Loss of NPY-mCherry caused by siRNA targeted to the 3′-UTR of ABCG1 occurs in control INS1 cells; n = 6. Loss is averted in INS1 cells stably expressing a low level of GFP-ABCG1 chimera lacking the 3′-UTR but not when the cells express nonfunctional GFP-ABCG1(K124M). Quantification from Western blots; n = 3. Data are presented as means ± SEM. p values are determined by Student’s t test; *, p < 0.05; **, p < 0.01; ****, p < 0.0001.
FIGURE 3:
FIGURE 3:
Deficiency of ABCG1 does not increase unstimulated secretion of hPro-CpepSfGFP or CpepSfGFP but instead causes loss of CpepSfGFP by lysosomal degradation. The loss is attenuated by adding exogenous cholesterol during knockdown. (A) Secreted hPro-CpepSfGFP and CpepSfGFP (normalized to cell protein) by ABCG1-deficient cells is similar to or slightly less than that observed for control knockdown cells that were incubated for 20 h without stimulation. Quantification from Western blots; n = 3. (B) Knockdown of ABCG1 does not alter the intracellular distribution of proinsulin or VAMP4 immunostaining. Quantification shows that the perinuclear area occupied by proinsulin or VAMP4 fluorescence is unchanged (control cells, # = 30 [proinsulin], # = 20 [VAMP4]; ABCG1 cells, # = 17 [proinsulin], # = 21 [VAMP4]). (C) Loss of hPro-CpepSfGFP and CpepSfGFP induced by depletion of ABCG1 is diminished by endocytic uptake of lysosomal enzyme inhibitors during the final portion of RNAi-mediated knockdown. Quantification from Western blots; n = 3. The accompanying representative image shows the bands for hPro-CpepSfGFP (hPro) and CpepSfGFP (Cpep) as well as the lower-molecular-weight band (Lys) that is a putative intermediate in the lysosomal degradation of CpepSfGFP. (D) Exogenous cholesterol (20 μM) added during the final day of knockdown of ABCG1 decreases the loss of CpepSfGFP. Quantification from Western blots; n = 5. The accompanying representative image shows the same bands as in C; an example image of γ-adaptin used for normalization in all experiments (see Materials and Methods) is shown at the bottom. Data are presented as mean ± SEM. p values are determined by Student’s t test; *, p < 0.05; **, p < 0.01; ****, p < 0.0001.
FIGURE 4:
FIGURE 4:
Effects of ABCG1 knockdown on granule formation. (A) Production and processing of 35S-amino acid–labeled proinsulin are not affected by depletion of ABCG1 in INS1 cells. Representative phosphorimage comparing labeled proinsulin/insulin in control and ABCG1 knockdown cells. Quantitative results pooled from three experiments (0–2 h chase; extended to 4 h chase in two of the experiments) show that accumulation of labeled insulin during granule formation is noticeably decreased by ABCG1 knockdown. (B) Transport and processing of procathepsin B (to cathepsin B in lysosomes) is not affected by ABCG1 knockdown. The phosphorimage is representative of two separate experiments. (C) Tracking of hPro-CpepSfGFP and CpepSfGFP in GRINCH cells following pulse labeling with 35S-amino acids. Representative phosphorimage shows the progressive processing of hPro-CpepSfGFP (hPro) through an intermediate (Int) to CpepSfGFP (Cpep) as well as accumulation of a lysosomal degradation band (Lys) in control and ABCG1 knockdown samples. Quantification shows no effect of ABCG1 knockdown or of cholesterol-MβCD addition on the level and processing of hPro-CpepSfGFP. For CpepSfGFP, levels are significantly decreased by ABCG1 knockdown starting at 1 h (p < 0.05). Rescue of CpepSfGFP levels by cholesterol-MβCD addition (ABCG1 + chol) is indicated by no significant difference from control (starting at 1 h) and significant difference (p < 0.05) from ABCG1 (starting at 2 h). (D) Addition of MβCD alone significantly increases the loss of CpepSfFP in ABCG1-deficient samples by 2 h (results for hPro-CpepSfGFP mimic those in C [unpublished data]). Significance determined by two-way analysis of variance (ANOVA); n = 3 in C and in D. Data are presented as mean ± SEM.
FIGURE 5:
FIGURE 5:
Effects of ABCA1 knockdown as compared with knockdowns of ABCG1 and of ABCs G1 and A1 in combination. Tracking of hPro-CpepSfGFP and CpepSfGFP in GRINCH cells during chase incubation following pulse labeling with 35S-amino acids as in Figure 4C. (A) Quantification shows no effect on the level and processing of hPro-CpepSfGFP (left). ABCA1 knockdown does not decrease CpepSfGFP as much as in ABCG1 knockdown, and ABCG1/A1 combined knockdown does not significantly decrease CpepSfGFP beyond the level observed in ABCG1 knockdown alone (right). CpepSfGFP levels in ABCA1 knockdown samples are significantly less than in control (p < 0.05) only at 1 h. Significance determined by two-way ANOVA; n = 5. (B) Cholesterol-MβCD addition does not affect the small loss of CpepSfGFP observed in ABCA1-deficient samples. Addition of MβCD alone slightly, but not significantly, aggravates the loss of CpepSfGFP in ABCA1-deficient samples; n = 2. Data are presented as mean ± SEM.
FIGURE 6:
FIGURE 6:
Effects of OSBP depletion on hPro-CpepSfGFP and CpepSfGFP. (A) OSBP immunostaining is concentrated in puncta that colocalize at the TGN with Golgin 97 (left) and are closely apposed to proinsulin (right). SfGFP mainly marks insulin granules and overlaps proinsulin (cyan) in young granules. Specificity of OSBP staining documented in Supplemental Figure S6. (B) Steady-state levels of both hPro-CpepSfGFP and CpepSfGFP are significantly decreased in OSBP knockdown cells as compared with control knockdown cells and are not restored by exogenous cholesterol. Quantification from Western blots; n = 4. (C) Endocytic uptake of lysosomal inhibitors partially restores both hPro-CpepSfGFP (hPro) and CpepSfGFP (Cpep) and increases the lysosomal SfGFP degradation product (Lys) in OSBP-depleted samples. The included image shows a representative Western blot (noncontiguous lanes are from the same blot). Quantification from Western blots; n = 4. (D) Images showing distinct separation of SfGFP fluorescence and Golgin97 immunostaining in control and ABCG1 knockdowns but increased overlap in OSBP knockdowns. Accompanying plot shows Manders’ overlap; control cells, # = 26; OSBP KD cells, # = 31. Data are presented as mean ± SEM; p values are determined by Student’s t test; *, p < 0.05; **, p < 0.01; ***, p < 0.001; ****, p < 0.0001.
FIGURE 7:
FIGURE 7:
OSBP depletion reduces synthesis of hPro-CpepSfGFP and decreases CpepSfGFP accumulation but does not amplify the effects of ABCG1 knockdown. (A) Effect of OSBP knockdown and pretreatment with exogenous cholesterol on biosynthetically labeled hPro-CpepSfGFP and CpepSfGFP. hPro-CpepSfGFP levels in OSBP KD (+/− cholesterol) are significantly different from control (+/− cholesterol) at 0 and 1 h. CpepSfGFP levels (+/− cholesterol) are significantly different in OSBP KD from control (+/− cholesterol) at 1 h and later. Significance determined by two-way ANOVA; n = 3. (B) Neither shortening the labeling period (left) nor including the proteasomal inhibitor MG132 (right) affects the level of accumulation of hPro-CpepSfGFP. Data (intensity/mg protein) are normalized to the control (n = 2, each in duplicate). (C) Cholesterol biosynthesis as measured by [3H]acetate incorporation showing a slight decrease in ABCG1-depleted cells and strong decrease in OSBP-depleted cells. Quantification from scintillation counting of [3H]cholesterol separated by thin-layer chromatography; n = 3–5. (D) Modest but not significant decrease in filipin fluorescence concentrated perinuclearly in OSBP KD as compared with control. Fixed and stained cells are shown in reverse contrast to highlight perinuclear fluorescence, which was quantified and normalized to total cell fluorescence; control cells, # = 84; OSBP KD cells, # = 91 cells. Significance determined by Student’s t test. (E) Combined knockdown of ABCG1 and OSBP does not increase the loss of CpepSfGFP beyond the level observed with either knockdown alone. Quantification from Western blots; n = 3. Data are presented as mean ± SEM; p values are determined by Student’s t test; *, p < 0.05; **, p < 0.01.
FIGURE 8:
FIGURE 8:
Glucose-stimulated secretion measured by release of fluorescence (SfGFP) is inhibited in cells depleted of ABCG1 or OSBP (A) and ABCA1 and combined ABCs G1 and A1 (B). Addition of 20 μM cholesterol-MβCD restores output in ABCG1-, ABCA1- and ABCG1/A1-depleted samples but not in OSBP-depleted samples. n = 3 (A); n = 2 (B). (C) In contrast to addition of cholesterol-MβCD, addition of MβCD alone does not rescue stimulated secretion; n = 3. Western blot images (Supplemental Figure S8) illustrate the proteins contributing to the fluorescent signal in secretion and cell lysates. Significance was determined by one-way ANOVA. Data are presented as mean ± SEM. *, p < 0.05; **, p < 0.01; ***, p < 0.001; ****, p < 0.0001.
FIGURE 9:
FIGURE 9:
Model of regulatory role of cholesterol dynamics in the insulin secretory pathway. During proinsulin synthesis and vesicular transport from the ER, there is parallel nonvesicular transport of cholesterol from the ER to the TGN that is mediated by OSBP acting at interorganellar contacts. Cholesterol transport along this pathway simultaneously aids in maintaining the low cholesterol content of the ER and provides cholesterol that is essential for supporting the normal level of stable insulin granule formation. At the TGN, ABCG1- and ABCA1-driven phospholipid translocation and cholesterol redistribution to the inner membrane leaflet promotes formation of new cholesterol-enriched membranes of nascent insulin granules. Deficiency in either OSBP or ABCG1 augments lysosomal degradation of young insulin granules, whereas deficiency of ABCA1 has a smaller effect at this level. The possible pathways of granule degradation (1 vs. 2) are discussed in the text. Exogenous cholesterol suppresses degradation in ABCG1-deficient cells but not in OSBP-deficient cells. The total granule pool that has escaped lysosomal degradation is nevertheless still affected by deficiency of ABCG1, ABCA1, or OSBP as indicated by their diminished exocytosis upon glucose stimulation.

Similar articles

Cited by

References

    1. Ahras M, Otto GP, Tooze SA. (2006). Synaptotagmin IV is necessary for the maturation of secretory granules in PC12 cells. J Cell Biol , 241–251. - PMC - PubMed
    1. Ansari I-UH, Longacre MJ, Paulusma CC, Stoker SW, Kendrick MA, MacDonald MJ. (2015). Characterization of P4 ATPase phospholipid translocases (flippases) in human and rat pancreatic beta cells: their gene silencing inhibits insulin secretion. J Biol Chem , 23110–23123. - PMC - PubMed
    1. Arnaoutova I, Jackson CL, Al-Awar OS, Donaldson JG, Loh YP. (2003). Recycling of Raft-associated prohormone sorting receptor carboxypeptidase E requires interaction with ARF6. Mol Biol Cell , 4448–4457. - PMC - PubMed
    1. Bäck N, Rajagopal C, Mains RE, Eipper BA. (2010). Secretory granule membrane protein recycles through multivesicular bodies. Traffic , 972–986. - PMC - PubMed
    1. Balch WE, Rothman JE. (1985). Characterization of protein transport between successive compartments of the Golgi apparatus: asymmetric properties of donor and acceptor activities in a cell-free system. Arch Biochem Biophys , 413–425. - PubMed

Publication types

MeSH terms

LinkOut - more resources