. 2018 Apr 11;38(15):3729-3740.
doi: 10.1523/JNEUROSCI.3212-17.2018. Epub 2018 Mar 14.

Regulation of Nociceptive Glutamatergic Signaling by Presynaptic Kv3.4 Channels in the Rat Spinal Dorsal Horn

Affiliations

Regulation of Nociceptive Glutamatergic Signaling by Presynaptic Kv3.4 Channels in the Rat Spinal Dorsal Horn

Tanziyah Muqeem et al. J Neurosci. .

Abstract

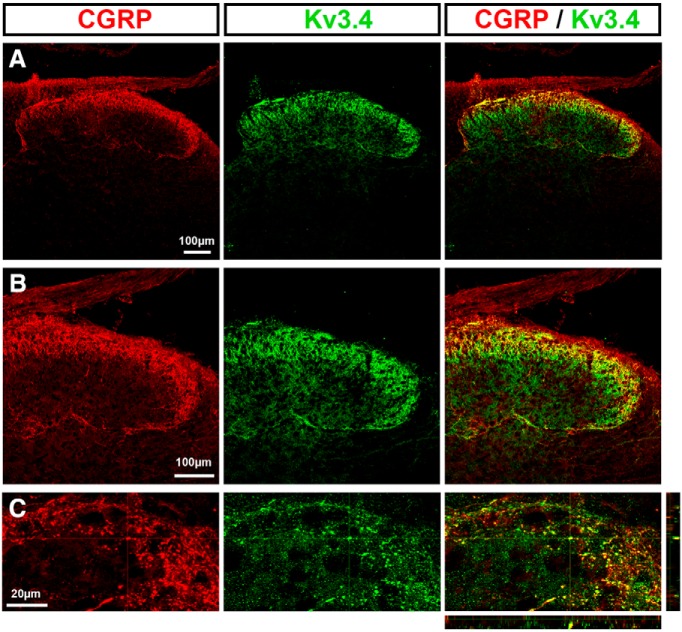
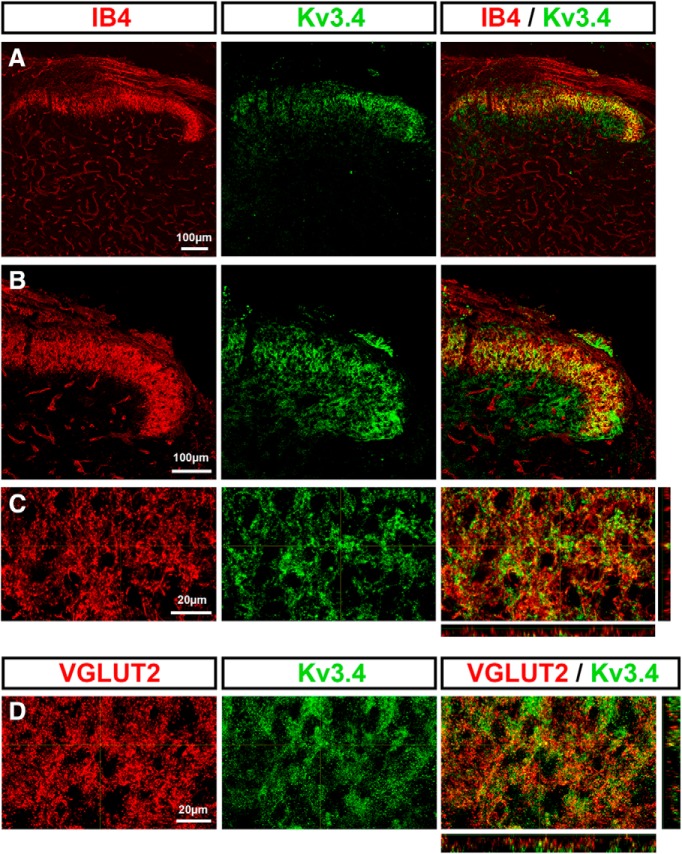
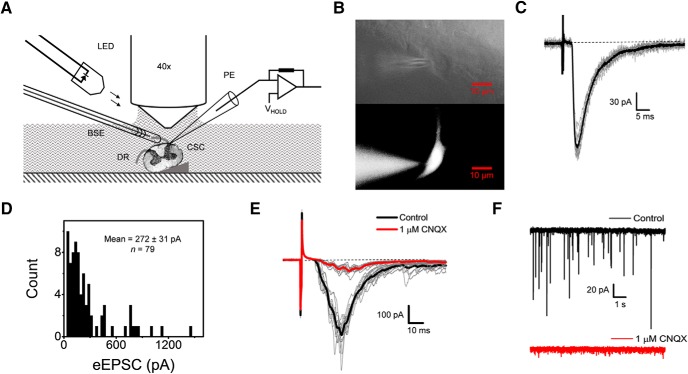
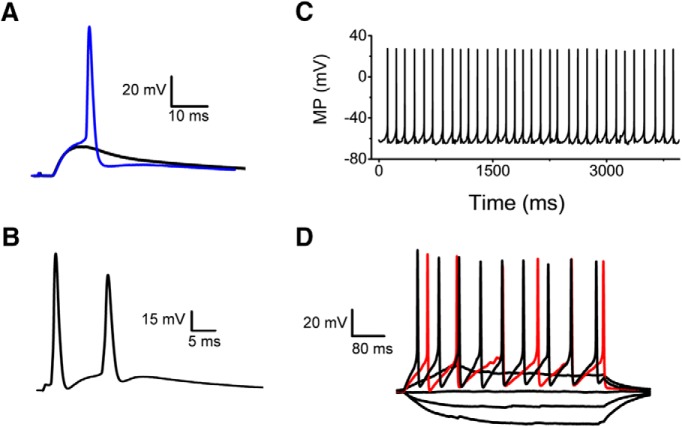
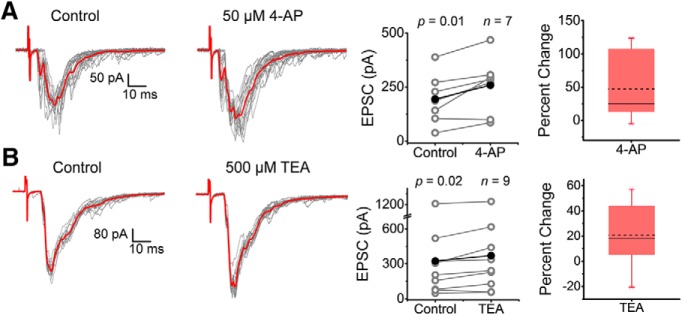
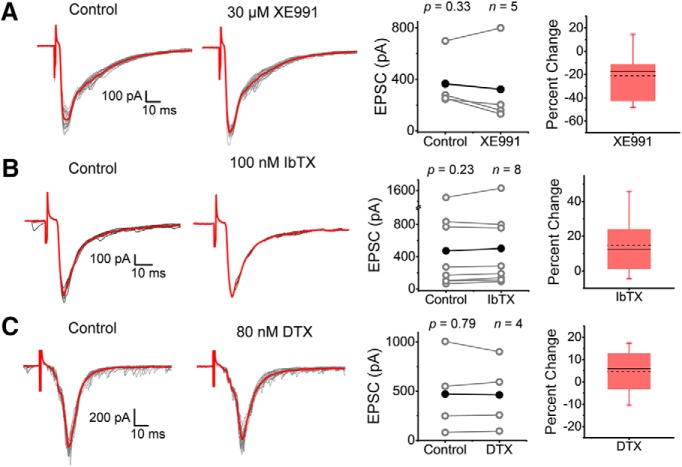
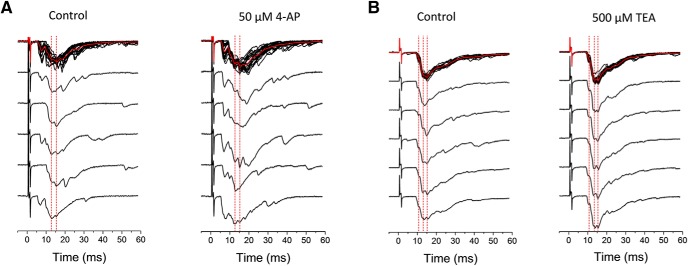
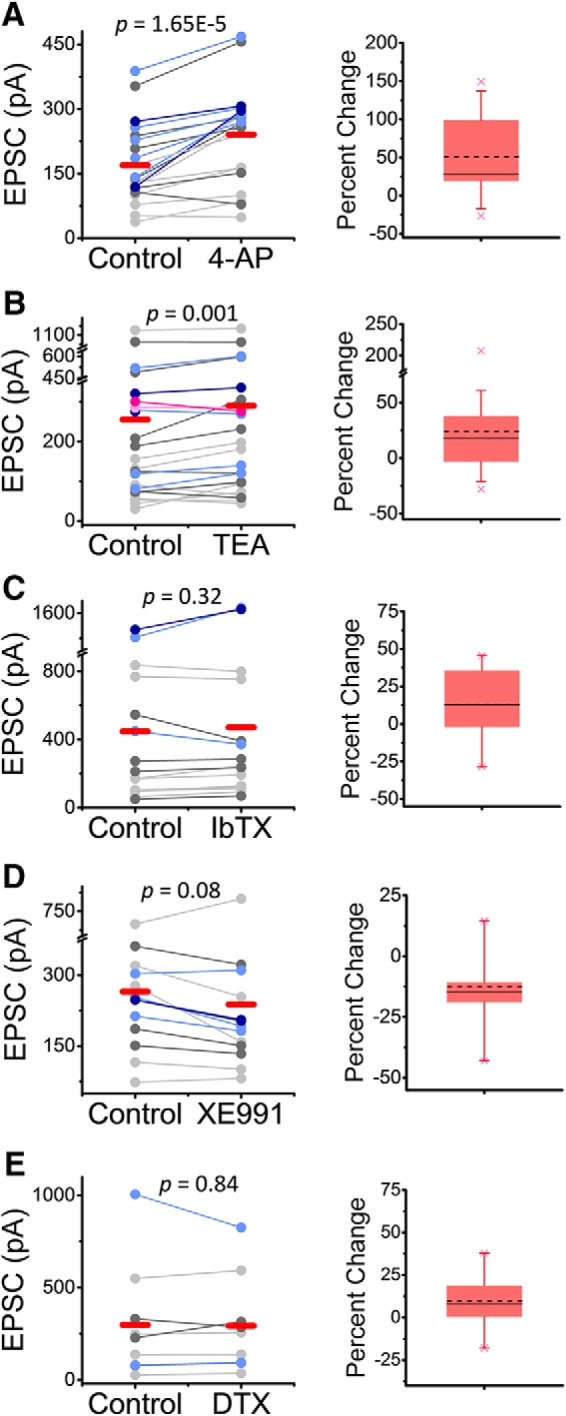
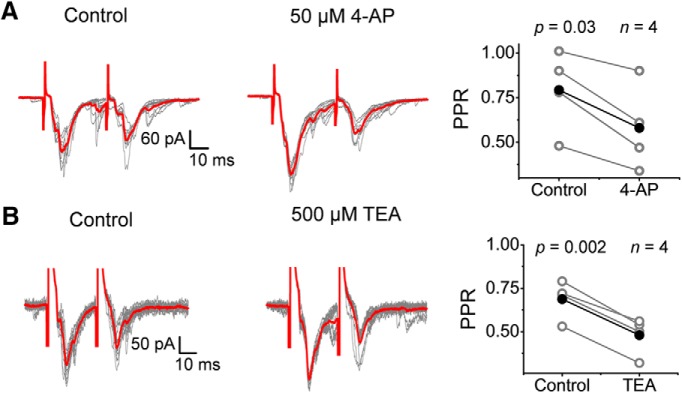
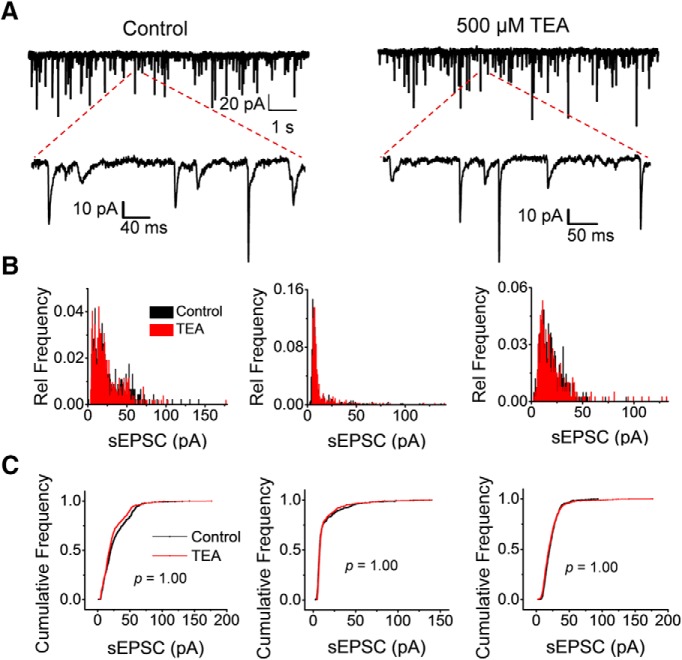
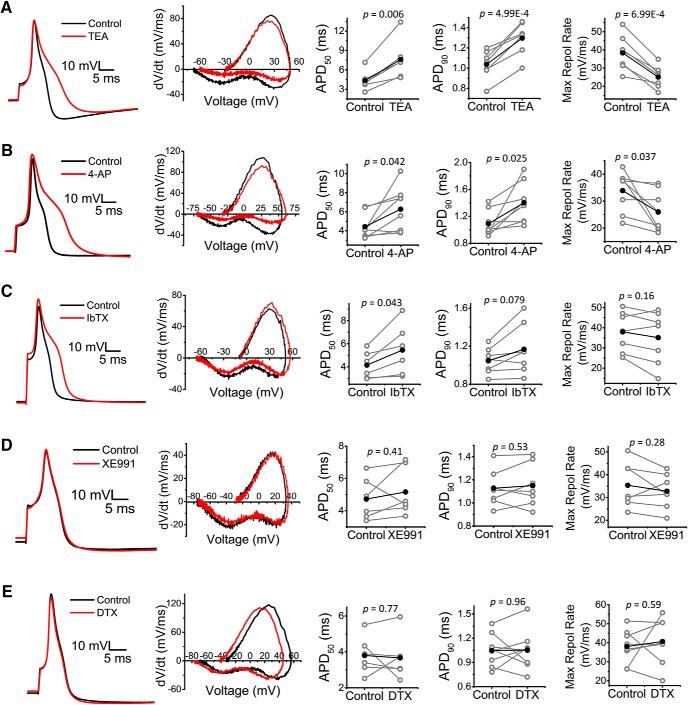
Presynaptic voltage-gated K+ (Kv) channels in dorsal root ganglion (DRG) neurons are thought to regulate nociceptive synaptic transmission in the spinal dorsal horn. However, the Kv channel subtypes responsible for this critical role have not been identified. The Kv3.4 channel is particularly important because it is robustly expressed in DRG nociceptors, where it regulates action potential (AP) duration. Furthermore, Kv3.4 dysfunction is implicated in the pathophysiology of neuropathic pain in multiple pain models. We hypothesized that, through their ability to modulate AP repolarization, Kv3.4 channels in DRG nociceptors help to regulate nociceptive synaptic transmission. To test this hypothesis, we investigated Kv3.4 immunoreactivity (IR) in the rat cervical superficial dorsal horn (sDH) in both sexes and implemented an intact spinal cord preparation to investigate glutamatergic synaptic currents from second order neurons in the sDH under conditions that selectively inhibit the Kv3.4 current. We found presynaptic Kv3.4 IR in peptidergic and nonpeptidergic nociceptive fibers of the sDH. The Kv3.4 channel is hypersensitive to 4-aminopyridine and tetraethylammonium (TEA). Accordingly, 50 μm 4-aminopyridine and 500 μm TEA significantly prolong the AP, slow the maximum rate of repolarization in small-diameter DRG neurons, and potentiate monosynaptic excitatory postsynaptic currents (EPSCs) in dorsal horn laminae I and II through a presynaptic mechanism. In contrast, highly specific inhibitors of BK, Kv7, and Kv1 channels are less effective modulators of the AP and have little to no effect on EPSCs. The results strongly suggest that presynaptic Kv3.4 channels are major regulators of nociceptive synaptic transmission in the spinal cord.SIGNIFICANCE STATEMENT Intractable neuropathic pain can result from disease or traumatic injury and many studies have been conducted to determine the underlying pathophysiological changes. Voltage-gated ion channels, including the K+ channel Kv3.4, are dysregulated in multiple pain models. Kv3.4 channels are ubiquitously expressed in the dorsal root ganglion (DRG), where they are major regulators of DRG excitability. However, little is known about the ionic mechanisms that regulate nociceptive synaptic transmission at the level of the first synapse in the spinal cord, which is critical to pain transmission in both intact and pathological states. Here, we show that Kv3.4 channels have a significant impact on glutamatergic synaptic transmission in the dorsal horn, further illuminating its potential as a molecular pain therapeutic target.

Keywords: Kv channel; pain transduction; spinal cord; synaptic transmission.


Figures

Figure 1.
Figure 1.
Colocalization of the Kv3.4 channel with the peptidergic nociceptive marker CGRP. Immunohistochemical staining demonstrates colabeling of CGRP with Kv3.4 protein. B and C are magnified areas of A.
Figure 2.
Figure 2.
Colocalization of the presynaptic Kv3.4 channel with the nonpeptidergic nociceptive marker isolectin B4 (IB4). AC, Immunohistochemical staining demonstrating colabeling of IB4 with Kv3.4 protein. B and C are magnified areas of A. D, Colabeling of Kv3.4 protein with the glutamatergic presynaptic marker VGLUT2.
Figure 3.
Figure 3.
Intact cervical spinal cord preparation for patch-clamp recordings of glutamatergic synaptic currents from the superficial dorsal horn. A, Schematic of the experimental setup representing its main components. Neurons in the superficial dorsal horn are visualized using oblique infrared LED illumination and a 40× immersion objective. The spinal cord (SC) was pinned at an angle of 10° to 15° on a piece of elastomer compound eraser. The spinal cord is represented by a cross-section of the cervical region with its axis perpendicular to the plane of the image. BSE, Bipolar stimulation electrode (suction electrode); DR, dorsal roots (one free and the other inside the suction electrode); PCE, patch-clamping electrode hooked up to a Multiclamp 700B amplifier. B, Images of lamina I neurons subjected to whole-cell patch clamping. Top, Infrared image. Bottom, Fluorescence image of neuron loaded with biocytin (conjugated with Alexa Fluor 488) through the PCE. C, Representative monosynaptic eEPSCs evoked consecutively by stimulating the DR (100 μA, 1 ms, 10 sweeps) while holding the neuron's VH at −70 mV (see Materials and Methods). The average trace is shown in black. D, Histogram of eEPSC peak amplitudes. The stimulus intensity ranged between 100 and 600 μA. E, Consecutive eEPSCs recorded before and after exposing the spinal cord to 1 μm CNQX (averages are displayed in black and red, respectively). F, Spontaneous glutamatergic synaptic currents at VH = −70 mV before (black) and after (red) exposure to 1 μm CNQX.
Figure 4.
Figure 4.
Spiking examples from neurons in the superficial dorsal horn. A, Subthreshold and suprathreshold responses evoked by a stimulus of 100 μA. B, Pair of APs exhibiting an afterdepolarization. This response was evoked by a brief 0.5 ms stimulus. C, Spontaneous spiking (resting membrane potential = −62 mV). D, Recording of passive and active responses evoked by sustained current injection (−20 to 30 pA). First active trace is shown in red.
Figure 5.
Figure 5.
eEPSCs from superficial dorsal horn neurons are potentiated by submillimolar concentrations of TEA and 4-aminopyridine. A, B, Left and center, Consecutive monosynaptic eEPSCs recorded before and after (15–20 sweeps) exposing the spinal cord to 50 μm 4-aminopyridine (A) and 500 μm TEA (B). Averages are displayed in red. Right, Pooled paired measurements of peak EPSCs before (control) and after exposure to 4-aminopyridine (A) and TEA (B), with box plots showing the percentage change in peaks across paired experiments. Sample size and p-values of the paired Student's t test are shown on the graphs. Stimulation parameters are as indicated in the legend to Figure 2 and in the Materials and Methods. Each symbol in the graphs represents an independent response from a separate spinal cord (i.e., the sample size corresponds to number of animals examined). Percentage change box plots describe the datasets as follows: dashed and solid lines represent mean and median, respectively; lower and upper edges of the box represent the 25th and 75the percentiles, respectively; bottom and top whiskers correspond to 5th and 95the percentiles, respectively; and crosses represent minimum and maximum values.
Figure 6.
Figure 6.
eEPSCs from superficial dorsal horn neurons are not affected by specific inhibitors of Kv7, BK, and Kv1 channels. AC, Left and center, Consecutive monosynaptic eEPSCs recorded before and after (2–30 sweeps) exposing the spinal cord to the indicated K+ channel inhibitors (XE991, IbTX, and α-DTX). Averages are displayed in red. Right, Pooled paired measurements of peak EPSCs before (control) and after exposure to the indicated inhibitors. Sample size and p-values of the paired Student's t test are shown on the graphs. Stimulation parameters are as indicated in the legend to Figure 2 and in the Materials and Methods. Each symbol in the graphs represents an independent response from a separate spinal cord (i.e., the sample size corresponds to number of animals examined). Percentage change box plots are displayed to the right of summary data plots (legend to Fig. 5 describes box plot characteristics).
Figure 7.
Figure 7.
Determination of monosynaptic responses from individual eEPSC traces. The EPSCs depict the response to 4-aminopyridine (A) and to TEA (B). Representative eEPSC traces from examples displayed in Figure 5 demonstrate consistent monosynaptic peaks across multiple traces (dashed red lines). The by-eye identification of the peaks in individual traces was generally confirmed by determining the regions of the average trace with the lowest variance around the average peak. The magnitude of these peaks was used for the analysis of monosynaptic eEPSCs in Figure 8.
Figure 8.
Figure 8.
Submillimolar 4-aminopyridine and TEA consistently potentiate monosynaptic EPSCs. Pooled paired average peaks from the multipeak analysis (Fig. 7) before and after exposure to 50 μm 4-aminopyridine (A), 500 μm TEA (B), 100 nm IbTX (C), 30 μm XE991 (D), and 80 nm α-DTX (E). Color scheme displays the numerical order of peaks in a given recording (light gray = first peak, dark gray = second peak, light blue = third peak, dark blue = fourth peak, light pink = fifth peak, dark pink = sixth peak, averages shown in red). The p-values of the paired Student's t test are shown on the graphs. Percentage change box plots are displayed to the right of summary data plots (Fig. 5 legend describes box plot characteristics).
Figure 9.
Figure 9.
Submillimolar 4-aminopyridine and TEA decrease the PPR. A, B, Paired pulse (interstimulus interval = 30–80 ms) EPSC recordings before and after (10 sweeps) exposing the spinal cord to 50 μm 4-aminopyridine (A) and 500 μm TEA (B). Right, Pooled paired measurements of the PPR (= P2/P1) before (control) and after exposure to 4-aminopyridine (A) and TEA (B). Sample size and p-values of the paired Student's t test are shown on the graphs. All recordings were conducted at VH = −70 mV. Stimulation parameters are as indicated in the legend to Figure 2 and in the Materials and Methods. Each symbol in the graphs represents an independent response from a separate spinal cord (i.e., the sample size corresponds to number of animals examined).
Figure 10.
Figure 10.
Submillimolar TEA does not affect sEPSCs. A, Representative sweeps of sEPSCs at −70 mV before and after exposing the spinal cord to 500 μm TEA (left and right, respectively). Magnified segments are also shown to demonstrate individual events. B, Relative frequency histograms of peak EPSC amplitudes from three independent recordings (three neurons each from three different spinal cords) before and after exposure to TEA. Relative frequency is the fraction of sEPSCs that falls into a given bin (bin size = 0.75 pA). C, Cumulative plots of sEPSC amplitudes corresponding to the data shown in B. In all three cases, the two-sample Kolmogorov–Smirnov test returned no difference between the control and TEA plots. The p-values are indicated on the plots.
Figure 11.
Figure 11.
Analysis of primary nociceptor APs in the absence and presence of several K+ channel inhibitors. Left to right, Representative AP traces, phase plane plots, and changes in APD50, APD90, and maximum repolarization rate (derived from phase plane plots) before and after exposure to 50 μm 4-aminopyridine (A), 500 μm TEA (B), 100 nm IbTX (C), 30 μm XE991 (D), and 80 nm α-DTX (E). Averages are shown in black and p-values of the paired Student's t test are displayed on graphs. Additional properties are reported in Table 4.

Similar articles

Cited by

References

    1. Antz C, Bauer T, Kalbacher H, Frank R, Covarrubias M, Kalbitzer HR, Ruppersberg JP, Baukrowitz T, Fakler B (1999) Control of K+ channel gating by protein phosphorylation: structural switches of the inactivation gate. Nat Struct Biol 6:146–150. 10.1038/5833 - DOI - PubMed
    1. Bean BP. (2007) The action potential in mammalian central neurons. Nat Rev Neurosci 8:451–465. 10.1038/nrn2148 - DOI - PubMed
    1. Beck EJ, Sorensen RG, Slater SJ, Covarrubias M (1998) Interactions between multiple phosphorylation sites in the inactivation particle of a K+ channel: insights into the molecular mechanism of protein kinase C action. J Gen Physiol 112:71–84. 10.1085/jgp.112.1.71 - DOI - PMC - PubMed
    1. Beekwilder JP, O'Leary ME, van den Broek LP, van Kempen GT, Ypey DL, van den Berg RJ (2003) Kv1.1 channels of dorsal root ganglion neurons are inhibited by n-butyl-p-aminobenzoate, a promising anesthetic for the treatment of chronic pain. J Pharmacol Exp Ther 304:531–538. 10.1124/jpet.102.042135 - DOI - PubMed
    1. Bocksteins E, Raes AL, Van de Vijver G, Bruyns T, Van Bogaert PP, Snyders DJ (2009) Kv2.1 and silent kv subunits underlie the delayed rectifier K+ current in cultured small mouse DRG neurons. Am J Physiol Cell Physiol 296:C1271–C1278. 10.1152/ajpcell.00088.2009 - DOI - PMC - PubMed

Publication types