. 2018 Apr 11;38(15):3708-3728.
doi: 10.1523/JNEUROSCI.1913-17.2018. Epub 2018 Mar 14.

JIP1-Mediated JNK Activation Negatively Regulates Synaptic Plasticity and Spatial Memory

Affiliations

JIP1-Mediated JNK Activation Negatively Regulates Synaptic Plasticity and Spatial Memory

Caroline Morel et al. J Neurosci. .

Abstract

The c-Jun N-terminal kinase (JNK) signal transduction pathway is implicated in learning and memory. Here, we examined the role of JNK activation mediated by the JNK-interacting protein 1 (JIP1) scaffold protein. We compared male wild-type mice with a mouse model harboring a point mutation in the Jip1 gene that selectively blocks JIP1-mediated JNK activation. These male mutant mice exhibited increased NMDAR currents, increased NMDAR-mediated gene expression, and a lower threshold for induction of hippocampal long-term potentiation. The JIP1 mutant mice also displayed improved hippocampus-dependent spatial memory and enhanced associative fear conditioning. These results were confirmed using a second JIP1 mutant mouse model that suppresses JNK activity. Together, these observations establish that JIP1-mediated JNK activation contributes to the regulation of hippocampus-dependent, NMDAR-mediated synaptic plasticity and learning.SIGNIFICANCE STATEMENT The results of this study demonstrate that c-Jun N-terminal kinase (JNK) activation induced by the JNK-interacting protein 1 (JIP1) scaffold protein negatively regulates the threshold for induction of long-term synaptic plasticity through the NMDA-type glutamate receptor. This change in plasticity threshold influences learning. Indeed, mice with defects in JIP1-mediated JNK activation display enhanced memory in hippocampus-dependent tasks, such as contextual fear conditioning and Morris water maze, indicating that JIP1-JNK constrains spatial memory. This study identifies JIP1-mediated JNK activation as a novel molecular pathway that negatively regulates NMDAR-dependent synaptic plasticity and memory.

Keywords: JIP1; JNK; LTP; fear; memory; plasticity.


Figures

Figure 1.
Figure 1.
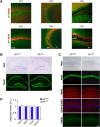
Analysis of JIP1 expression in the hippocampus. A, Fluorescent immunohistochemistry of the CA1, CA3, and DG regions of the hippocampus indicates that JIP1 (green) predominantly colocalizes with MAP2 (red) in wild-type brain sections (top), suggesting relative enrichment of the JIP1 protein in neuronal processes. Colocalization between JIP1 (green) and neuron-specific nuclear protein (NeuN; red) is sparse in the hippocampal subfields (bottom). CA1, Cornu ammonis 1; CA3, cornu ammonis 3; grDG, granular layer of DG; poDG, polymorphic layer of DG; s.l., stratum lucidem; s.l.m., stratum lacunosum moleculare; s.p., stratum pyramidale; s.r., stratum radiatum. Scale bar, 50 μm. B, Nissl stain and NeuN stain of JIP1WT and JIP1TA coronal hippocampal sections. Scale bar, 200 μm. C, D, Pyramidal cells of the CA1 region of JIP1WT and JIP1TA were stained with Nissl, NeuN, the dendritic marker MAP2, the astrocytic marker GFAP, and the inhibitory GABAergic marker GAD67 (C). The staining was quantitated (D) (mean ± SEM; n = 4; p > 0.05; Student's t test). Scale bar, 50 μm.
Figure 2.
Figure 2.
Neuronal spine density and dendritic arborization of CA1 pyramidal neurons are similar in JIP1WT and JIP1TA mice. A, Representative images of apical and basal dendrites spine morphology in JIP1TA mice and JIP1WT littermates. Scale bar, 10 μm. B, Quantitation of basal and apical dendritic spine density (mean ± SEM; n = 5 slices from 5 mice per genotype; p > 0.05, Student's t test). C, Quantitation of different spine types in basal and apical dendrites (mean ± SEM, n = 5 slices from 5 mice per genotype; p > 0.05, Student's t test). D, E, Sholl analysis of dendritic arborization of CA1 pyramidal neurons. Values on the x-axis represent increasing distance from the soma of the pyramidal cells. Basal and apical dendrites of pyramidal cells from n = 5 slices from 5 mice per genotype were examined (mean ± SEM; p > 0.05, Student's t test).
Figure 3.
Figure 3.
JIP1-dependent JNK activation in the hippocampus is suppressed in JIP1TA mice. AC, JIP1WT and JIP1TA mice were treated by systemic injection of kainate. At 2 h after treatment, sections of the brain were prepared and stained (green) with antibodies to pSer63 cJun (A), cJun (B), or cFos (C). DNA was stained with DAPI (red). Representative sections of the DG of the hippocampus are presented. Scale bar, 75 μm. D, E, Extracts prepared from the hippocampus of JIP1WT and JIP1TA mice treated with kainate (0–60 min) were examined by multiplexed ELISA to measure the amount of pSer63-cJun (D) and cJun (E) normalized to the amount of JNK. Data are shown as mean ± SEM. n = 5; **p < 0.01, two-way ANOVA followed by Bonferroni's post hoc test.
Figure 4.
Figure 4.
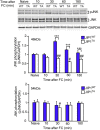
JIP1TA mice exhibit reduced JNK activation in the dorsal hippocampus after contextual fear conditioning. Dorsal hippocampal tissue was isolated from naive mice and from mice at different times after contextual fear conditioning (FC) and examined by immunoblot analysis by probing with antibodies to phospho-JNK, JNK, and GAPDH. The amount of 46 and 54 kDa phospho-JNK was quantitated and normalized to the amount of JNK in each sample. Data are shown as mean ± SEM. n = 5; ***p < 0.001, for JIP1TA compared with JIP1WT mice; #p < 0.01, ##p < 0.001 compared with the naive control, two-way ANOVA, followed by Bonferroni's post hoc test.
Figure 5.
Figure 5.
The threshold for LTP induction is reduced in JIP1TA mice. A, B, Basal synaptic transmission at Schaffer collateral–CA1 synapses, as assessed by measuring the fEPSP I/O relationship (A) and the fEPSP slope to fiber volley relationship (B), was similar in JIP1TA slices (n = 16 slices, 13 mice) compared with slices obtained from JIP1WT littermates (n = 16 slices, 12 mice). No statistically significant differences were found (p > 0.05, two-way repeated-measures ANOVA). C, fEPSPs from JIP1TA (n = 16 slices, 13 mice) and JIP1WT (n = 16 slices, 12 mice) slices exhibited similar paired pulse facilitation. No statistically significant differences were found (p > 0.05, two-way repeated-measures ANOVA). D, HFS LTP was induced by two trains of 100 Hz stimulation (separated by a 20 s interval) to the Schaffer collaterals in slices from JIP1TA and JIP1WT mice (n = 10 slices, 8 mice/genotype). Stimulation was delivered at time 0 (arrow). No statistically significant differences were found (p > 0.05, Student's t test). E, An intermediate stimulation LTP protocol involved 900 pulses of 10 Hz stimuli delivered at time 0. LTP induced at intermediate frequencies was significantly facilitated in slices taken from JIP1TA mice when compared with JIP1WT controls (n = 10 slices, 9 mice/genotype). Statistically significant differences are indicated (***p < 0.001, Student's t test). F, LTD induced by LFS (1 Hz, 900 pulses, 0–15 min time) was significantly reduced in JIP1TA slices compared with JIP1WT slices (n = 10 slices, 10 mice/genotype). Statistically significant differences are indicated (***p < 0.0001, Student's t test). G, LTD induced by 0.5 Hz stimulation (0.5 Hz, 900 pulses, 0–30 min time) was similar in JIP1WT and JIP1TA slices (n = 14 slices, 11 mice/genotype). No statistically significant differences were found (p > 0.05, Student's t test). H, Frequency–response function in JIP1TA and JIP1WT mice. The percentage change in synaptic strength from baseline in JIP1TA and JIP1WT mice at 50–60 min after stimulation at the indicated frequency is presented. Data are shown as mean ± SEM. Magnitudes of LTP/LTD were calculated as the ratio of the average fEPSPs between 50 and 60 min and average baseline fEPSPs between −20 min and 0 min. Statistically significant differences are indicated (***p < 0.001, Student's t test). I, mGluR-dependent LTP in hippocampal slices from JIP1TA and JIP1WT mice. mGluR-LTD was induced by incubation of JIP1TA and JIP1WT slices with DHPG (100 μm) for 5 min (n = 10 slices, 10 mice/genotype). Basal fEPSPs were recorded before LTD induction with DHPG. No statistically significant differences were found (p > 0.05, Student's t test). J, Depotentiation is not affected in JIP1TA mice. HFS (100 Hz twice for 1 s with 20 s interval) followed by 1 Hz (15 min) stimulation 10 min later to the Schaffer collaterals produced similar depotentiation in slices from JIP1TA and JIP1WT mice (n = 10 slices, 10 mice/genotype). No statistically significant differences were found (p > 0.05, Student's t test). The insets in DJ show representative fEPSP responses obtained before and after LTP, LTD and depotentiation inducing stimuli. Calibration: 0.2 mV/10 ms.
Figure 6.
Figure 6.
Inhibition of JNK signaling mimics the effect of JIP1 (Thr103Ala) mutation on NMDAR-dependent LTD. A, B, JNK-in-8 treatment did not affect baseline synaptic transmission or PPF in wild-type slices. I/O curves, as assessed by the fEPSP slope to fiber volley relationship, were similar in vehicle-treated slices (n = 12 slices) compared with wild-type slices treated with JNK-in-8 (n = 12 slices; A). fEPSPs from vehicle-treated slices (n = 12 slices) and JNK-in-8 treated (n = 12 slices) slices exhibited similar PPF (B; p > 0.05, two-way repeated-measures ANOVA). C, HFS-LTP was induced with a pair of 100 Hz tetani in the presence of either vehicle (n = 12) or 6 μm JNK-in-8 (n = 12). LTP was unaffected by JNK inhibition. (p > 0.05, Student's t test). D, LFS-LTD was induced (1 Hz, 900 pulses) in the presence of either vehicle (n = 10) or 6 μm JNK-in-8 (n = 10). LTD was impaired by JNK inhibition (***p < 0.001, Student's t test). The insets in C and D show representative fEPSP responses obtained before and after LTP/LTD-inducing stimuli. Calibration: 0.2 mV/10 ms.
Figure 7.
Figure 7.
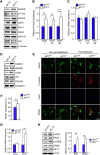
The JIP1TA mutation promotes increased NMDAR expression and activity. AC, Lysates prepared from the hippocampi of JIP1TA and JIP1WT mice were examined by immunoblot analysis by probing with antibodies to NMDA and AMPAR subunits, SAP102, JIP1, and β-tubulin (A). The number of NMDAR subunits in the hippocampus was determined and normalized to the amount of β-tubulin in each sample (B, mean ± SEM, n = 5; **p < 0.01, Student's t test). The amount of NMDAR subunit mRNA in the hippocampus was measured by qRT-PCR and normalized to the amount of Gapdh mRNA in each sample (C, mean ± SEM, n = 5; p > 0.05, Student's t test). D, Enrichment of NMDAR subunits in the synaptoneurosome fraction of the hippocampus of JIP1WT and JIP1TA mice was examined by immunoblot analysis. E, F, Primary JIP1WT and JIP1TA hippocampal neurons were fixed and processed for immunofluorescence analysis under nonpermeabilized (left) and permeabilized (right) conditions. GluN1 surface and intracellular expression was examined by confocal microscopy (E). Quantitation of the cell surface expression of GluN1 in JIP1TA and JIP1WT hippocampal neurons was performed using ImageJ software (F). Data are shown as mean ± SEM; n = 8∼10; **p < 0.01, Student's t test. G, The expression of cJun and cFos mRNA in the hippocampus of JIP1WT and JIP1TA mice was normalized to the amount of Gapdh in each sample (mean ± SEM, n = 5∼6). Statistically significant differences are indicated (**p < 0.01, Student's t test). H, Lysates prepared from the hippocampus of JIP1WT and JIP1TA mice were examined by immunoblot analysis with antibodies to phospho-ERK, ERK, phospho-CREB, CREB, KIF17, and β-Tubulin. The amount of phospho-ERK and phospho-CREB was quantitated (mean ± SEM, n = 5). Statistically significant differences are indicated (**p < 0.01, Student's t test).
Figure 8.
Figure 8.
Increased synaptic NMDAR activity in hippocampal slices from JIP1TA mice. A, Whole-cell voltage-clamp traces depicting typical EPSCs elicited by stimulating the Schaffer collaterals while recording CA1 pyramidal cells from JIP1WT and JIP1TA hippocampal slices. Strong blockade of NMDARs at a holding potential of −70 mV by magnesium isolates the AMPA component (bottom traces). The +50 mV upper traces primarily represent the NMDA component because the traces were recorded 30–50 ms after stimulation when ∼90% of the AMPAR response had decayed. The traces show the increase in the NMDAR-mediated component for the JIP1TA group relative to JIP1WT, whereas AMPAR mediated responses were not different. Traces depicted are averages of 20 sweeps for both NMDA and AMPAR-mediated components of JIP1WT recorded from the same pyramidal neuron; 10 and 15 sweeps were used to produce the averages depicted for the NMDA and AMPAR-mediated components recorded from a JIP1TA pyramidal neuron. B, C, Comparison of average NMDA and AMPAR currents. NMDAR-mediated currents (B) were significantly greater in the JIP1TA group compared with the JIP1WT group (mean ± SEM; n = 16 ∼ 17 cells; *p < 0.05, Student's t test), whereas average AMPAR-mediated currents (C) did not differ. D, NMDA to AMPAR current ratios were evaluated on a cell-by-cell basis. The JIP1TA ratios (INMDA/IAMPA) were larger than ratios measured from neurons in the JIP1WT group (mean ± SEM; n = 16 ∼ 17 cells; *p < 0.05, Student's t test). E, F, NMDA-stimulated gene expression in primary cultures of JIP1WT and JIP1TA hippocampal neurons was studied by treating neurons with 100 μm NMDA plus 10 μm glycine. The expression of Bdnf (E) and cFos (F) mRNA was quantitated by qRT-PCR and normalized to Gapdh (mean ± SEM; n = 5∼6; ***p < 0.001, two-way ANOVA followed by Bonferroni's post hoc test).
Figure 9.
Figure 9.
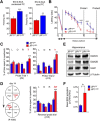
JIP1TA mice display normal locomotor function, motor coordination, elevated anxiety-like behavior, and increased acoustic startle response. AC, Results of elevated plus maze test. JIP1TA mice show decreased time spent in open arms (A) and increased time spent in closed arms (B) relative to wild-type mice, indicative of elevated anxiety-like behaviors. In addition, JIP1TA mice show normal activity as measured by total distance traveled (C). Data are shown as mean ± SEM. n = 10; **p < 0.01, Student's t test. D, E, Open-field test. JIP1TA mice show increased anxiety-like behavior in an open-field test. Mice were allowed to explore an open field for 5 min. JIP1TA mice spent more time in the periphery (D) and less time in the center region of the open field (E), both indicators of increased levels of anxiety-like behavior in this test. Data are shown as mean ± SEM. n = 10; ***p < 0.001, Student's t test. F, JIP1TA mice showed an increased acoustic startle response for the 110 dB acoustic startle stimulus compared with JIP1WT mice (mean ± SEM; n = 8; *p < 0.05, two-way repeated-measures ANOVA followed by Bonferroni's post hoc comparisons tests). G, No significant differences in PPI for the 74, 80, and 86 dB pre-pulse sound levels followed by a 110 dB startle stimulus were observed between JIP1TA and JIP1WT mice (mean ± SEM; n = 8; p > 0.05, two-way repeated-measures ANOVA followed by Bonferroni's post hoc test. H, JIP1TA mice have normal balance and motor coordination, but impaired skill learning on the rotarod. Mice received four trials on day 1 (trials 1–4) and day 2 (trials 5–8). The duration of balance or latency to fall (4–40 rpm over 5 min) was recorded. Mice were trained on day 1 to establish baseline performance and retested 24 h later to measure skill learning. Both JIP1TA and JIP1WT mice exhibited increased skill in maintaining balance on the rotarod over the first four trials on day 1. On day 2, JIP1TA mice failed to display motor coordination achieved after the day 1, indicative of impaired motor learning in the rotarod task. Data are shown as mean ± SEM; n = 8; *p < 0.05, two-way repeated-measures ANOVA followed by Bonferroni's post hoc test.
Figure 10.
Figure 10.
JIP1TA mice display enhanced contextual fear and impaired fear extinction. A, “Strong” (0.8 mA electric shock) training demonstrated that JIP1TA and JIP1WT littermate mice exhibited similar contextual freezing when tested immediately after training or 1 h later, but the JIP1TA mice froze more than JIP1WT mice at 24 h after training (left). Foot-shock reactivity during fear-conditioning training did not significantly differ between JIP1TA and JIP1WT mice (right). Data are shown as mean ± SEM. n = 10 ∼ 11; ***p < 0.001, Student's t test. B, “Weak” (0.4 mA electric shock) training demonstrated that JIP1TA mice (n = 14) exhibited contextual freezing that was similar to the “strong” training schedule, but JIP1WT mice (n = 14) displayed significantly less contextual fear conditioning at 24 h after training. Data are shown as mean ± SEM. n = 14; ***p < 0.001, Student's t test. C, JIP1TA and JIP1WT littermate mice were infused with vehicle or the selective NMDAR antagonist APV (10 μg/ml) before “strong” (0.8 mA) contextual fear conditioning. The following day, there was a similar impairment in both genotypes in freezing levels to the conditioning context. Data are shown as mean ± SEM. n = 10; ***p < 0.001 vs JIP1WT+ veh; n.s.; JIP1WT+ APV vs JIP1TA+ APV; two-way ANOVA followed by Bonferroni's post hoc test. D, JIP1TA and JIP1WT littermate mice were trained by “strong” (0.8 mA electric shock) contextual fear conditioning. Extinction began 24 h later and consisted of daily 3 min reexposures of mice to the conditioning context in the absence of shock. When compared with JIP1WT littermates, JIP1TA mice showed increased freezing behavior throughout extinction days 1–7 (E1–E7), indicating impaired extinction process in JIP1TA mice. Data are shown as mean ± SEM. n = 10; *p < 0.05, ***p < 0.001; two-way repeated-measures ANOVA followed by Bonferroni's post hoc test. E, “Weak” (0.4 mA electric shock; left) and “strong” (0.8 mA; right) cued fear training, consisting of a single pair of cue (tone) and shock, demonstrated that JIP1TA and JIP1WT mice exhibited enhanced conditioned freezing to a cue (tone) when tested 24 h after training. Data are shown as mean ± SEM. n = 11; *p < 0.05, **p < 0.01, Student's t test.
Figure 11.
Figure 11.
JIP1TA mice exhibit enhanced acquisition and reversal learning in the MWM test. AC, JIP1TA and JIP1WT littermate mice learned the visible platform task (day 1 and 2), as indicated by reductions in escape time during training. The mice were then trained to find a hidden platform during the next 7 d. JIP1TA mice showed faster escape latencies at days 6–9 of training compared with JIP1WT littermates (A). A first probe test (day 10) was conducted 24 h after the completion of training. No significant differences in percentage time spent in the target quadrant (T) between JIP1TA and JIP1WT mice were observed (B). The mice were then subjected to 2 d of additional training (days 11–12) and a second probe trial was performed 24 h later. No significant differences between JIP1TA and JIP1WT mice were observed during second probe trial (C). Data are shown as mean ± SEM. n = 14; *p < 0.05, f(two-way repeated-measures ANOVA, followed by Bonferroni's post hoc test. DF, Twenty-four hours after the second probe test, the platform was moved to the opposite quadrant in the pool and mice were trained for four trials (day 14, reversal learning). In this new setting, JIP1TA mice displayed shorter escape time to find newly placed platform (NT) compared with JIP1WT littermate mice (E). The probe test for reversal training was conducted 24 h after the completion of new platform training (day 15). Analysis of the time spent in the quadrants revealed that JIP1TA mice spent significantly more time in the NT than JIP1WT mice (F). Data are shown as mean ± SEM. n = 14; *p < 0.05, ***p < 0.001, two-way repeated-measures ANOVA (E) and two-way ANOVA (F) followed by Bonferroni's post hoc tests.
Figure 12.
Figure 12.
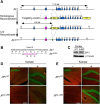
Suppression of kainate-induced JNK activity in the hippocampus of JIP1ΔJBD mice. A, B, A targeting vector was designed to replace JIP1 residues Leu160-Asn161-Leu162 with Gly160-Arg161-Gly162 in exon 3 of the Jip1 gene by homologous recombination in ES cells. The floxed NeoR cassette inserted in intron 3 and used for selection was deleted with Cre recombinase. H, HindIII restriction enzyme. C, Lysates prepared from the cerebral cortex of Jip1+/+ (WT) and Jip1ΔJBD/ΔJBD (ΔJBD) mice were examined by immunoblot analysis using antibodies to JIP1 and β-Tubulin. D, E, JIP1WT and JIPΔJBD mice were treated without and with kainate. Representative sections of the DG stained (green) with antibodies to phospho-cJun (D) or cJun (E) are presented. DNA was stained with DAPI (red). Scale bar, 75 μm.
Figure 13.
Figure 13.
Disruption of the JBD (ΔJBD) on JIP1 causes enhanced associative learning. A, Contextual and cued fear conditioning of JIP1ΔJBD and JIP1WT mice consisted of one exposure to cue (context + tone) and 0.8 mA shock (mean ± SEM; n = 10∼11; **p < 0.01, Student's t test ***p < 0.001, Student's t test). B, C, MWM tests of mean latencies to escape to a visible (days 1–2) or a hidden platform (days 3–12) are presented for JIP1ΔJBD or JIP1WT mice (B). Probe trials were performed on days 9 and 13 of water maze training (C). JIP1ΔJBD mice spent significantly longer time in the target quadrant compared with JIP1WT littermates (mean ± SEM; n = 10; *p < 0.05; **p < 0.01; ***p < 0.001, two-way repeated-measures ANOVA (B) and two-way ANOVA (C) followed by Bonferroni's post hoc tests). D, The water maze platform was moved to the opposite quadrant in the pool and mice were trained for four trials (day 14, reversal learning). The probe test for reversal training was conducted 24 h after the completion of new platform training (day 15). Analysis of the time spent in the quadrants during the probe trial revealed that JIP1ΔJBD mice spent significantly more time in the NT than JIP1WT mice (mean ± SEM; n = 10; ***p < 0.001, two-way ANOVA followed by Bonferroni's post hoc test). E, Hippocampus lysates of JIP1WT, JIP1TA, and JIP1ΔJBD mice were examined by immunoblot analysis by probing with antibodies to NMDAR subunits and β-Tubulin. F, The amount of phospho-ERK in hippocampus lysates of naive JIP1WT and JIP1ΔJBD mice was quantified by multiplexed ELISA and normalized to the amount of ERK2 in each sample. Data are shown as mean ± SEM. n = 5; *p < 0.05, Student's t test.
Figure 14.
Figure 14.
A model of how JIP1-mediated JNK signaling regulates synaptic NMDAR expression. JIP1-dependent JNK activation by the NMDAR may suppress translation of NMDAR subunit mRNA (Grin1, Grin2a, Grin2b). Alternatively, the same pathway regulates cell surface insertion or retrieval of NMDARs and/or lateral diffusion of extrasynaptic NMDARs into synaptic sites.

Similar articles

Cited by

References

    1. Allaman-Pillet N, Størling J, Oberson A, Roduit R, Negri S, Sauser C, Nicod P, Beckmann JS, Schorderet DF, Mandrup-Poulsen T, Bonny C (2003) Calcium- and proteasome-dependent degradation of the JNK scaffold protein islet-brain 1. J Biol Chem 278:48720–48726. 10.1074/jbc.M306745200 - DOI - PubMed
    1. Bading H, Ginty DD, Greenberg ME (1993) Regulation of gene expression in hippocampal neurons by distinct calcium signaling pathways. Science 260:181–186. 10.1126/science.8097060 - DOI - PubMed
    1. Baptista J, Mercer C, Prigmore E, Gribble SM, Carter NP, Maloney V, Thomas NS, Jacobs PA, Crolla JA (2008) Breakpoint mapping and array CGH in translocations: comparison of a phenotypically normal and an abnormal cohort. Am J Human Genet 82:927–936. 10.1016/j.ajhg.2008.02.012 - DOI - PMC - PubMed
    1. Beffert U, Weeber EJ, Durudas A, Qiu S, Masiulis I, Sweatt JD, Li WP, Adelmann G, Frotscher M, Hammer RE, Herz J (2005) Modulation of synaptic plasticity and memory by reelin involves differential splicing of the lipoprotein receptor Apoer2. Neuron 47:567–579. 10.1016/j.neuron.2005.07.007 - DOI - PubMed
    1. Brigman JL, Wright T, Talani G, Prasad-Mulcare S, Jinde S, Seabold GK, Mathur P, Davis MI, Bock R, Gustin RM, Colbran RJ, Alvarez VA, Nakazawa K, Delpire E, Lovinger DM, Holmes A (2010) Loss of GluN2B-containing NMDA receptors in CA1 hippocampus and cortex impairs long-term depression, reduces dendritic spine density, and disrupts learning. J Neurosci 30:4590–4600. 10.1523/JNEUROSCI.0640-10.2010 - DOI - PMC - PubMed

Publication types

MeSH terms

Substances

LinkOut - more resources