. 2018 May 14;92(11):e00364-18.
doi: 10.1128/JVI.00364-18. Print 2018 Jun 1.

Exacerbated Apoptosis of Cells Infected with Infectious Bursal Disease Virus upon Exposure to Interferon Alpha

Affiliations

Exacerbated Apoptosis of Cells Infected with Infectious Bursal Disease Virus upon Exposure to Interferon Alpha

Liliana L Cubas-Gaona et al. J Virol. .

Abstract

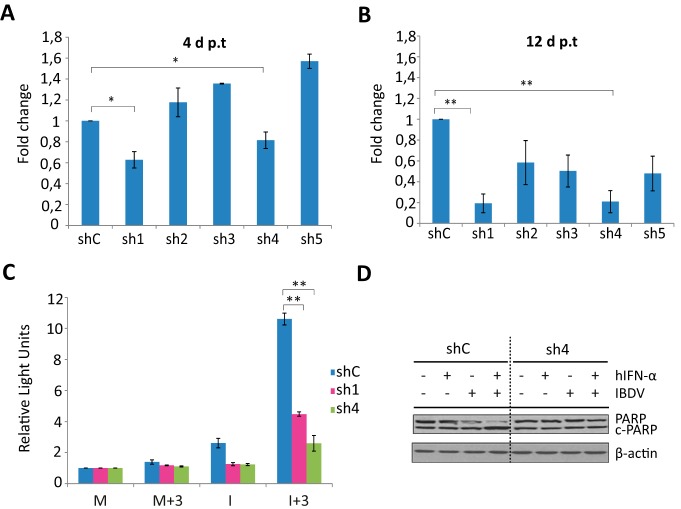
Infectious bursal disease virus (IBDV) belongs to the Birnaviridae family and is the etiological agent of a highly contagious and immunosuppressive disease (IBD) that affects domestic chickens (Gallus gallus). IBD or Gumboro disease leads to high rates of morbidity and mortality of infected animals and is responsible for major economic losses to the poultry industry worldwide. IBD is characterized by a massive loss of IgM-bearing B lymphocytes and the destruction of the bursa of Fabricius. The molecular bases of IBDV pathogenicity are still poorly understood; nonetheless, an exacerbated cytokine immune response and B cell depletion due to apoptosis are considered main factors that contribute to the severity of the disease. Here we have studied the role of type I interferon (IFN) in IBDV infection. While IFN pretreatment confers protection against subsequent IBDV infection, the addition of IFN to infected cell cultures early after infection drives massive apoptotic cell death. Downregulation of double-stranded RNA (dsRNA)-dependent protein kinase (PKR), tumor necrosis factor alpha (TNF-α), or nuclear factor κB (NF-κB) expression drastically reduces the extent of apoptosis, indicating that they are critical proteins in the apoptotic response induced by IBDV upon treatment with IFN-α. Our results indicate that IBDV genomic dsRNA is a major viral factor that contributes to the triggering of apoptosis. These findings provide novel insights into the potential mechanisms of IBDV-induced immunosuppression and pathogenesis in chickens.IMPORTANCE IBDV infection represents an important threat to the poultry industry worldwide. IBDV-infected chickens develop severe immunosuppression, which renders them highly susceptible to secondary infections and unresponsive to vaccination against other pathogens. The early dysregulation of the innate immune response led by IBDV infection and the exacerbated apoptosis of B cells have been proposed as the main factors that contribute to virus-induced immunopathogenesis. Our work contributes for the first time to elucidating a potential mechanism driving the apoptotic death of IBDV-infected cells upon exposure to type I IFN. We provide solid evidence about the critical importance of PKR, TNF-α, and NF-κB in this phenomenon. The described mechanism could facilitate the early clearance of infected cells, thereby aiding in the amelioration of IBDV-induced pathogenesis, but it could also contribute to B cell depletion and immunosuppression. The balance between these two opposing effects might be dramatically affected by the genetic backgrounds of both the host and the infecting virus strain.

Keywords: apoptosis; infectious bursal disease virus; interferon; pathogenesis.


Figures

FIG 1
FIG 1
IBDV is sensitive to the antiviral action of IFN in HeLa cells. HeLa cells were pretreated with different doses of hIFN-α (0, 1, 10, 100, and 1,000 IU/ml), as indicated, for 16 h before infection with two MOIs of IBDV, 0.05 or 2 PFU/cell, and both the culture medium and infected cells were harvested at 24 h p.i. (A) Western blot analysis of total cell extracts with anti-VP3 antibody. Detection of β-actin in the same cell extracts was used for a protein loading control. (B) Extracellular virus yields. Supernatants from infected cells were used for virus titration by a plaque assay. Striped bars, IFN-untreated cells; solid bars, infected cell samples pretreated with IFN. Bars indicate means ± standard deviations based on duplicate samples from two independent experiments. * indicates a P value of <0.05, as determined by unpaired Student's t test.
FIG 2
FIG 2
IFN treatment triggers apoptosis of IBDV-infected HeLa cells. HeLa cells mock infected or infected with IBDV (MOI of 2) were treated with hIFN-α (1,000 IU/ml) at 3, 6, 9, or 12 h p.i. (samples named throughout the text M+3, M+6, M+9, and M+12 and I+3, I+6, I+9, and I+12, respectively), as indicated, or remained untreated (−) (named throughout the text M and I, respectively). Cells were analyzed at 24 h p.i. by using different assays. (A) Phase-contrast microscopy. (B) Fluorescence microscopy after incubation with the Live/Dead cell imaging reagent to discriminate live (green) from dead (red) cells. (C) Western blot analysis of cells mock infected or infected with IBDV and treated with hIFN-α at the indicated times p.i. with different antibodies: anti-PARP, anti-total PKR (t-PKR), anti-phosphorylated (Thr446) PKR (p-PKR), anti-total eIF2α (t-eIF2α), anti-phosphorylated (Ser52) eIF2α (p-eIF2α), anti-Mx, anti-ISG-56, and anti-VP3. The PARP cleavage product is denoted c-PARP. Antibodies to β-actin were used for a protein loading control. (D) Apoptosis was measured from duplicate samples by using the Caspase-Glo 3/7 assay kit, and each determination was carried out in duplicate. Caspase values from infected cell samples were normalized to those from mock-infected cells. Bars indicate means ± standard deviations based on duplicate samples from two independent experiments. Striped bars, infected cell samples not treated with IFN; solid bars, infected cell samples treated with IFN. (E) Analysis of the IFN dose-response effect on caspase 3/7 activity. Mock-infected or infected cells were treated with increasing doses (10-fold) of hIFN-α (from 1 to 105 IU/ml), and apoptosis was measured at 24 h p.i. by using the Caspase-Glo 3/7 assay kit. (F) Comparative analysis of apoptosis levels in IBDV-infected HeLa cells treated with IFN (1,000 IU/ml) at 3 h p.i. and uninfected cells treated with different doses of staurosporine (STS) (0.5, 1, and 2 μM), collected at 24 h p.i. or posttreatment, respectively. * and ** indicate P values of <0.05 and <0.01, respectively as determined by unpaired Student's t test.
FIG 3
FIG 3
Triggering of apoptosis by IFN in IBDV-infected HeLa cells is dependent on PKR expression. HeLa cells mock infected or infected with IBDV (MOI of 2) were treated with 1,000 IU/ml of hIFN-α at 3, 6, 9, or 12 h p.i. (samples named M+3, M+6, M+9, and M+12 and I+3, I+6, I+9, and I+12, respectively, throughout the text), as indicated, or remained untreated (−) (named M and I, respectively, throughout the text), and cells were analyzed at 24 h p.i. (A) Western blot analysis of total cell extracts with different antibodies: anti-PARP, anti-t-PKR, anti-phosphorylated (Thr446) PKR, anti-t-eIF2α, anti-phosphorylated (Ser52) eIF2α, anti-Mx, and anti-VP3. Antibodies to β-actin were used for a protein loading control. The PARP cleavage product is denoted c-PARP. (B) Apoptosis was measured for duplicate samples by using the Caspase-Glo 3/7 assay kit, and each determination was carried out in duplicate. Caspase values from infected cell samples were normalized to those from mock-infected cells. Bars indicate means ± standard deviations based on duplicate samples from two independent experiments. Striped bars, infected cell samples not treated with IFN; solid bars, infected cell samples treated with IFN. * and ** indicate P values of <0.05 and <0.01, respectively, as determined by unpaired Student's t test.
FIG 4
FIG 4
Upregulation of IFN-β and TNF-α gene expression in IBDV-infected HeLa cells upon IFN treatment is dependent on PKR expression. HeLa control and HeLa PKR-silenced cells were infected with IBDV (MOI of 2) and treated or not with 1,000 IU/ml of hIFN-α at 3 h p.i. Mock-infected (M and M+3) and IBDV-infected (I and I+3) cells were harvested at 24 h p.i. and subjected to RNA extraction. The expression levels of the selected genes, as indicated, were determined by SYBR green-based RT-qPCR. The expression level of each cellular target gene was normalized to the HPRT mRNA content and is presented on a log10 scale as the fold change over the level in mock-infected HeLa silencing control or HeLa PKR-silenced cells. Bars indicate means ± standard deviations based on data for triplicate samples. Dotted bars, mock-infected cell samples treated with IFN; striped bars, infected cell samples not treated with IFN; solid bars, infected cell samples treated with IFN. *, **, and *** indicate P values of <0.05, <0.01, and <0.001, respectively, as determined by unpaired Student's t test. ns, not significant.
FIG 5
FIG 5
Effect of TNF-α knockdown on triggering of apoptosis by IFN in IBDV-infected HeLa cells. (A and B) TNF-α silencing by shRNAs. HeLa cells were transduced with lentiviral vectors expressing an irrelevant sequence (shC) or shRNAs targeting TNF-α mRNA (sh1 to sh5). At 4 days p.t. (A) and 12 days p.t. (B), cells were transfected with poly(I·C) for 16 h to induce TNF-α gene expression, and the levels of TNF-α mRNA were determined by SYBR green-based RT-qPCR. The results of TNF-α gene expression levels, normalized against the HPRT mRNA level, are presented as fold changes relative to the level in HeLa shC cells transfected with poly(I·C). Bars indicate means ± standard deviations based on data from triplicate samples. * indicates a P value of <0.05, as determined by unpaired Student's t test. (C and D) Effect of TNF-α silencing on apoptosis. HeLa cells transduced with lentiviral vectors expressing shC, sh1, and sh4 were mock infected or infected with IBDV at an MOI of 2 at 12 days p.t. and treated (+) or not (−) with 1,000 IU/ml of hIFN-α at 3 h p.i. Cells were harvested at 24 h p.i. (C) Apoptosis was measured by using the Caspase-Glo 3/7 assay kit. Each determination was carried out in duplicate. The presented data correspond to the means ± the standard deviations of results from two independent experiments. Caspase values for infected cell samples were normalized to those for mock-infected cells. Bars indicate means ± standard deviations based on data from duplicate samples. * and ** indicate P values of <0.05 and <0.01, respectively, as determined by unpaired Student's t test. (D) PARP cleavage analyzed by Western blotting. Total cell extracts were subjected to SDS-PAGE, transferred to nitrocellulose, and immunoblotted with serum anti-PARP. The PARP cleavage product is denoted c-PARP. The Western blot corresponding to β-actin was used as a protein loading control.
FIG 6
FIG 6
Triggering of apoptosis during IBDV infection in cells treated with IFN correlates with PKR phosphorylation and upregulation of IFN-β gene expression. HeLa cells mock infected (M) or infected with IBDV (MOI of 2) (I) were treated or not with hIFN-α (1,000 IU/ml of at 3 h p.i.) (M+3 and I+3, respectively) and harvested at the indicated times p.i. (A) Western blot analysis of total cell extracts with anti-PARP, anti-t-PKR, anti-p-PKR, and anti-VP3 antibodies. The Western blot corresponding to β-actin was used as a protein loading control. The PARP cleavage product is denoted c-PARP. (B) Real-time quantitative cell death analysis. Mock-infected and IBDV-infected HeLa cells treated as indicated above were incubated with the IncuCyte caspase-3/7 apoptosis assay reagent as described in Materials and Methods, and cell cultures were monitored with an IncuCyte Zoom system apparatus during 24 after infection. Apoptotic cell death in duplicate cultures under each experimental condition, visualized by the appearance of green cells, was analyzed with IncuCyte Zoom software. (C to E) RT-qPCR analysis of IFN-β (C) and viral (D and E) RNAs during infection in cells treated with hIFN-α. In panel E, cells were treated or not with 7DMA (0.2 mM) after virus adsorption and then treated (I+3) (solid bars) or not (I) (striped bars) with hIFN-α at 3 h p.i. The expression levels of the selected genes, as indicated, were determined by SYBR green-based RT-qPCR. The expression level of the IFN-β target gene was normalized to the HPRT mRNA content and is presented on a log10 scale as a fold change over the level in mock-infected HeLa cells. (F) Apoptosis in samples from M, M+3, I, and I+3 cells treated or not treated with 7DMA (0.2 mM) after virus adsorption was measured at 24 h p.i. by using the Caspase-Glo 3/7 assay kit. Each determination was carried out in duplicate. The presented data correspond to the means ± the standard deviations of results from two independent experiments. The caspase values for infected cell samples were normalized to those for mock-infected cells. Bars indicate means ± standard deviations based on data from duplicate samples. * and ** indicate P values of <0.05 and <0.01, respectively, as determined by unpaired Student's t test.
FIG 7
FIG 7
NF-κB activation upon treatment with IFN in IBDV-infected HeLa cells. HeLa cells mock infected (M) or infected (I) with IBDV (MOI of 2) were treated or not with hIFN-α (1,000 IU/ml of at 3 h p.i.) (M+3 and I+3, respectively), and the nuclear translocation of the p65 subunit of NF-κB was analyzed. Shown is Western blot analysis of p65 in the nuclear and cytosolic fractions from cells harvested at the indicated times p.i. Each fraction was subjected to SDS-PAGE, transferred to nitrocellulose, and immunoblotted with serum anti-p65. The Western blots corresponding to histone H2B and α-tubulin were used as protein loading controls for nuclear and cytosolic fractions, respectively.
FIG 8
FIG 8
Inhibition of p65 nuclear translocation by treatment with the proteasome inhibitor MG132 or with NF-κB-specific inhibitors significantly affects triggering of apoptosis by IFN in IBDV-infected cells. HeLa cells mock infected or infected (I) with IBDV (MOI of 2) were treated immediately after virus adsorption with the proteasome inhibitor MG132 (2 μM) or DMSO (used as control) and incubated with hIFN-α (1,000 IU/ml) at 3 h p.i. (M+3 and I+3, respectively). Cell samples were harvested at the indicated times p.i. (A) Western blot analysis of p65 in the nuclear and cytosolic fractions. Samples were subjected to subcellular fractionation, and each fraction was subjected to SDS-PAGE, transferred to nitrocellulose, and immunoblotted with serum anti-p65. Western blots corresponding to histone H2B and α-tubulin were used as protein loading controls for nuclear and cytosolic fractions, respectively. M, untreated mock-infected cell fraction. (B) Apoptotic cell death in cell samples collected at the indicated times p.i. was measured by using the Caspase-Glo 3/7 assay kit. Each determination was carried out in duplicate. The presented data correspond to the means ± standard deviations of results from two independent experiments. Caspase values for infected cell samples were normalized to those for mock-infected cells. Bars indicate means ± standard deviations based on data from duplicate samples. (C) Analysis of p65 translocation upon TNF-α treatment in cells treated with NF-κB-specific inhibitors by Western blotting. HeLa cells were treated with the IKKβ-specific inhibitor SC-514, the p65 translocation inhibitor JSH-23 (50 and 25 μM, respectively), or DMSO as a control (−) during 2 h, followed by treatment with TNF-α (20 ng/ml) during 30 min. Nuclear and cytosolic fractions were analyzed with antibodies against p65 and IκBα. Histone H2B and α-tubulin were used as protein loading controls for nuclear and cytosolic fractions, respectively. (D) Analysis of p65 translocation in IFN-treated IBDV-infected cells upon treatment with NF-κB-specific inhibitors by Western blotting. IBDV-infected HeLa cells treated with IFN at 3 h p.i. (I+3) were treated with SC-514, JSH-23 (50 and 25 μM, respectively), or DMSO as a control (−) at 14 h p.i. Cell samples were collected at the indicated times p.i. Nuclear and cytosolic fractions were analyzed by using antibodies against p65, IκBα, and VP3. Histone H2B and α-tubulin were used as protein loading controls. (E) Apoptotic cell death in M, M+3, I, and I+3 cell samples treated with SC-514, JSH-23 (50 and 25 μM, respectively), or DMSO as a control, at 14 h p.i., was measured at 24 h p.i. as described above for panel B. * and ** indicate P values of <0.05 and <0.01, respectively, as determined by unpaired Student's t test.
FIG 9
FIG 9
Triggering of apoptosis in cells transfected with IBDV genomic RNA, but not in cells incubated with IBDV-VLPs, upon IFN treatment. HeLa cells either mock infected (M), infected (I) with IBDV (MOI of 2), incubated with IBDV-derived VLPs (V), or transfected with genomic dsRNA (R) were treated or not with hIFN-α (1,000 IU/ml) at 3 h p.i. (M+3, I+3, V+3, and R+3, respectively). Cells were harvested at 24 h p.i., and apoptotic cell death was measured by using the Caspase-Glo 3/7 assay kit. Each determination was carried out in duplicate. The presented data correspond to the means ± the standard deviations of results from two independent experiments. Caspase values for infected cell samples were normalized to those for the corresponding mock-infected cells. Bars indicate means ± standard deviations based on data from duplicate samples. * and ** indicate P values of <0.05 and <0.01, respectively, as determined by unpaired Student's t test. ns, not significant.
FIG 10
FIG 10
IFN treatment triggers apoptosis of HeLa cells infected with different strains of IBDV. HeLa cells mock infected or infected with different strains of IBDV (MOI of 2), Soroa, P2, or Bursine, were treated with 1,000 IU/ml of hIFN-α at 3 h p.i. (M+3 and I+3, respectively), as indicated, or remained untreated (M and I, respectively). Cells were analyzed at 24 h p.i. (A) Western blot analysis of cells mock infected or infected with different strains of IBDV and treated with hIFN-α with antibodies against PARP and VP3. The PARP cleavage product is denoted c-PARP. Antibodies to β-actin were used for a protein loading control. (B) Apoptosis was measured from duplicate samples by using the Caspase-Glo 3/7 assay kit, and each determination was carried out in duplicate. Caspase values for infected cell samples were normalized to those for mock-infected cells. Bars indicate means ± standard deviations based on data for duplicate samples from two independent experiments. Yellow bars indicate mock-infected cell samples not treated (M) and treated (M+3) with IFN. * indicates a P value of <0.05, as determined by unpaired Student’s t test.
FIG 11
FIG 11
IFN treatment triggers apoptosis of IBDV-infected chicken DF-1 cells. DF-1 cells were infected with IBDV (MOI of 2) and treated or not with 1,000 U/ml of chIFN-α at 3 h p.i. Mock-infected (M and M+3) and IBDV-infected (I and I+3) cells were analyzed at 16 h p.i. (A) Cells were incubated with the IncuCyte caspase 3/7 apoptosis assay reagent, and images were recorded with an IncuCyte Zoom system apparatus at 16 h p.i. Apoptotic cells are green. (B) Apoptosis measurement. As a control for apoptosis, uninfected DF-1 cells were treated with different doses of staurosporine (0.5, 1, and 2 μM) for 16 h. Apoptosis in duplicate samples was measured by using the Caspase-Glo 3/7 assay kit, and each determination was carried out in duplicate. Caspase values for infected cell samples were normalized to those for mock-infected cells. Bars indicate means ± standard deviations based on data from duplicate samples from two independent experiments. ** indicates a P value of <0.01, as determined by unpaired Student's t test.

Similar articles

Cited by

References

    1. Mahgoub HA, Bailey M, Kaiser P. 2012. An overview of infectious bursal disease. Arch Virol 157:2047–2057. doi:10.1007/s00705-012-1377-9. - DOI - PubMed
    1. Ingrao F, Rauw F, Lambrecht B, van den Berg T. 2013. Infectious bursal disease: a complex host-pathogen interaction. Dev Comp Immunol 41:429–438. doi:10.1016/j.dci.2013.03.017. - DOI - PubMed
    1. van den Berg TP, Eterradossi N, Toquin D, Meulemans G. 2000. Infectious bursal disease (Gumboro disease). Rev Sci Tech 19:509–543. doi:10.20506/rst.19.2.1227. - DOI - PubMed
    1. Rodenberg J, Sharma JM, Belzer SW, Nordgren RM, Naqi S. 1994. Flow cytometric analysis of B cell and T cell subpopulations in specific-pathogen-free chickens infected with infectious bursal disease virus. Avian Dis 38:16–21. doi:10.2307/1591831. - DOI - PubMed
    1. Burkhardt E, Muller H. 1987. Susceptibility of chicken blood lymphoblasts and monocytes to infectious bursal disease virus (IBDV). Arch Virol 94:297–303. doi:10.1007/BF01310722. - DOI - PubMed

Publication types

MeSH terms

LinkOut - more resources