. 2018 Mar 14;10(432):eaag0945.
doi: 10.1126/scitranslmed.aag0945.

Obesity promotes resistance to anti-VEGF therapy in breast cancer by up-regulating IL-6 and potentially FGF-2

Affiliations

Obesity promotes resistance to anti-VEGF therapy in breast cancer by up-regulating IL-6 and potentially FGF-2

Joao Incio et al. Sci Transl Med. .

Abstract

Anti-vascular endothelial growth factor (VEGF) therapy has failed to improve survival in patients with breast cancer (BC). Potential mechanisms of resistance to anti-VEGF therapy include the up-regulation of alternative angiogenic and proinflammatory factors. Obesity is associated with hypoxic adipose tissues, including those in the breast, resulting in increased production of some of the aforementioned factors. Hence, we hypothesized that obesity could contribute to anti-VEGF therapy's lack of efficacy. We found that BC patients with obesity harbored increased systemic concentrations of interleukin-6 (IL-6) and/or fibroblast growth factor 2 (FGF-2), and their tumor vasculature was less sensitive to anti-VEGF treatment. Mouse models revealed that obesity impairs the effects of anti-VEGF on angiogenesis, tumor growth, and metastasis. In one murine BC model, obesity was associated with increased IL-6 production from adipocytes and myeloid cells within tumors. IL-6 blockade abrogated the obesity-induced resistance to anti-VEGF therapy in primary and metastatic sites by directly affecting tumor cell proliferation, normalizing tumor vasculature, alleviating hypoxia, and reducing immunosuppression. Similarly, in a second mouse model, where obesity was associated with increased FGF-2, normalization of FGF-2 expression by metformin or specific FGF receptor inhibition decreased vessel density and restored tumor sensitivity to anti-VEGF therapy in obese mice. Collectively, our data indicate that obesity fuels BC resistance to anti-VEGF therapy via the production of inflammatory and angiogenic factors.


Conflict of interest statement

Competing interests: R.K.J. received consultant fees from Merck, Ophthotech, Pfizer, SPARC, SynDevRx, and XTuit. R.K.J. owns equity in Enlight, Ophthotech, SynDevRx, and XTuit and serves on the Board of Directors of XTuit and the Boards of Trustees of Tekla Healthcare Investors, Tekla Life Sciences Investors, Tekla Healthcare Opportunities Fund, and Tekla World Healthcare Fund. No reagents or funding from these companies was used in these studies.

Figures

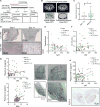
Fig. 1
Fig. 1. Reduced anti-vascular effect of anti-VEGF therapy in patients with excess weight is associated with increased IL-6 and FGF-2
(A) Schematic of the clinical study performed using samples and data from a phase 2 neoadjuvant trial in BC. (B) Representative CT scans demonstrating how VAT and SAT data were collected in BC patients. (C) Baseline tumor size in patients with BMI below or above 25 (n = 29 and 70, respectively). (D) Representative images of vessel staining (CD31) in human breast tumor samples from patients with low or high VAT, before (day 0) and after (day 14) bevacizumab (anti-VEGF) treatment. (E) Correlation of tumor vessel count with SAT before (day 0) and after (day 14) anti-VEGF therapy. n.s., not significant. (F) Correlation of tumor CA-IX expression with VAT before and after anti-VEGF therapy. (G) Left: Correlation of plasma IL-6 with VAT and BMI at baseline and day 14. Right: Representative images of IL-6 staining in human breast tumor samples. (H) Top: Correlation of plasma FGF-2 with VAT at baseline and day 14. Bottom: Representative image of FGF-2 staining in a human breast tumor sample. Significant differences were assessed in (C) using t test and in (E) to (H) using Spearman’s correlation test. *P < 0.05, **P < 0.01, ***P < 0.001. Data in (C) and (E) to (H) are shown as individual values, regression line, and box plots with minimum, maximum, and median values.
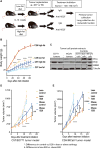
Fig. 2
Fig. 2. Obesity associates with resistance to anti-VEGF therapy in mouse models of BC
(A) Schematic demonstrating the experimental design of preclinical studies. C57BL/6 and C3H mice were fed a high-fat diet (HFD; 60% fat) or a low-fat diet (LFD; 10% fat) from 6 weeks of age. Tumor cells/chunks were implanted 8 to 10 weeks after diet initiation, and treatments began when tumors reached ~100 to 150 mm3. (B) BW gain over time in C3H and C57BL/6 mice fed either an LFD or HFD (C57BL/6: LFD, n = 6; HFD, n = 7; C3H: LFD, n = 4; HFD, n = 4). Significant differences using two-way analysis of variance (ANOVA) with post hoc test for multiple comparisons are indicated. *P < 0.05, **P < 0.01, ****P < 0.0001. (C) Tumor/cell protein extracts were used to access the expression of ER and epidermal growth factor receptor 2 (ERBB2) in tumors/cell lines. MCF7 and BT474 cell lines were used as positive controls for ER and (in the case of BT474) ERBB2 (antibody used detects both human and mouse HER2/ERBB2). Tubulin was used as loading control. (D and E) Tumor growth curves. E0771 (D) and MCaIV (E) tumors grown in obese versus lean mice were treated with anti-VEGF antibody (B20) or control immunoglobulin G (IgG) [E0771: n = 3 animals in obese control group and 6 animals for other groups; MCaIV: n = 8 animals in obese control group and 6 animals for other groups; two additional animals in the obese control group were removed after treatment (IgG) initiation because of failure of tumor growth]. Significant differences using two-way ANOVA with post hoc test for multiple comparisons are indicated. **P < 0.01, ****P < 0.0001 control versus B20 in lean or obese settings; #P < 0.05, ##P < 0.01, ####P < 0.0001, lean B20 versus obese B20. Data in (B), (D), and (E) are means ± SEM.
Fig. 3
Fig. 3. Anti-VEGF therapy is less effective in reducing tumor vessel density in obese mice
(A) Left: Representative images of CD31 staining (immunohistochemistry) in E0771 tumors from lean and obese mice, treated with control IgG or B20 for 14 days (tumor size-matched at treatment initiation). Right: Quantification of CD31+ expression (percentage of viable tumor area). (B) Quantification of hypoxia [percentage of CA-IX expression over 4′,6-diamidino-2-phenylindole (DAPI) viable area] in whole E0771 tumors from lean and obese animals treated with B20 or control IgG. (C) Protein expression determined by Western blot in tumors from lean and obese animals treated with control IgG or B20. Each lane corresponds to an individual tumor. GAPDH, glyceraldehyde-3-phosphate dehydrogenase. Significant differences in (A) and (B) using two-way ANOVA with post hoc test for multiple comparisons are indicated, *P < 0.05, ***P < 0.001, ****P < 0.0001. Data in (A) and (B) are shown as individual values plus box plots with minimum, maximum, and median values.
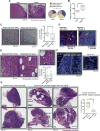
Fig. 4
Fig. 4. The hypoxic adipocyte-rich tumor microenvironment in obese mice associates with sustained E0771 tumor progression despite anti-VEGF therapy
(A) Left: Representative images of hematoxylin and eosin (H&E)–stained E0771 tumors from lean and obese mice. Right: Density of adipocytes in E0771 tumors. Quantification denotes enrichment for adipocytes [adipocyte-rich: 12 or more adipocytes per region of interest (ROI); intermediate: 5 to 11 adipocytes per ROI; adipocyte-poor: less than 5 adipocytes per ROI (2.16 by 1.44 mm at ×4 magnification), n = 4 to 10 ROIs per tumor from a total of four tumors per group]. (B) Quantification of adipocyte diameter in E0771 tumors. Cross-sectional diameter was obtained from H&E-stained tumor sections (n = 12 to 20 ROIs per tumor from a total of four tumors per group). (C) Left: Representative images of tumor vessel density (CD31 staining) in adipocyte-poor and adipocyte-rich areas in the E0771 model. Right: Quantification of vessel density in regions with low and high numbers of adipocytes (n = 3 to 4 ROIs from a total of eight tumors). Significant difference using t test, *P < 0.05. (D) Representative images of CA-IX staining in adipocyte-poor and adipocyte-rich areas of E0771 tumors. Arrows in images point to adipocytes. (E) Left: Representative images of adipocyte-poor and adipocyte-rich areas after H&E staining of E0771 tumors. Inset highlights an abundance of mitotic cells (arrows) near an adipocyte. Bottom right: Number of mitosis in adipocyte-poor and adipocyte-rich regions (n = 15 to 22 ROIs from a total of eight tumors). (F) Left: Immunofluorescence images of an E0771 tumor from an obese mouse showing the expression of Ki-67 in tumor adipocyte-rich areas. Right: Higher-magnification inset from a region expressing Ki-67. (G) Left: Representative images of H&E-stained whole E0771 tumors before and after anti-VEGF therapy. Right: Quantification of necrosis in adipose-poor and adipocyte-rich regions of tumors from animals treated with anti-VEGF. Significant differences using χ2 for (A) and t test for (B), (C), (E), and (G) are indicated. *P < 0.05, **P < 0.01. Data in (B), (C), (E), and (G) are shown as individual values plus box plots with minimum, maximum, and median values.
Fig. 5
Fig. 5. Hypoxic tumors from obese mice associate with increased production of IL-6 by adipocytes and myeloid cells
(A) mRNA expression (normalized to a panel of housekeeping genes) of proinflammatory cytokines and proangiogenic growth factors in E0771 tumors from lean and obese animals treated with B20. Four samples per group were pooled in each array plate used. Genes that increased more than about twofold are included (in addition to VEGF family genes). (B) Protein expression of IL-6 in E0771 tumors from lean and obese animals treated with B20. Significant differences using t test are indicated, *P < 0.05. Data are shown as individual values plus box plots with minimum, maximum, and median values. (C) Immunohistochemistry indicating IL-6 expression in adipocyte-rich areas (arrows point to adipocytes). (D) Immunofluorescence showing IL-6 expression and hypoxic (GLUT-1+) adipocyte-rich areas (arrow points to adipocytes). (E) Colocalization of IL-6 with the myeloid marker CD11b (arrow points to adipocytes). (F) Colocalization of macrophages (F4/80+ cells) with IL-6 in tumors (arrows point to adipocytes). (G) Colocalization of macrophages (F4/80+ cells) with adipocytes in hypoxic (CA-IX–positive) areas. Scale bar, 400 μm. (H) E0771 BC cells express IL-6R and the IL-6 signal-transducing subunit gp130. (I) Immunofluorescence showing tumor expression of p-STAT3 and macrophages infiltrating adipocyte-rich areas (arrow points to an adipocyte). Scale bar, 100 μm.
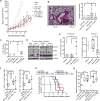
Fig. 6
Fig. 6. IL-6 inhibition improves tumor response to anti-VEGF in the obese setting
(A) Tumor growth curves. E0771 tumors grown in lean versus obese C57BL/6 mice were treated with control IgG (lean, n = 9; obese, n = 6), B20 (lean, n = 6; obese, n = 7), or a combination of B20 and IL-6 inhibitor (lean, n = 8; obese, n = 7). ***P < 0.001, ****P < 0.0001 lean B20 versus obese B20; #P < 0.05, ##P < 0.01 obese B20 versus obese B20 + IL-6 inhibition. (B) Left: Representative image of lung collected from E0771 tumor-bearing obese mice (arrow points to lung metastasis in the inset). Right: Number of lung metastases collected from E0771 tumor-bearing lean and obese C57BL/6 mice treated with control IgG, B20, anti–IL-6 antibody, or a combination of B20 and anti–IL-6. (C) Tumor cell proliferation (Ki-67) in tumors collected from lean and obese mice treated with B20 or B20 + anti–IL-6 antibody. (D) Protein expression from tumors in lean and obese mice, treated with B20 or B20 plus IL-6 inhibitor. Western blots, where each lane represents an individual tumor. (E) Left: Vessel perfusion (percentage of CD31+ stain colocalizing with lectin) in EO771 tumors. Right: Expression of the hypoxia marker CA-IX in EO771 tumors. (F) Flow cytometric analysis of immune cells in tumors in obese mice, showing the percentage of total immune cells of regulatory T (Treg) cells (CD4+CD25+; left) and CD4+ T cells (right). (G) Kaplan-Meier survival curves (percentages of animals that bear tumors of less than 1 cm3 in size); the difference between obese B20 plus doxorubicin (Doxo, 2 mg/kg) and obese B20 plus doxorubicin plus IL-6 inhibitor (IL-6inh) groups is significant by log-rank test, as indicated. *P < 0.05. (H) Median time to progression (time for tumors to reach 1 cm3) is depicted in the right. Significant differences using one-way ANOVA for (E) and (F) and two-way ANOVA for (A) to (C), (E), and (H) with post hoc multiple comparisons tests are indicated. *P < 0.05, **P < 0.01, ***P < 0.001, ****P < 0.0001. Data in (A) are shown as means ± SEM and in (B), (C), (E), (F), and (H) are shown as individual values plus box plots with minimum, maximum, and median values.
Fig. 7
Fig. 7. FGF-2 inhibition improves tumor response to anti-VEGF in obese setting in a second BC model
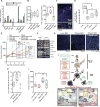
(A) mRNA expression (normalized to a panel of housekeeping genes) of proinflammatory cytokines and proangiogenic growth factors in tumors from lean and obese animals treated with B20, as well as obese mice treated with B20 + metformin (Met). Four samples per group were pooled in each array plate used. (B) Protein expression of IL-6 and FGF-2 in MCaIV tumors from lean and obese mice treated with B20 or B20 plus metformin. (C) Immunofluorescent staining of MCaIV tumor sections. FGF-2 is expressed by adipocytes (top, arrows) and fibroblasts [smooth muscle actin (SMA)] (top). (D) Quantification of vessel density in MCaIV tumors from lean or obese mice untreated or treated with B20. (E) Tumor growth curves. MCaIV tumor-bearing lean and obese mice were treated with anti-VEGF (B20) and/or anti-FGFR once fully established (at median tumor volume ~350 mm3; lean animals: control, n = 5; anti-FGFR, n = 4; B20, n = 5; B20 + anti-FGFR, n = 5; obese animals: control, n = 4; anti-FGFR, n = 4; B20, n = 8; B20 + anti-FGFR, n = 9). Significant differences using two-way ANOVA with post hoc multiple comparisons tests between B20 and B20 + anti-FGFR groups in both lean and obese conditions are indicated in the graph, ****P < 0.0001 in obese and NS (not significant) in lean (day 6). At day 9, a direct comparison between anti-FGFR and B20 + anti-FGFR groups was made for both lean and obese mice. Significant differences using t test, ##P < 0.01 in obese and NS in lean. (F) Western blot demonstrating the effect of metformin on downstream signaling of the FGF pathway and AMPK/ACC. (G and H) Effect of metformin on vessel density in obese animals treated with B20. Representative images (G) showing CD31+ expression in whole tumors. Scale bars, 300 μm. (H) Quantification of CD31+ density in total DAPI viable area. (I) Effect of metformin on tumor volume in lean and obese animals treated with B20. Data shown as tumor volume 16 days after treatment initiation. (J) The obese microenvironment promotes tumor resistance to antiangiogenic therapy. In breast tumors treated with anti-VEGF, obesity-induced IL-6 and FGF-2 production may mediate resistance to anti-VEGF via potentially distinct mechanisms. IL-6 sustains tumor cell proliferation, promotes immune cell recruitment, and drives dysfunctional angiogenesis that further aggravates hypoxia and promotes tumor progression despite anti-VEGF therapy. The proangiogenic factor FGF-2 sustains angiogenesis despite VEGF blockade. Significant differences using t test in (F); one-way ANOVA in (B) and (H) and two-way ANOVA in (D), (E), and (I) with post hoc multiple comparisons tests are indicated. *P < 0.05, **P < 0.01, ***P < 0.001, ****P < 0.0001. Data in (B), (D), (H), and (I) are shown as individual values plus box plots with minimum, maximum, and median values and in (E) are shown as means ± SEM.

Comment in

Similar articles

Cited by

References

    1. Jain RK. Normalizing tumor microenvironment to treat cancer: Bench to bedside to biomarkers. J Clin Oncol. 2013;31:2205–2218. - PMC - PubMed
    1. Jain RK. Antiangiogenesis strategies revisited: From starving tumors to alleviating hypoxia. Cancer Cell. 2014;26:605–622. - PMC - PubMed
    1. Lohmann AE, Chia S. Patients with metastatic breast cancer using bevacizumab as a treatment: Is there still a role for it? Curr Treat Options Oncol. 2012;13:249–262. - PubMed
    1. Guiu B, Petit JM, Bonnetain F, Ladoire S, Guiu S, Cercueil JP, Krausé D, Hillon P, Borg C, Chauffert B, Ghiringhelli F. Visceral fat area is an independent predictive biomarker of outcome after first-line bevacizumab-based treatment in metastatic colorectal cancer. Gut. 2010;59:341–347. - PubMed
    1. Ladoire S, Bonnetain F, Gauthier M, Zanetta S, Petit JM, Guiu S, Kermarrec I, Mourey E, Michel F, Krause D, Hillon P, Cormier L, Ghiringhelli F, Guiu B. Visceral fat area as a new independent predictive factor of survival in patients with metastatic renal cell carcinoma treated with antiangiogenic agents. Oncologist. 2011;16:71–81. - PMC - PubMed

Publication types

MeSH terms

LinkOut - more resources