. 2018 Mar 14;10(432):eaao6990.
doi: 10.1126/scitranslmed.aao6990.

Illusory movement perception improves motor control for prosthetic hands

Affiliations

Illusory movement perception improves motor control for prosthetic hands

Paul D Marasco et al. Sci Transl Med. .

Abstract

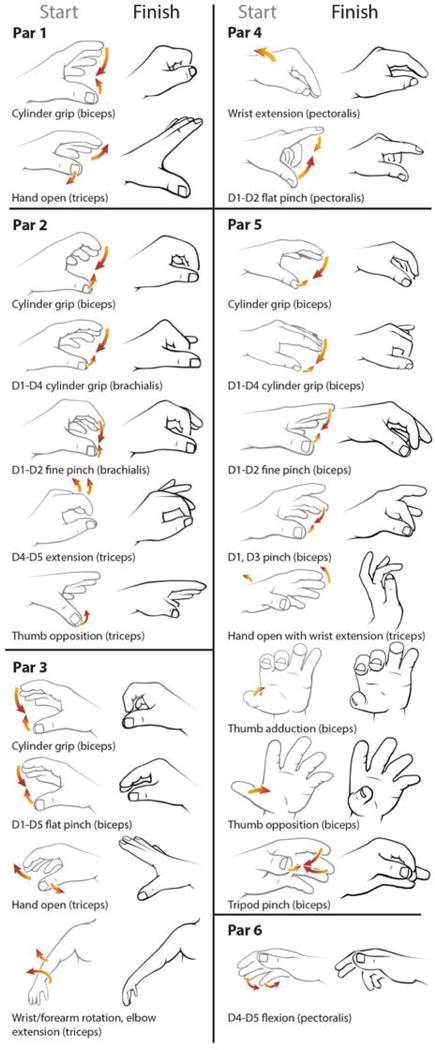
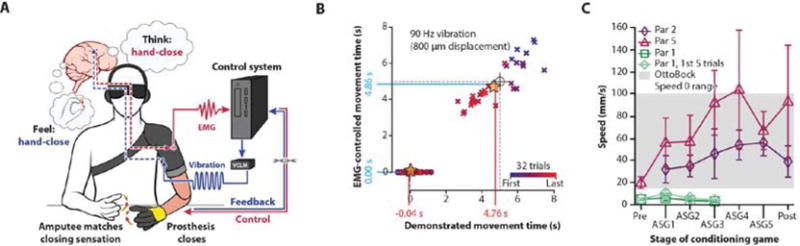
To effortlessly complete an intentional movement, the brain needs feedback from the body regarding the movement's progress. This largely nonconscious kinesthetic sense helps the brain to learn relationships between motor commands and outcomes to correct movement errors. Prosthetic systems for restoring function have predominantly focused on controlling motorized joint movement. Without the kinesthetic sense, however, these devices do not become intuitively controllable. We report a method for endowing human amputees with a kinesthetic perception of dexterous robotic hands. Vibrating the muscles used for prosthetic control via a neural-machine interface produced the illusory perception of complex grip movements. Within minutes, three amputees integrated this kinesthetic feedback and improved movement control. Combining intent, kinesthesia, and vision instilled participants with a sense of agency over the robotic movements. This feedback approach for closed-loop control opens a pathway to seamless integration of minds and machines.


Conflict of interest statement

Competing interests: The authors declare that they have no competing interests.

Figures

Fig. 1
Fig. 1. Movement percepts for all participants
Schematics representing perceived movements induced by 90 Hz vibration to the reinnervated residual muscles in 6 amputee participants (Par1-6) reported using the intact hand. Participant details are shown in Fig. S1. From a start position (grey outlines, Start), participants perceived movement in the direction and relative magnitude indicated by orange arrows to an end position (black outlines, Finish). Digits are specified by D1=thumb, D2=index finger, D3=middle finger, D4=ring finger, D5=little finger.
Fig. 2
Fig. 2. Active, passive and intrinsic movement percepts with measures of similarity across days and percept types
(A) Kinematic trajectories for the cylinder grip percepts for Par 1, Par 2, and Par 5 with the start (open) and end (closed) positions of the percepts demonstrated using the virtual hand at the top of each column. Graphs of digit average joint angles (n=30 trials [40 for Par 2 passive, first day]) are ranked in descending order according to average change in angle across all percepts and all participants. Individual plots show the joint with the greatest change in angle for that digit (PIP = proximal interphalangeal; MCP = metacarpophalangeal; IP = interphalangeal; Op. = opposition). Plots include active (teal), passive (grey) and intrinsic (magenta) percepts measured on the first experimental day (solid line), last experimental day (dashed line), and after the first speed game (dotted line, ASG1, see: Fig. S8B,C). (B) Aggregate measures of similarity in grip dynamics between each percept pair for each individual participant quantify percept stability across days and similarity between active, passive, and intrinsic conditions. The darker the shade, the greater the similarity between average percept joint trajectories (root-mean-square differences [RMSD] averaged across the joints in each digit with the greatest change in angle [n=5]). (C) Overall movement similarity by participant for all percepts across all days to quantify global percept stability. The farther the marker to the right, the greater the average correlation (Pearson correlation coefficients averaged across all of an individual’s percepts for the joints in each digit with the greatest change in angle [top, n=5 joints] and all joint movements [bottom, n=22 movements]).
Fig. 3
Fig. 3. Performance in functional tasks with and without vibration-induced kinesthetic illusory feedback
(A) Three participants’ (Par 1, Par 2, and Par 5) ability to accurately reach proportioned intervals in a grip-conformation task (25%, 50%, 75%, 100% hand closed) while receiving no (0 Hz, orange), 20 Hz (purple), and 90 Hz (teal) vibratory feedback. Actual intervals between targets (colored rectangles) are compared to the ideal intervals fit to each participant’s actual performance times (black open rectangles). The actual times to target position are shown as circles with error bars indicating 95% confidence intervals (n=20), which specify the height of the colored rectangles. The ideal change in time to target position between percent close positions (black open rectangles) is specified by the linear regression with intercept set at zero (black dotted line). Alignment between the black open rectangles and the colored rectangles is an indication of the participant’s ability to reach the proportional degrees of closure. (B) Line graph showing degree of alignment with ideal proportional performance in the grip-conformation task shown in panel A for amputee participants (Par 1, Par 2, and Par 5) and in an analogous task for an able-bodied cohort (AB Avg, n=5, Fig. S4B). The black dashed line indicates the average performance of able-bodied (AB Avg) participants ± 2 standard deviations (grey shaded area). (C) Bar graph showing average adaptation rate to self-generated error for Par 1 and Par 2 in different feedback conditions (vis.+kin. = vision and kinesthesia; kin. only = kinesthesia only; vis. only = vision only; sham only = 20 Hz vibration). Error bars represent 95% confidence intervals (n=75-95 trials). (D) Bar graph showing the standard deviation of the overall system noise (see methods for details) for Par 1, Par 2, and Par 5, for different feedback combinations (vis.+kin. = vision and kinesthesia; kin. only = kinesthesia only; vis. only = vision only; sham only = 20 Hz vibration). (E) Graph of cumulative EMG control signal trajectories for Par 5 using an agonist-antagonist muscle pair (biceps, hand close; triceps, hand open). Average cumulative control signal trajectories (n=4 trials, time the participant provided a close signal [negative] plus the open signal [positive]) for each feedback condition (90 Hz [teal line], 20 Hz [purple line], or no vibration [orange line]) compared to the target trajectory (black line).
Fig. 4
Fig. 4. Measures of agency and embodiment for combinations of intent, visual feedback, and illusory movement sensation
(A) Average agency and embodiment questionnaire (Fig. S7D) responses across Par 1, Par 2, and Par 5 under different conditions (Baseline = illusory percept matches the hand visualization, No vibration = hand visualization closes without illusory percept, Too fast = hand visualization closes faster than the illusory percept, Too slow = hand visualization closes slower than the illusory percept, Onset delay = hand visualization closes 1 s later than the illusory percept, Opposite movement = illusory percept closes while the hand visualization opens, Passive = experimenter controlled the hand closing visualization and illusory percept; Fig. S7A,C). Error bars represent standard deviation. † indicates a significant main effect (p < 0.001) for question type (agency/embodiment vs. control) from full factorial linear mixed models (fixed effects: condition, question type). * indicates significant Bonferronicorrected post-hoc t-tests (p < 0.05) between pairs of conditions within a question type. (B) Average agency responses (n=16) compared to average estimated intervals relative to the baseline condition (n=3 intervals, 20 trials each) both averaged by condition across Par 1, Par 2, and Par 5. The horizontal dotted line denotes no difference in estimated interval from the baseline condition and the vertical dashed line indicates the +1 cutoff for an experience of agency (see: Fig. 4A). Error bars represent estimates of average standard deviation calculated as the square root of the average variance within a condition averaged across participants.
Fig. 5
Fig. 5. Application of kinesthetic illusory feedback within a bidirectional neural-machine-interface
(A) Schematic representation of the movement feedback paired to a real-time functional prosthetic hand clinically fitted to the participant with illusory feedback locked to their volitional control, which was used to explore clinical feasibility. Feedback pathways are represented in blue (VCLM = Voice Coil Linear Motor). Prosthesis control pathways are represented in red (participant control). Participants matched the perceived sensation with their intact hand, and prosthetic hand closing speed was timed to the demonstrated perceptual illusion. (B) Graph showing the average start/stop times of the control signal (n = 32, EMG-activated prosthetic hand closing, blue) and the average start/stop times of the concurrently demonstrated percept movement (n = 32, matching hand, red) superimposed over the ideal start and thumb-index finger contact times of the physical prosthetic hand under continuous drive (black crosshairs, radius = 250 ms). The 5 s progression of movement from fully open to thumb-index finger contact for the physical prosthetic hand is our approximation of the participant’s demonstrated movement of the illusory percept (grey dashed lines). All events are plotted along time-linked axes. The raw matching hand movement start times (solid circles) and stop times (x’s) are colored according to relative position within the experimental timeline (first = blue, last = red). Gold stars = intersection of the average movement start and stop points for the EMG-control and the demonstrated movement. (C) Graph showing average percept speeds (n=30; error bars represent standard deviation) in Par 1, Par 2 and Par 5 measured before (Pre), after one, two, three, four and five conditioning games (ASG1-5) designed to increase percept speed (Fig. S8B,C), and after a washout period (Post). The grey area represents the range of hand close speed at the lowest speed setting in a common commercially available prosthetic hand (OttoBock Speed 0 Range).

References

    1. Wolpert DM, Ghahramani Z, Jordan MI. An internal model for sensorimotor integration. Science. 1995;269:1880–1882. - PubMed
    1. Tomlinson T, Miller LE. Toward a proprioceptive neural interface that mimics natural cortical activity. Adv Exp Med Biol. 2016;957:367–388. - PMC - PubMed
    1. Lee RE. Reassessing myoelectric control: Is it time to look at alternatives? Can Med Assoc J. 1987;136:467–469. - PMC - PubMed
    1. Bongers RM, Kyberd PJ, Bouwsema H, Kenney LPJ, Plettenburg DH, Van Der Sluis CK. Bernstein’s levels of construction of movements applied to upper limb prosthetics. J Prosthet Orthot. 2012;24:67–76.
    1. Fraser C, Wing AW. A case study of reaching by a user of a manually-operated artificial hand. Prosthet Orthot Int. 1981;5:151–156. - PubMed

Publication types