. 2018 Mar 14;9(1):1087.
doi: 10.1038/s41467-018-03430-6.

Compression force sensing regulates integrin αIIbβ3 adhesive function on diabetic platelets

Affiliations

Compression force sensing regulates integrin αIIbβ3 adhesive function on diabetic platelets

Lining Ju et al. Nat Commun. .

Abstract

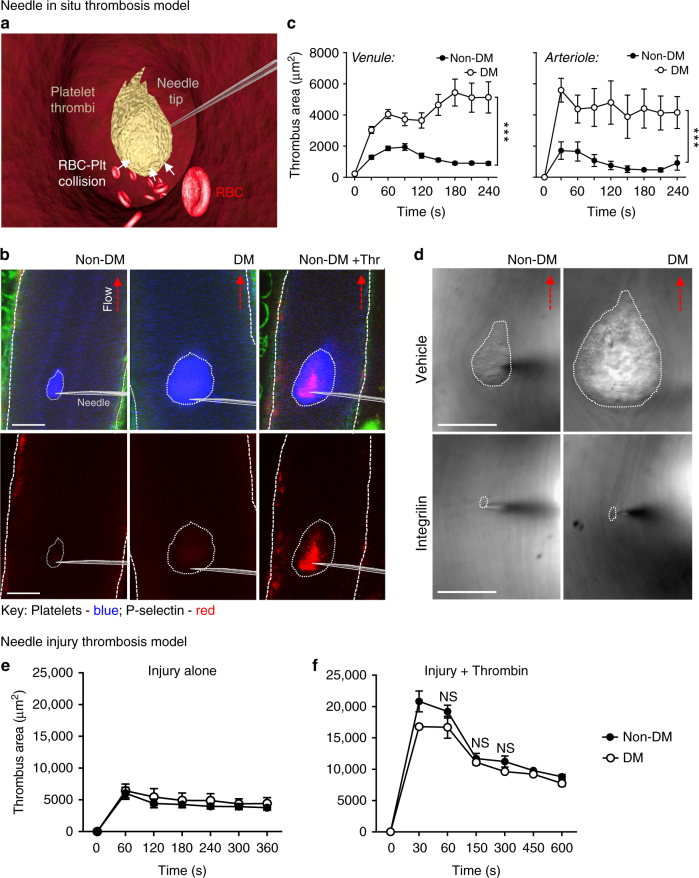
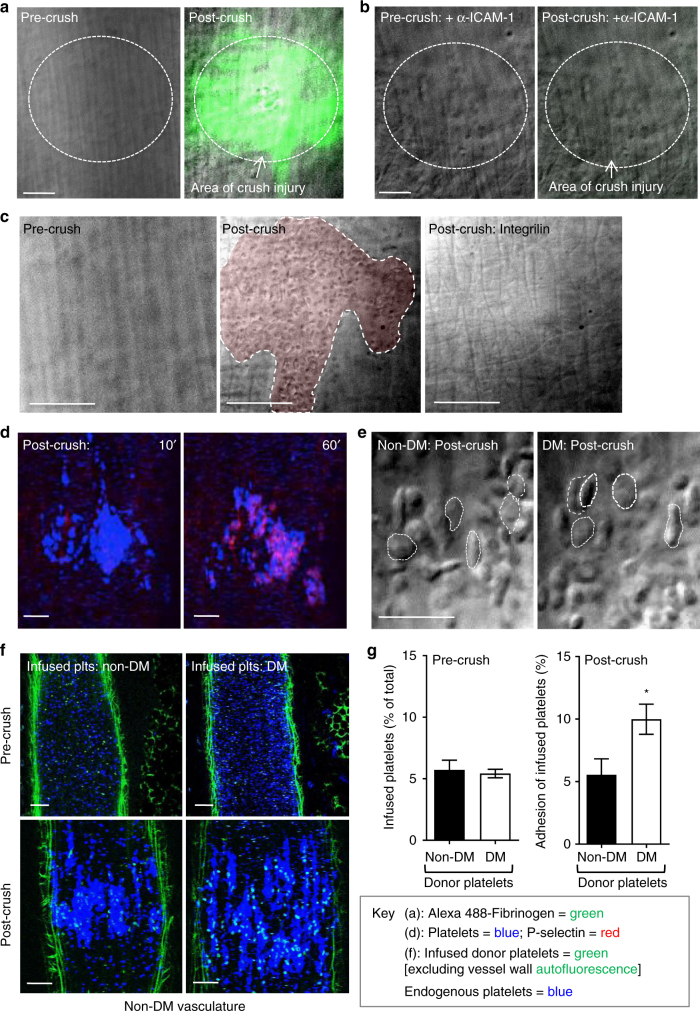
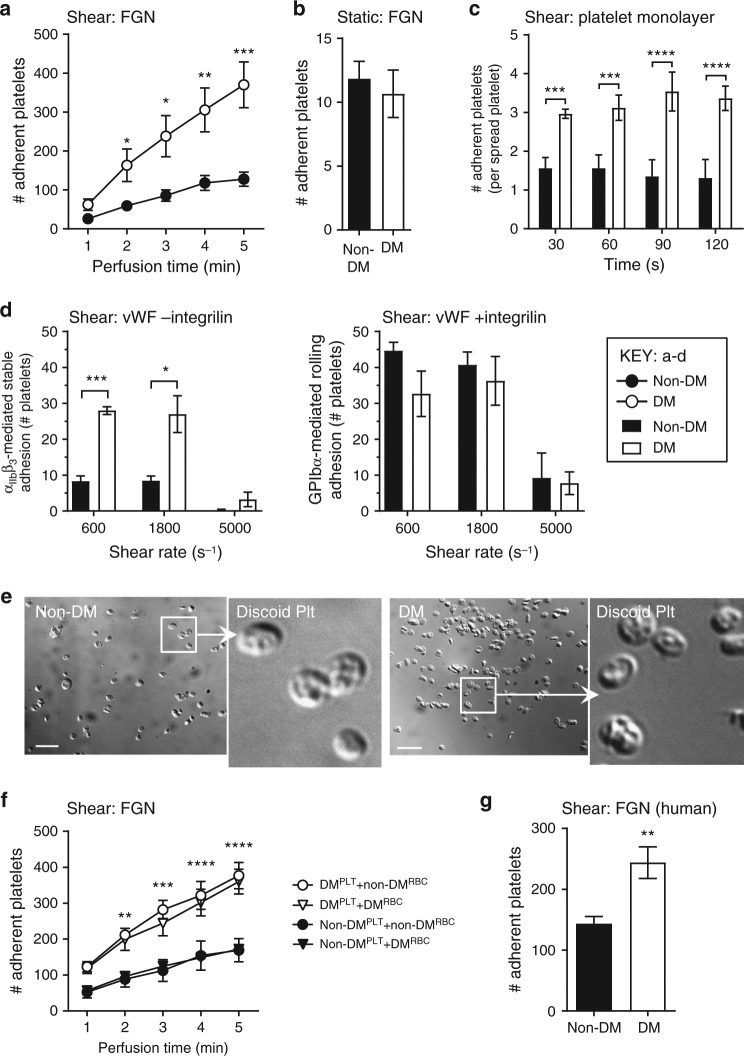
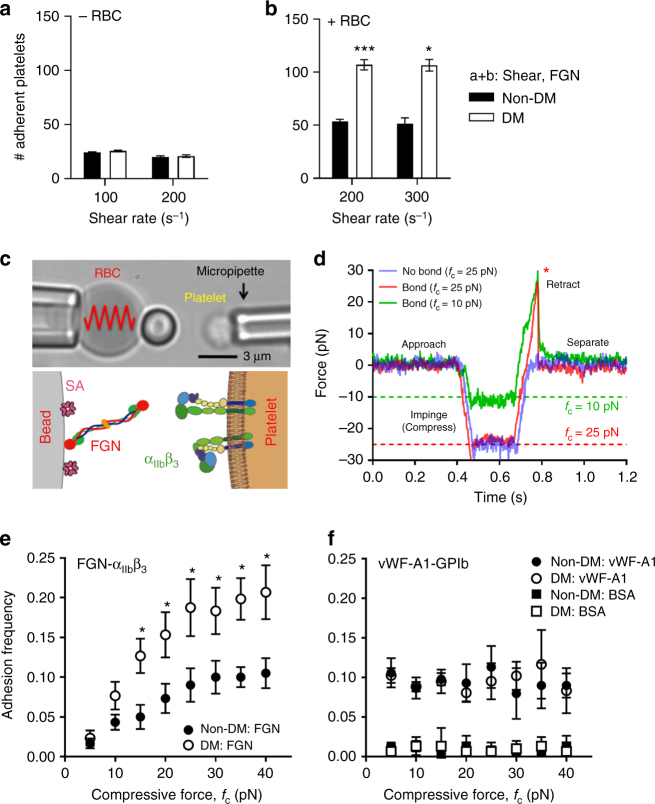
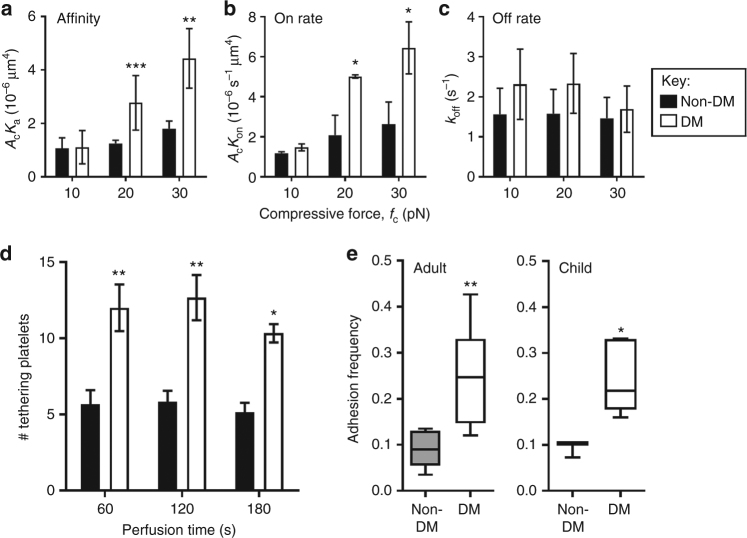
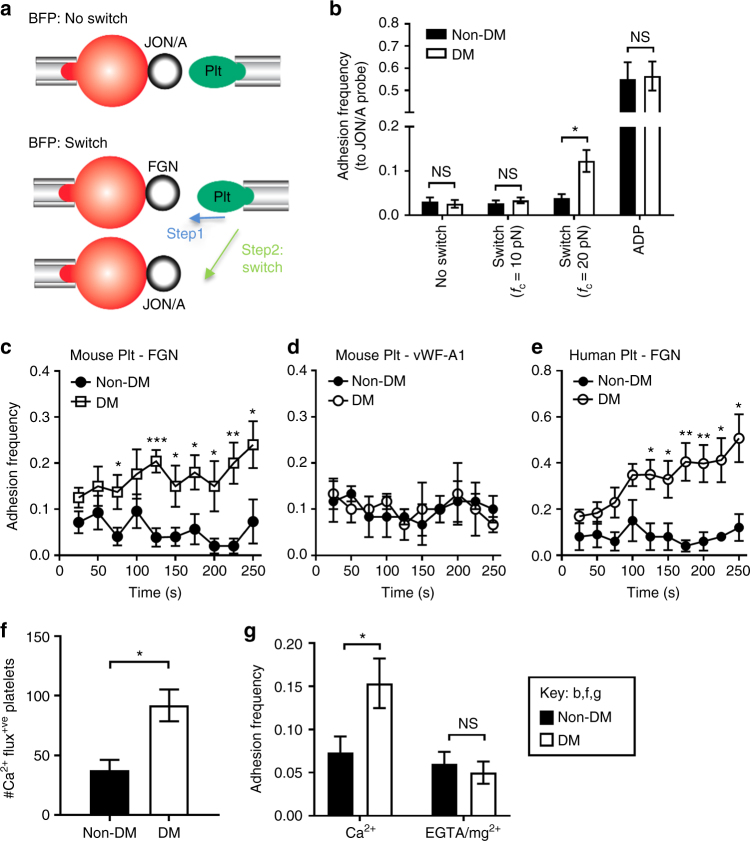
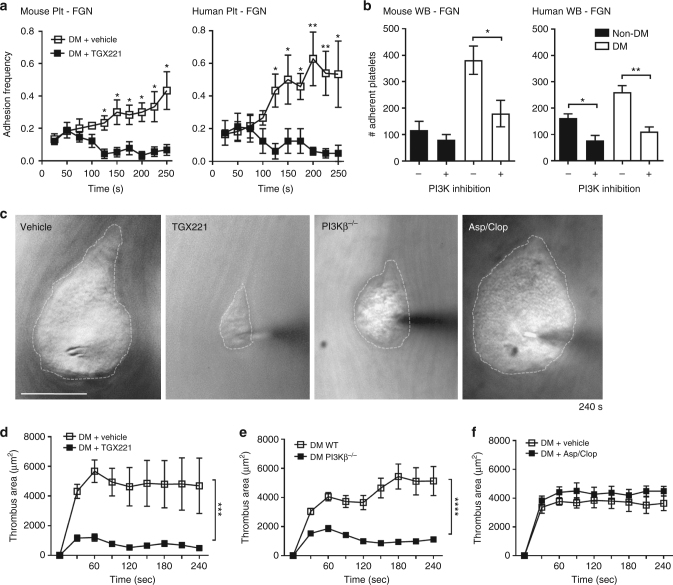
Diabetes is associated with an exaggerated platelet thrombotic response at sites of vascular injury. Biomechanical forces regulate platelet activation, although the impact of diabetes on this process remains ill-defined. Using a biomembrane force probe (BFP), we demonstrate that compressive force activates integrin αIIbβ3 on discoid diabetic platelets, increasing its association rate with immobilized fibrinogen. This compressive force-induced integrin activation is calcium and PI 3-kinase dependent, resulting in enhanced integrin affinity maturation and exaggerated shear-dependent platelet adhesion. Analysis of discoid platelet aggregation in the mesenteric circulation of mice confirmed that diabetes leads to a marked enhancement in the formation and stability of discoid platelet aggregates, via a mechanism that is not inhibited by therapeutic doses of aspirin and clopidogrel, but is eliminated by PI 3-kinase inhibition. These studies demonstrate the existence of a compression force sensing mechanism linked to αIIbβ3 adhesive function that leads to a distinct prothrombotic phenotype in diabetes.


Conflict of interest statement

The authors declare no competing interests.

Figures

Fig. 1
Fig. 1
Diabetes exaggerates discoid platelet thrombus growth under local flow disturbance in vivo. Control non-diabetic (non-DM) and diabetic (DM) mice were administered Dylight 649-anti-GPIbβ Ab and Alexa 546-anti-P-selectin Ab, prior to subjection to the ‘needle in situ’ model of thrombosis, as described under ‘Methods section’. In some experiments (d), mice were treated with vehicle or integrilin (as described) prior to needle injury. a Schematic illustration of the ‘needle in situ’ thrombosis model, wherein a microinjector needle is inserted into the center of the vessel lumen to create local flow disturbance. Thrombus formation is initiated at the needle tip and propagated by aggregating discoid platelets. Red blood cells (RBCs) have a collisional effect on platelets within the growing thrombus. b Thrombus growth (blue) and P-selectin expression (red) were monitored in real-time via confocal microscopy, with representative images depicting P-selectinve thrombi (blue) in both non-DM and DM mice, 4 min post-needle insertion. P-selectin+ve thrombi were detected only following injection of thrombin (green: collagen autofluorescence). c, d Thrombus surface area of non-DM and DM mice was quantified at the indicated time points post-needle insertion. c Results are expressed as mean ± s.e.m., n = 3 mice (6–8 thrombi per mouse examined in venules and 5 thrombi per mouse in arterioles). d Representative DIC images depicting thrombi (dotted line) forming 4 min post-needle insertion in non-DM and DM mice, either untreated (control) or treated with αIIbβ3 antagonist integrilin (4 mg kg−1, i.v.). e, f In some experiments, thrombi induced in non-DM and DM mice by needle perturbing mesenteric venules alone (e) was compared to local injection of thrombin (100 U mL−1) (f). Thrombus formation was monitored using DIC intravital microscopy and thrombus surface area quantified at the indicated injury times. Results (e, f) are expressed as mean ± s.e.m. of n = 3 mice, (2–3 thrombi per mouse). For all studies, results were assessed using an unpaired, two-tailed Student’s t-test, where *p < 0.5; ****p < 0.0001. Scale bars = 50 μm
Fig. 2
Fig. 2
Enhanced diabetic platelet-endothelial interactions in vivo. The mesenteric venules of non-DM or DM mice were subjected to crush injury using a blunt needle, as detailed under ‘Methods section’. ac C57Bl/6 mice were administered Alexa 488-fibrinogen alone (a), or together with an anti-ICAM-1 blocking Ab (Clone YN1, 200 μg per mouse) (b), prior to injury. Representative DIC/fluorescence overlay images demonstrate ICAM-1-dependent fibrinogen deposition (green) on the endothelium, post- but not pre-crush injury (broken circles). Scale bars = 25 μm. In some experiments, mice were pre-administered integrilin (4 mg kg−1) (c), prior to injury, with representative DIC images demonstrating platelet adhesion to the crushed endothelium (shaded in red) in vehicle treated- (middle panel—post-crush), but not integrilin-treated mice (right panel—Post-crush: integrilin), or pre-crush injury (left panel). Scale bars = 25 μm. d C57BL/6 mice were administered Alexa 546-anti-P-selectin Ab and DyLight 649-anti-GPIbβ Ab, prior to crush injury. Representative confocal images depict the absence P-selectin (red) expression early after injury (10 min), instead developing at 60 min post-crush injury on endothelial adherent platelets (blue). Scale bars = 50 μm. e Representative DIC images depict the majority of the endothelial adherent platelets in non-diabetic (non-DM) and diabetic (DM) mice 10 min post crush injury (some discoid platelets marked with dotted circles) retain a discoid morphology. Scale bars = 10 μm. f, g Non-DM and DM platelets were isolated, labeled with an Alexa 488-anti-GPIbβ Ab (100 μg kg−1), and then infused into recipient non-DM mice, pre-administered DyLight 649-anti-GPIbβ antibody (100 μg kg−1), at a donor/recipient ratio of 1:10. f Representative confocal images demonstrating both infused (green) and endogenous (blue) platelets in mesenteric circulation of recipient non-DM mice, pre- (upper panel) and post- (lower panel) crush injury. Scale bars = 50 μm. g The adherent donor and recipient platelets to the crushed endothelial area was quantitated by determining their fluorescence intensities, and expressed as a percentage of the recipient endogenous platelets within the same crushed surface area (green: collagen autofluorescence). All results represent the mean ± s.e.m. of n = 4 mice (six injuries per mouse), assessed by unpaired, two-tailed Student’s t-test, where *p < 0.5
Fig. 3
Fig. 3
Diabetes enhances integrin αIIbβ3 mediated platelet adhesion under shear. a Hirudinated whole blood from non-DM or DM mice were perfused through fibrinogen (FGN) matrices for 5 min at 600 s−1, and the number of adherent platelets determined at the indicated perfusion times. b Isolated mouse platelets were allowed to adhere to FGN matrices under static conditions for 5 min, and the number of adherent platelets quantitated. c Hirudinated whole blood from non-DM and DM mice were pretreated with amplification loop blockers (ALBs): indomethacin (10 μM), MRS2179 (100 μM), and 2-MeSAMP (10 μM), then perfused over spread platelets at 1800 s−1. The number of adherent platelets per spread platelet was quantified at 30 s intervals for 120 s. d Hirudinated mouse whole blood was perfused over mouse vWF matrices at 600, 1800, and 5000 s−1, as detailed under Methods section. The numbers of stationary (−integrilin) vs. transient/rolling (+integrilin) platelets were determined at 1 min perfusion time. e Hirudinated mouse whole blood was perfused through FGN matrices at 600 s−1 for 1 min, and adherent platelets were fixed immediately. Representative DIC images depict the discoid morphology of the adherent non-DM and DM mouse platelets. Scale bars = 5 μm. f Platelets isolated from non-DM and DM mice were reconstituted with isolated red blood cells (RBCs) from the same (autologous) or counterpart (heterologous) mice, prior to perfusion over matrices at 600 s−1. The number of adherent non-DM and DM platelets was determined at the indicated perfusion times. g Hirudinated whole blood from non-DM or DM humans was perfused through FGN matrices for 5 min at 300 s−1, and the number of adherent platelets determined at 5 min perfusion time. Results performed with human samples are expressed as mean ± s.e.m. of n = 16 for non-DM and n = 18 for DM patients. All other results represent n = 3 mice, with each perfusion performed in duplicates or triplicates. NS = not significant, p ≥ 0.05; *p < 0.05; **p < 0.01; ***p < 0.001; ****p < 0.0001, assessed by unpaired, two-tailed Student’s t-test
Fig. 4
Fig. 4
Compressive force dependent enhancement in integrin αIIbβ3–fibrinogen interaction in diabetic platelets. a, b Isolated platelets from non-DM and DM mice were perfused over FGN matrices at the indicated shear rates, in the absence (a, −RBC) or presence (b, +RBC) of RBC reconstitution. The number of adherent platelets was determined following 3 min of perfusion time. c Schematic illustration of the biomembrane force probe (BFP) setup. (Top) The micropipette-aspirated platelet is driven forward to touch and then retracted back from the adhesive ligand- (i.e., FGN or vWF) coated bead, which is attached to a RBC aspirated by another micropipette. (Bottom): each ‘touch-retract’ cycle allows platelet surface integrin αIIbβ3 to associate and then dissociate with FGN on the bead. d Illustration of bond detection using BFP. The platelet is driven to touch the probe bead under a compressive force (fc) of 10 (green) or 25 pN (red), held in contact for 0.2 s, and then retracted. In a ‘bond’ event (green and red), a loading force increases until the bond rupture (red asterisk), whereas a ‘no-bond’ event shows zeroforce (blue). e, f Non-DM (closed circles) and DM (open circles) mouse platelets were subjected to 50 BFP cycles under the indicated compressive forces (fc = 5–40 pN) using beads coated with FGN (e), vWF-A1 or BSA (f), and the number of ‘bond’ events over the total number of events was analysed and expressed as adhesion frequency. All results are expressed as mean ± s.e.m. of n = 3 mice. For each experiment, adhesion frequencies were measured and averaged from ≥4 plateletbead pairs. Results were assessed using an unpaired, two-tailed Student’s t-test, where *p < 0.5; **p < 0.01
Fig. 5
Fig. 5
Compressive forces enhance integrin αIIbβ3–fibrinogen bond formation in diabetic platelets. ac Platelets from non-DM and DM mice were subjected to BFP cycles using FGN-coated beads at various contact times to determine the 2D affinity (a), on-rate (b) and off-rate (c) of integrin αIIbβ3 at fc = 10, 20 and 30 pN, as detailed under Methods section. d Hirudinated whole blood from non-DM or DM mice were perfused over FGN matrices at 600 s−1, and the number of tethered platelets at the indicated perfusion times was quantified. Results are expressed as mean ± s.e.m. of n = 3–4 mice. e Human platelets from non-DM and DM adults or children were subjected to 50 BFP cycles using beads coated with FGN at fc = 20 pN, and adhesion frequency determined. Data are represented in box and whisker plot format, with median, first and third quartiles outlined by the box, and minimum and maximum values of the data set denoted by whiskers (n = 7 for both non-DM and DM adults; n = 3 for non-DM children; n = 5 for DM children) *p < 0.5; **p < 0.01, assessed by unpaired, two-tailed Student’s t-test
Fig. 6
Fig. 6
Compression force-dependent activation of integrin αIIbβ3. a Schematics of ‘no switch’ BFP (top) and ‘switch’ dual BFP setup (bottom). In the ‘switch’ setup, the platelet is first subjected to 50 cycles with a FGN coated bead at a compressive force of 20 pN (step 1), and then switched to 50 cycles with bead coated with JON/A. b Mouse platelet adhesion frequencies with JON/A were determined under conditions of no switch, or switch at the indicated compressive forces (fc = 10, 20 pN), or ADP stimulation (10 µM). ce Non-DM and DM platelets from mice or humans were subjected to 100 BFP cycles at fc = 20 pN using FGN (c, e) or vWF-A1 (d) beads. Adhesion frequency was analyzed for every 10 consecutive cycles and plotted over time (2.5 s/cycle). f Isolated mouse non-DM and DM platelets were loaded with calcium dyes Oregon Green BAPTA and Fura Red, reconstituted with RBCs from the same mouse, and perfused over FGN matrices at 600 s−1. The calcium changes in individual adherent platelets were monitored and the number of adherent platelets displaying Ca2+ flux analysed. g Non-DM and DM mouse platelets were resuspended in Tyrode’s buffer containing 1 mM Ca2+ or 1 mM EGTA/Mg2+, subjected to 50 BFP cycles using FGN-beads at fc = 20 pN, and adhesion frequency determined. All results are expressed as the mean ± s.e.m. of n = 3 mice and assessed by unpaired, two-tailed Student’s t-test, where *p < 0.5; **p < 0.01
Fig. 7
Fig. 7
PI3Kβ regulates integrin αIIbβ3 biomechanical signaling and adhesive function in diabetic platelets. a Washed platelets were isolated from non-DM and DM mice or humans, and treated with either DMSO (vehicle) or the PI3Kβ inhibitor TGX221 (TGX221, 0.5 µM), then subjected to 100 BFP cycles using FGN-coated beads, as described in Fig. 6c–e. Adhesion frequency was analyzed for every 10 consecutive cycles and plotted over time (2.5 s/cycle). b Hirudinated whole blood from non-DM and DM mice or humans were treated with DMSO (vehicle) or the pan-isoform PI3K inhibitor LY294002 (100 μM) for 10 min, perfused over FGN matrices at 600 or 300 s−1 for mouse or human blood respectively, and the number of adherent platelets analyzed after 4 min perfusion. cf Thrombi were induced using the needle in situ model in diabetic mice treated with DMSO (vehicle), or PI3Kβ inhibitor TGX221 (2.5 mg kg−1), or aspirin/clopidogrel, and in diabetic PI3Kβ−/− mice. c Representative DIC images depict thrombi (broken outline) formed around the needle tip 240 s post needle insertion. Note that the enhanced thrombotic response observed in diabetic subjects was abrogated by PI3Kβ deficiency or inhibition, but not by aspirin/clopidogrel. df Thrombus surface area was quantified over the entire 4 min period for the indicated diabetic mouse types. Results are expressed as the mean ± s.e.m. of n = 3 mice, with 6 (d) or 8 (e, f) thrombi/mouse. Results were assessed by an unpaired, two-tailed Student’s t-test, where *p < 0.5; **p < 0.01; ***p < 0.001; ****p < 0.0001; Scale bars = 50 μm

References

    1. Moreno PR, Fuster V. New aspects in the pathogenesis of diabetic atherothrombosis. J. Am. Coll. Cardiol. 2004;44:2293–2300. doi: 10.1016/j.jacc.2004.07.060. - DOI - PubMed
    1. Jackson SP. Arterial thrombosis--insidious, unpredictable and deadly. Nat. Med. 2011;17:1423–1436. doi: 10.1038/nm.2515. - DOI - PubMed
    1. Sagel J, Colwell JA, Crook L, Laimins M. Increased platelet aggregation in early diabetus mellitus. Ann. Intern. Med. 1975;82:733–738. doi: 10.7326/0003-4819-82-6-733. - DOI - PubMed
    1. Mandal S, Sarode R, Dash S, Dash RJ. Hyperaggregation of platelets detected by whole blood platelet aggregometry in newly diagnosed noninsulin-dependent diabetes mellitus. Am. J. Clin. Pathol. 1993;100:103–107. doi: 10.1093/ajcp/100.2.103. - DOI - PubMed
    1. Angiolillo DJ, et al. Platelet function profiles in patients with type 2 diabetes and coronary artery disease on combined aspirin and clopidogrel treatment. Diabetes. 2005;54:2430–2435. doi: 10.2337/diabetes.54.8.2430. - DOI - PubMed

Publication types

MeSH terms