. 2018 Mar 14;9(1):1067.
doi: 10.1038/s41467-018-03480-w.

The preprophase band-associated kinesin-14 OsKCH2 is a processive minus-end-directed microtubule motor

Affiliations

The preprophase band-associated kinesin-14 OsKCH2 is a processive minus-end-directed microtubule motor

Kuo-Fu Tseng et al. Nat Commun. .

Abstract

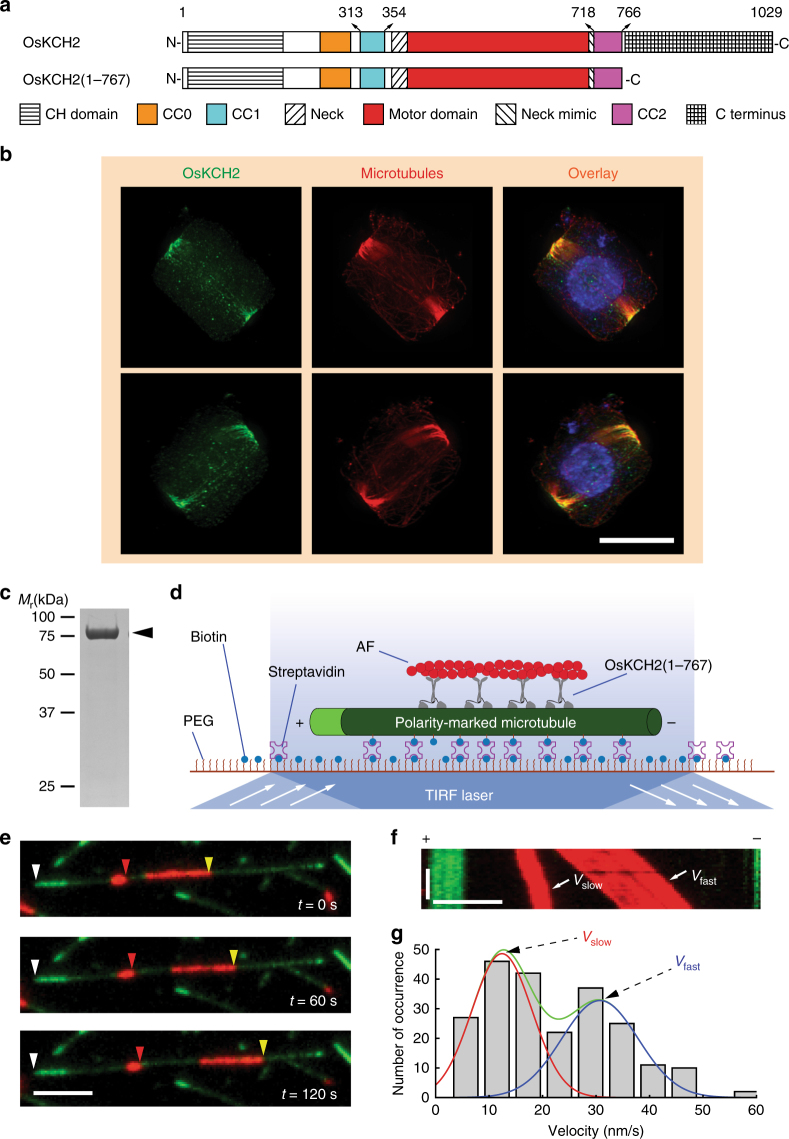
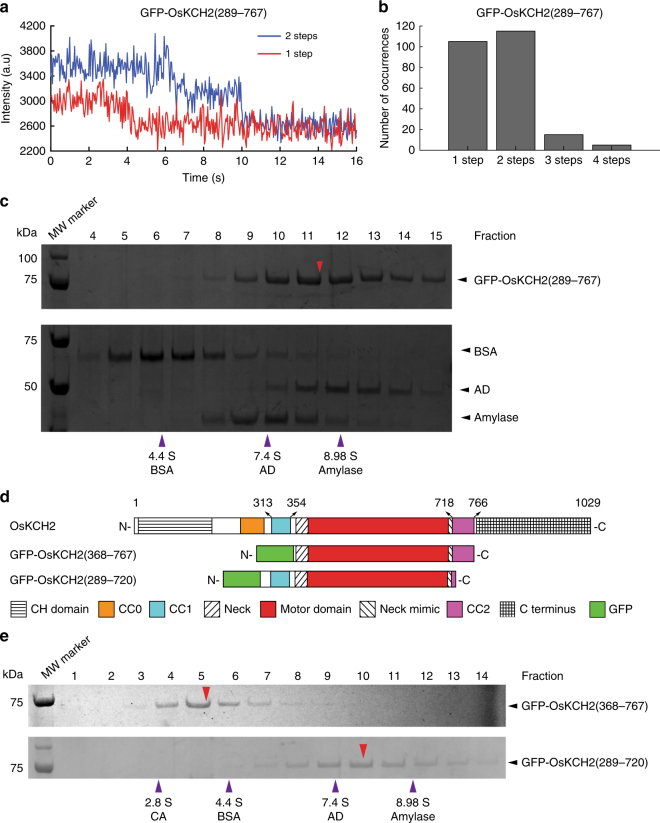
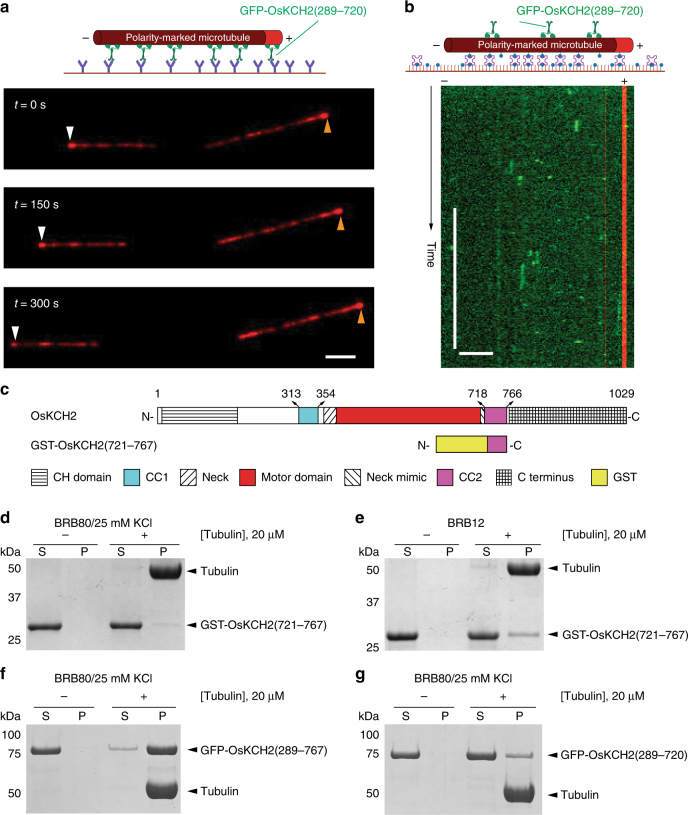
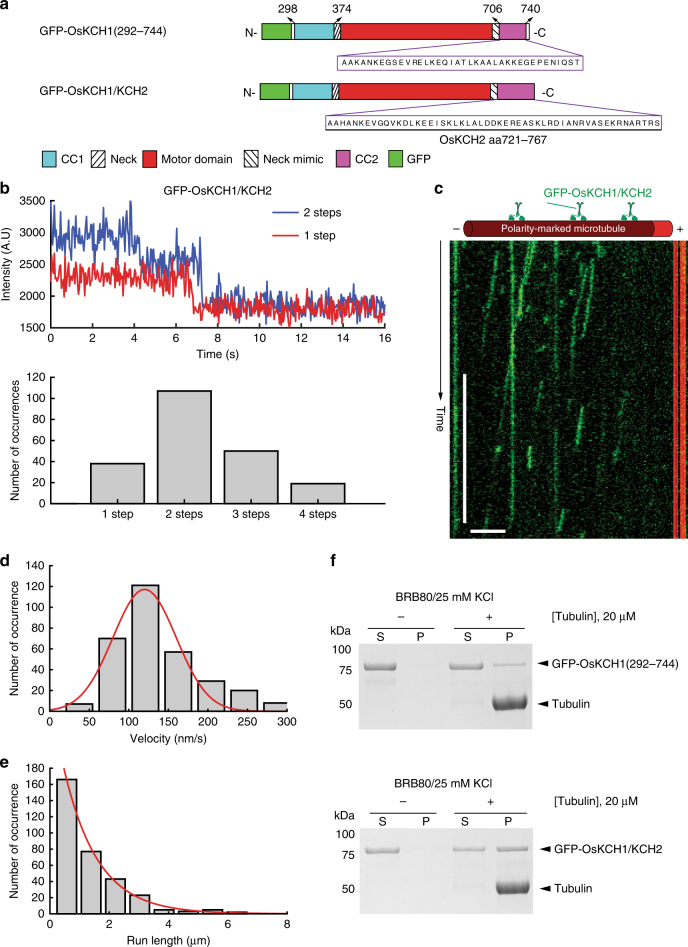
In animals and fungi, cytoplasmic dynein is a processive minus-end-directed motor that plays dominant roles in various intracellular processes. In contrast, land plants lack cytoplasmic dynein but contain many minus-end-directed kinesin-14s. No plant kinesin-14 is known to produce processive motility as a homodimer. OsKCH2 is a plant-specific kinesin-14 with an N-terminal actin-binding domain and a central motor domain flanked by two predicted coiled-coils (CC1 and CC2). Here, we show that OsKCH2 specifically decorates preprophase band microtubules in vivo and transports actin filaments along microtubules in vitro. Importantly, OsKCH2 exhibits processive minus-end-directed motility on single microtubules as individual homodimers. We find that CC1, but not CC2, forms the coiled-coil to enable OsKCH2 dimerization. Instead, our results reveal that removing CC2 renders OsKCH2 a nonprocessive motor. Collectively, these results show that land plants have evolved unconventional kinesin-14 homodimers with inherent minus-end-directed processivity that may function to compensate for the loss of cytoplasmic dynein.


Conflict of interest statement

The authors declare no competing interests.

Figures

Fig. 1
Fig. 1
OsKCH2 localizes to the PPB at prophase in vivo and transports AFs on the microtubule with minus-end-directed motility in vitro. a Schematic diagrams of the full-length OsKCH2 and OsKCH2(1–767). b OsKCH2 shows a punctate localization pattern along the PPB microtubules at prophase. Top and bottom rows are triple labeling of OsKCH2 (green), microtubules (red), and the nucleus (blue) in a rice cell at prophase when viewed from two different angles. c Coomassie-stained SDS-polyacrylamide gel electrophoresis (SDS-PAGE) of purified recombinant OsKCH2(1–767). d Schematic diagram of the AF transport assay. e Micrograph montage showing that OsKCH2(1–767) transports rhodamine-labeled AFs (red) along an Alexa 488-labeled polarity-marked microtubule (green) toward the minus end. White arrowheads indicate the microtubule plus end, and red and yellow arrowheads indicate the leading ends of two different AFs. f Kymograph of two AFs shown in e moving at a fast velocity (Vfast) and a slow one (Vslow). g Velocity histogram of AF transport along microtubules with two distinct velocities. The velocity histogram was fitted to a combination of two Gaussian distributions. The green curve indicates the overall fit, and red and blue curves indicate the slow and fast velocity distribution, respectively. Scale bars: 1 min (vertical) and 5 µm (horizontal)
Fig. 2
Fig. 2
GFP-OsKCH2(289-767) moves on the microtubule with minus-end-directed processive motility. a Schematic diagrams of the full-length OsKCH2 and GFP-OsKCH2(289–767). b Coomassie-stained SDS-PAGE of purified recombinant GFP-OsKCH2(289–767). c Schematic diagram of the ensemble microtubule gliding assay. d Micrograph montage showing the motion of polarity-marked microtubules (red) glided by surface-immobilized GFP-OsKCH2(289–767). Arrowheads (brown, white, and yellow) indicate the plus ends of three different microtubules. e Schematic diagram of the single-molecule motility assay for observing the movement of individual GFP-OsKCH2(289–767) molecules on single microtubules. f Kymographs of single GFP-OsKCH2(289–767) molecules (green) moving processively toward the minus end of single polarity-marked microtubules (red). g Velocity histogram of single GFP-OsKCH2(289–767) molecules. Red line indicates a Gaussian fit to the velocity histogram. h Run-length histogram of single GFP-OsKCH2(289–767) molecules. Red line indicates a single-exponential fit to the run-length histogram. Scale bars: 1 min (vertical) and 5 µm (horizontal)
Fig. 3
Fig. 3
GFP-OsKCH2(289-767) forms a homodimer via CC1. a Example fluorescence intensity traces over time of individual GFP-OsKCH2(289–767) molecules immobilized on the microtubules. b Histogram of the photobleaching steps of GFP-OsKCH2(289–767) (n = 240). c SDS-PAGE analysis of fractions from the sucrose gradient centrifugation assays of GFP-OsKCH2(289–767) (top) and the standard proteins (bottom). For each protein, the band intensity distribution was fit to a Gaussian function to determine the peak fraction. Red arrowhead corresponds to the estimated peak fraction position of GFP-OsKCH2(289–767); and purple arrowheads correspond to the estimated peak fraction positions of the standard proteins as indicated. The molecular weight of GFP-OsKCH2(289–767) was estimated to be 177.9 ± 3.8 kDa (mean ± s.d., n = 3). d Schematic diagrams of the full-length OsKCH2, GFP-OsKCH2(368–767), and GFP-OsKCH2(289–720). e SDS-PAGE analysis of fractions from the sucrose gradient centrifugation assays of GFP-OsKCH2(368–767) (top) and GFP-OsKCH2(289–720) (bottom). Red arrowheads correspond to the peak fraction positions of GFP-OsKCH2(368–767) and GFP-OsKCH2(289–720); and purple arrowheads correspond to the peak fraction positions of the standard proteins as indicated. For each protein, the peak fraction was estimated by fitting the band intensity distribution to a Gaussian function. The molecular weights of GFP-OsKCH2(368–767) and GFP-OsKCH2(289–720) were determined to be 60.9 ± 7.9 kDa and 155.7 ± 8.3 kDa, respectively (mean ± s.d., n = 3)
Fig. 4
Fig. 4
CC2 enables GFP-OsKCH2(289-767) processivity by enhancing its microtubule-binding affinity. a Micrograph montage showing the gliding motion of polarity-marked microtubules (red) driven by surface-immobilized GFP-OsKCH2(289–720). White and brown arrowheads indicate the plus end of a polarity-marked microtubule at three different time points. b Example kymograph showing the nonprocessive motility of GFP-OsKCH2(289–720) on the microtubule. c Schematic diagrams of the full-length OsKCH2 and GST-OsKCH2(721–767). d Coomassie-stained SDS-PAGE of the microtubule co-sedimentation assay for GST-OsKCH2(721–767) in BRB80/25 mM KCl. e Coomassie-stained SDS-PAGE of the microtubule co-sedimentation assay for GST-OsKCH2(721–767) in BRB12. f Coomassie-stained SDS-PAGE of the microtubule co-sedimentation assay for GFP-OsKCH2(289–767) in BRB80/25 mM KCl. g Coomassie-stained SDS-PAGE of the microtubule co-sedimentation assay for GFP-OsKCH2(289–720) in BRB80/25 mM KCl. Scale bars: 30 s (vertical) and 5 µm (horizontal)
Fig. 5
Fig. 5
The GFP-OsKCH1/KCH2 chimera is a processive minus-end-directed motor. a Schematic diagrams of GFP-OsKCH1(292–744) and the GFP-OsKCH1/KCH2 chimera. GFP-OsKCH1/KCH2 is a derivative of GFP-OsKCH1(292–744) by replacing its endogenous CC2 with that from OsKCH2. b Photobleaching analyses of GFP-OsKCH1/KCH2. (Top) Example fluorescence intensity traces over time of individual GFP-OsKCH1/KCH2 molecules immobilized on the microtubules. (Bottom) Histogram of the photobleaching steps of GFP-OsKCH1/KCH2 (n = 214). c Example kymograph of individual GFP-OsKCH1/KCH2 molecules (green) moving processively toward the minus end of single polarity-marked microtubules (red). d Velocity histogram of single GFP-OsKCH1/KCH2 molecules. Red line indicates a Gaussian fit to the velocity histogram. e Run-length histogram of single GFP-OsKCH1/KCH2 molecules. Red line indicates a single-exponential fit to the run-length histogram. f Coomassie-stained SDS-PAGE of the microtubule co-sedimentation assay for (top) GFP-OsKCH1(292–744) and (bottom) GFP-OsKCH1/KCH2 in BRB80/25 mM KCl. Scale bars: 30 s (vertical) and 5 µm (horizontal)

Similar articles

Cited by

References

    1. Vale RD. The molecular motor toolbox for intracellular transport. Cell. 2003;112:467–480. doi: 10.1016/S0092-8674(03)00111-9. - DOI - PubMed
    1. Drummond DR. Regulation of microtubule dynamics by kinesins. Semin. Cell Dev. Biol. 2011;22:927–934. doi: 10.1016/j.semcdb.2011.09.021. - DOI - PubMed
    1. Vicente JJ, Wordeman L. Mitosis, microtubule dynamics and the evolution of kinesins. Exp. Cell Res. 2015;334:61–69. doi: 10.1016/j.yexcr.2015.02.010. - DOI - PMC - PubMed
    1. Hancock WO, Howard J. Processivity of the motor protein kinesin requires two heads. J. Cell Biol. 1998;140:1395–1405. doi: 10.1083/jcb.140.6.1395. - DOI - PMC - PubMed
    1. Marcus AI, Li W, Ma H, Cyr RJ. A kinesin mutant with an atypical bipolar spindle undergoes normal mitosis. Mol. Biol. Cell. 2003;14:1717–1726. doi: 10.1091/mbc.E02-09-0586. - DOI - PMC - PubMed

Publication types