

The Cannabinoid Content of Legal Cannabis in Washington State Varies Systematically Across Testing Facilities and Popular Consumer Products
- PMID: 29540728
- PMCID: PMC5852027
- DOI: 10.1038/s41598-018-22755-2
The Cannabinoid Content of Legal Cannabis in Washington State Varies Systematically Across Testing Facilities and Popular Consumer Products
Erratum in
-
Author Correction: The Cannabinoid Content of Legal Cannabis in Washington State Varies Systematically Across Testing Facilities and Popular Consumer Products.Sci Rep. 2020 Aug 27;10(1):14406. doi: 10.1038/s41598-020-69680-x. Sci Rep. 2020. PMID: 32848160 Free PMC article.
Abstract
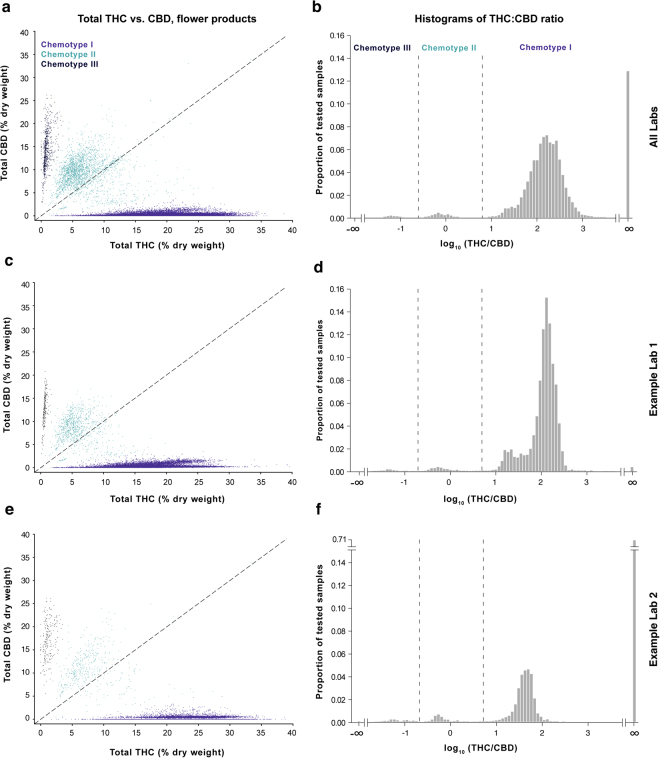
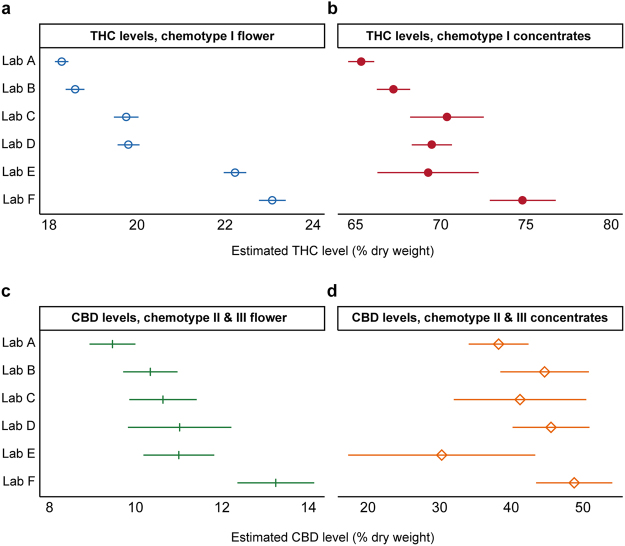
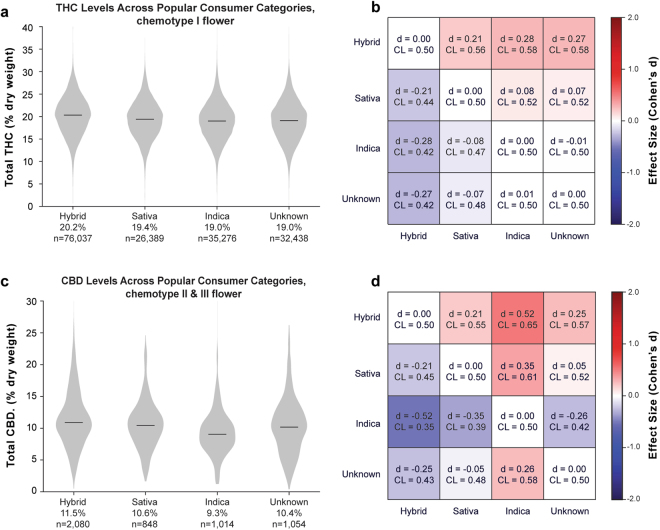
The majority of adults in the U.S. now have state-legal access to medical or recreational cannabis products, despite their federal prohibition. Given the wide array of pharmacologically active compounds in these products, it is essential that their biochemical profile is measured and reported to consumers, which requires accurate laboratory testing. However, no universal standards for laboratory testing protocols currently exist, and there is controversy as to whether all reported results are legitimate. To investigate these concerns, we analyzed a publicly available seed-to-sale traceability dataset from Washington state containing measurements of the cannabinoid content of legal cannabis products from state-certified laboratories. Consistent with previous work, we found that commercial Cannabis strains fall into three broad chemotypes defined by the THC:CBD ratio. Moreover, we documented systematic differences in the cannabinoid content reported by different laboratories, relative stability in cannabinoid levels of commercial flower and concentrates over time, and differences between popular commercial strains. Importantly, interlab differences in cannabinoid reporting persisted even after controlling for plausible confounds. Our results underscore the need for standardized laboratory methodologies in the legal cannabis industry and provide a framework for quantitatively assessing laboratory quality.
Conflict of interest statement
Nick Jikomes is employed by Leafly Holdings, Inc. which is wholly-owned by Privateer Holdings, a for-profit firm in the legal cannabis industry. Neither Leafly nor Privateer have a direct financial interest in any third-party laboratory testing facilities in the legal cannabis industry.
Figures


Similar articles
-
Potency levels of regulated cannabis products in Michigan 2021-2022.J Forensic Sci. 2023 Nov;68(6):1894-1905. doi: 10.1111/1556-4029.15345. Epub 2023 Jul 28. J Forensic Sci. 2023. PMID: 37501559
-
The frequency distribution of reported THC concentrations of legal cannabis flower products increases discontinuously around the 20% THC threshold in Nevada and Washington state.J Cannabis Res. 2021 Mar 14;3(1):6. doi: 10.1186/s42238-021-00064-2. J Cannabis Res. 2021. PMID: 33715627 Free PMC article.
-
Big data on a big new market: Insights from Washington State's legal cannabis market.Int J Drug Policy. 2018 Jul;57:86-94. doi: 10.1016/j.drugpo.2018.03.031. Epub 2018 Apr 27. Int J Drug Policy. 2018. PMID: 29709847 Free PMC article.
-
A review of methods for the chemical characterization of cannabis natural products.J Sep Sci. 2018 Jan;41(1):398-415. doi: 10.1002/jssc.201701003. Epub 2017 Dec 14. J Sep Sci. 2018. PMID: 28986974 Review.
-
Cannabis and Neuropsychiatric Disorders: An Updated Review.Acta Neurol Taiwan. 2019 Jun 15;28(2):27-39. Acta Neurol Taiwan. 2019. PMID: 31867704 Review.
Cited by
-
A marijuana-drug interaction primer: Precipitants, pharmacology, and pharmacokinetics.Pharmacol Ther. 2019 Sep;201:25-38. doi: 10.1016/j.pharmthera.2019.05.001. Epub 2019 May 7. Pharmacol Ther. 2019. PMID: 31071346 Free PMC article. Review.
-
Medical Cannabis Reduced Agitation in Acquired Brain Injury: A Case Study.Psychosomatics. 2020 Nov-Dec;61(6):819-824. doi: 10.1016/j.psym.2020.01.006. Epub 2020 Feb 25. Psychosomatics. 2020. PMID: 32111375 Free PMC article. No abstract available.
-
Effect of Cannabidiol and Δ9-Tetrahydrocannabinol on Driving Performance: A Randomized Clinical Trial.JAMA. 2020 Dec 1;324(21):2177-2186. doi: 10.1001/jama.2020.21218. JAMA. 2020. PMID: 33258890 Free PMC article. Clinical Trial.
-
Accuracy of labeled THC potency across flower and concentrate cannabis products.Sci Rep. 2025 Jul 1;15(1):20822. doi: 10.1038/s41598-025-03854-3. Sci Rep. 2025. PMID: 40592871 Free PMC article.
-
A "Good" Smoke? The Off-Label Use of Cannabidiol to Reduce Cannabis Use.Front Psychiatry. 2022 Mar 17;13:829944. doi: 10.3389/fpsyt.2022.829944. eCollection 2022. Front Psychiatry. 2022. PMID: 35370865 Free PMC article.
References
-
- Grinspoon, L. History of Cannabis as a Medicine. MAPS http://www.maps.org/research-archive/mmj/grinspoon_history_cannabis_medi... (2005).
-
- National Academies of Sciences, Engineering, and Medicine. The health effects of cannabis and cannabinoids: The current state of evidence and recommendations for research. National Academies Press. 10.17226/24625 (2017). - PubMed
-
- Geiger, A. Support for marijuana legalization continues to rise. Pew Research Center http://www.pewresearch.org/fact-tank/2016/10/12/support-for-marijuana-le... Accessed September 29, 2017 (2016).
MeSH terms
Substances
LinkOut - more resources
Full Text Sources
Other Literature Sources
Medical
