. 2018 Mar 14;8(1):4530.
doi: 10.1038/s41598-018-22749-0.

Interconnected Microphysiological Systems for Quantitative Biology and Pharmacology Studies

Affiliations

Interconnected Microphysiological Systems for Quantitative Biology and Pharmacology Studies

Collin D Edington et al. Sci Rep. .

Abstract

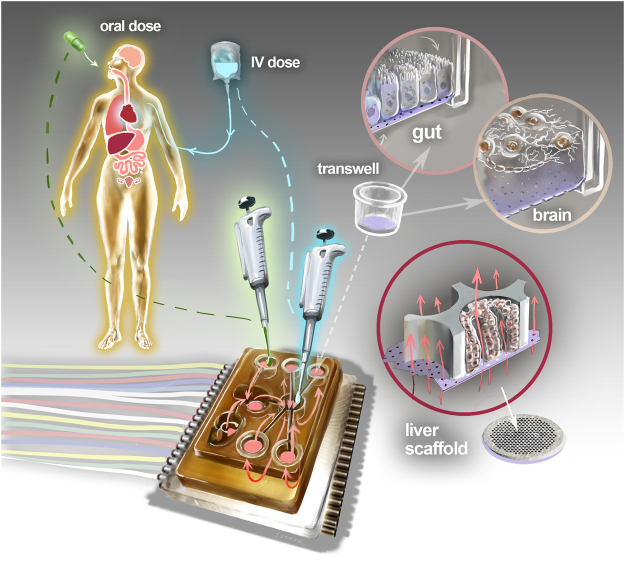
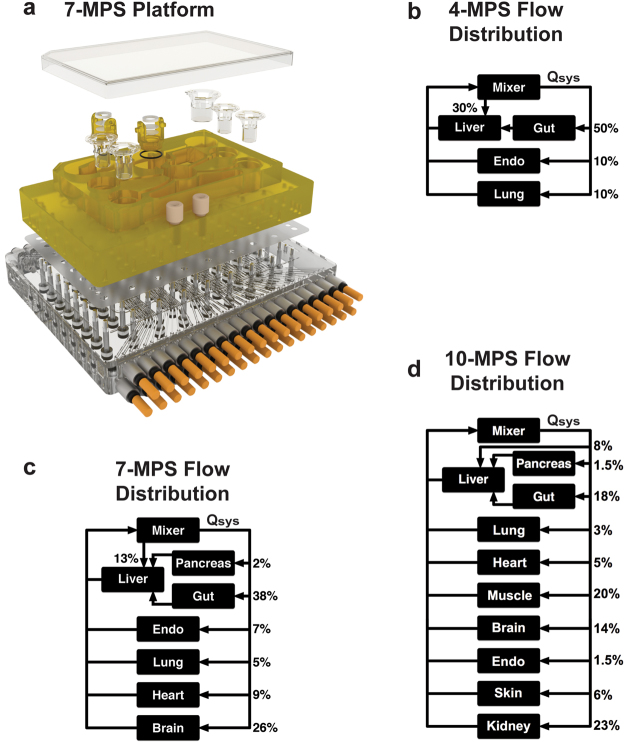
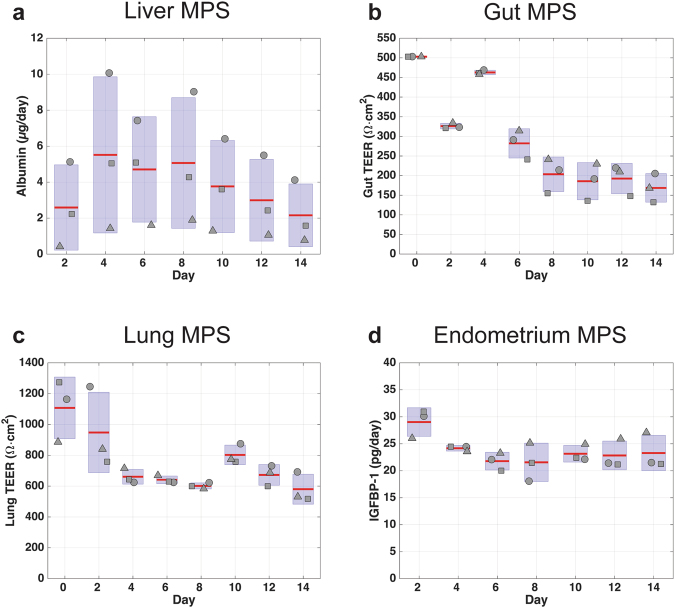
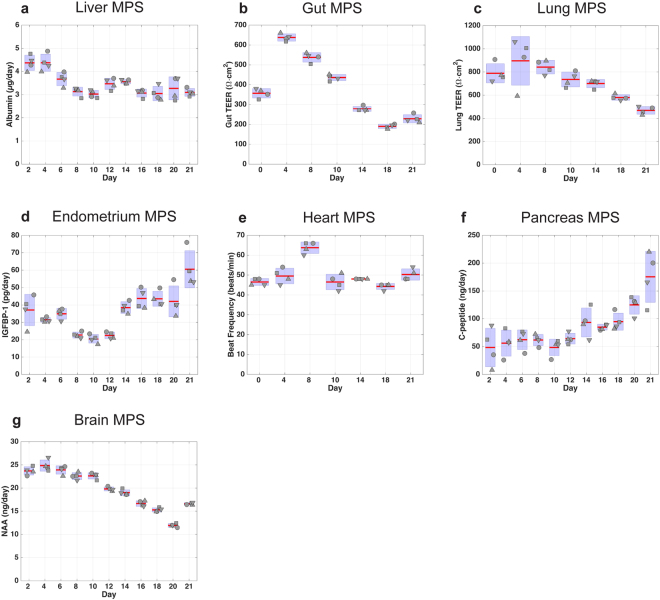
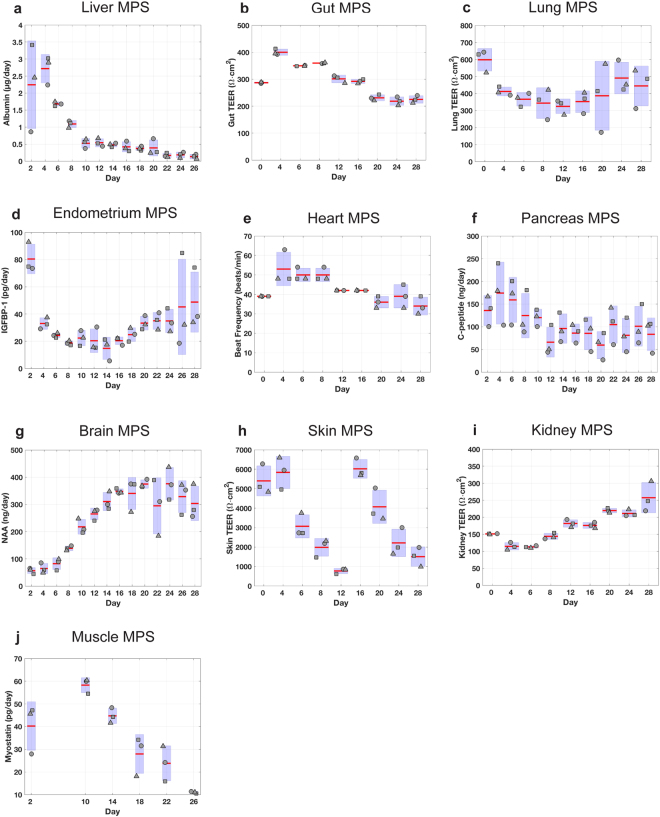
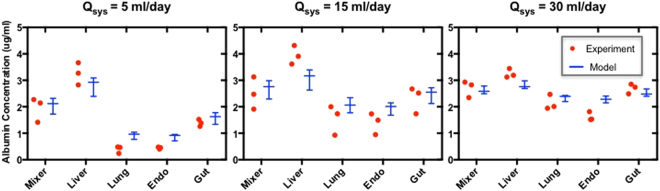
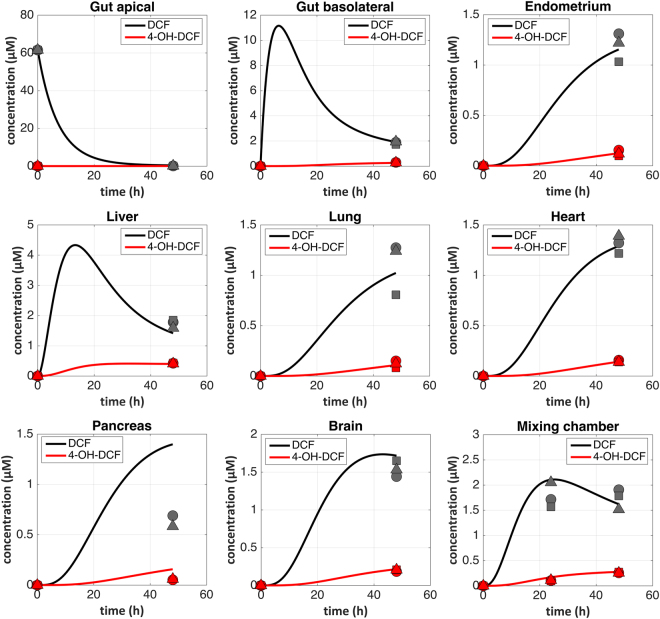
Microphysiological systems (MPSs) are in vitro models that capture facets of in vivo organ function through use of specialized culture microenvironments, including 3D matrices and microperfusion. Here, we report an approach to co-culture multiple different MPSs linked together physiologically on re-useable, open-system microfluidic platforms that are compatible with the quantitative study of a range of compounds, including lipophilic drugs. We describe three different platform designs - "4-way", "7-way", and "10-way" - each accommodating a mixing chamber and up to 4, 7, or 10 MPSs. Platforms accommodate multiple different MPS flow configurations, each with internal re-circulation to enhance molecular exchange, and feature on-board pneumatically-driven pumps with independently programmable flow rates to provide precise control over both intra- and inter-MPS flow partitioning and drug distribution. We first developed a 4-MPS system, showing accurate prediction of secreted liver protein distribution and 2-week maintenance of phenotypic markers. We then developed 7-MPS and 10-MPS platforms, demonstrating reliable, robust operation and maintenance of MPS phenotypic function for 3 weeks (7-way) and 4 weeks (10-way) of continuous interaction, as well as PK analysis of diclofenac metabolism. This study illustrates several generalizable design and operational principles for implementing multi-MPS "physiome-on-a-chip" approaches in drug discovery.


Conflict of interest statement

David Hughes is an employee of CN BioInnovations, the commercial vendor for the Liverchip®. Linda Griffith and Steve Tannenbaum receive patent royalties from the Liverchip®.

Figures

Figure 1
Figure 1
Schematic overview of Physiome-on-a-chip approach. The Physiome-on-a-Chip comprises bioengineered devices that nurture many interconnected 3D MPSs representing specified functional behaviors of each organ of interest, designed to capture essential features of in vivo physiology based on quantitative systems models tailored for individual applications such as drug fate or disease modeling. By interconnecting MPSs, dynamic multi-organ signaling can be recreated naturally through cytokine and hormone circulation, cell trafficking, and metabolic byproducts. Multi-MPS systems bridge the complexity gap between traditional in-vitro cell culture, animal models, and human patient samples, potentially providing better prediction of human responses at lower financial and ethical costs as compared to current methods of drug development. Illustration by Victor O. Leshyk.
Figure 2
Figure 2
MPS platforms and their flow partitioning. Exploded rendering of the 7-MPS platform (a) and corresponding flow partitioning for the 7-way platform (b). Rigid plates of polysulfone (yellow) and acrylic (clear) sandwich an elastomeric polyurethane membrane to form a pumping manifold with integrated fluid channels (See Fig. S2 for pump details). Channels interface to the top side of the polysulfone plate (yellow) to deliver fluid to each MPS compartment in a defined manner. Fluid return occurs passively via spillway channels machined into the top plate (See Fig. S2 for details). Flow partitioning mirrors physiological cardiac output for the 4-way (b), 7-way (c) and 10-way (d) platforms. Renderings for the 4-way and 10-way platforms are shown in Fig. S1.
Figure 3
Figure 3
Assessment of MPS functionality in 4-MPS platform. Metrics of tissue function measured during a 2-week co-culture of 4 different MPSs. MPS representing liver, gut, lung, and endometrium were linked using the platform and flow scheme and partitioning shown in Fig. 2. Samples collected from each platform compartment were used to measure protein and metabolite concentrations, which were in turn used to calculate production rates via computational PBPK models. Albumin secretion rates were used as an indicator of liver function (a). Barrier functions of gut (b) and lung (c) MPSs were assessed with TEER measurements. Endometrium MPS functionality was characterized with IGFBP-1 secretion rate to its apical medium (d). Compartment and system volumes are in Table S1. The systemic exchange flow rate Qsys was 5 mL/day.
Figure 4
Figure 4
Assessment of MPS functionality in 7-MPS platform. Metrics of tissue function measured for 3-week co-culture of 7 different MPS. MPS representing liver, gut, lung, endometrium, heart, pancreas, and brain were interconnected using the platform, and flow scheme and partitioning shown in Fig. 2 with system and individual compartment volumes indicated in Table S1. Samples collected from each platform compartment were used to measure protein and metabolite concentrations, which were in turn used to calculate production rates via computational PBPK models. Albumin secretion rates were used as an indicator of liver function (a). Barrier functions of gut (b) and lung (c) MPSs were assessed with TEER measurements. Endometrium MPS functionality was characterized with IGFBP-1 secretion rate (d) to its apical medium. Heart MPS function was evaluated with beat frequency (e). C-peptide production rates (f) represented pancreas function. N-acetyl aspartate (NAA) concentrations (g) in the apical brain MPS indicated brain MPS functionality. The systemic exchange flow rate Qsys was 10 mL/day.
Figure 5
Figure 5
Assessment of MPS functionality in 10-MPS platform. Metrics of tissue function measured for 4-week co-culture of 10 different MPS. MPS representing liver, gut, lung, endometrium, heart, pancreas, brain, skin, kidney, and skeletal muscle were interconnected using the platform, and flow scheme and partitioning shown in Fig. 2 with system and individual compartment volumes indicated in Table S1. Samples collected from each platform compartment were used to measure protein and metabolite concentrations, which were in turn used to calculate production rates via computational PBPK models. Albumin secretion rates were used as an indicator of liver function (a). Barrier functions of gut (b) and lung (c) MPSs were assessed with TEER measurements. Endometrium MPS functionality was characterized with IGFBP-1 secretion rate (d) to its apical medium. Heart MPS function was evaluated with beat frequency (e). C-peptide production rates (f) represented pancreas function. N-acetyl aspartate (NAA) concentrations (g) in the apical brain MPS indicated brain MPS functionality. Barrier functions of skin (h) and kidney (i) MPSs were assessed with TEER measurements. Myostatin secretion was used as an indicator of skeletal muscle function (j). The system exchange flow rate Qsys was 20 mL/day.
Figure 6
Figure 6
Escalation of systemic flow rate in 4-MPS platform enhances molecular exchange between MPSs without apparent alteration of MPS functionality. Measurements of the concentration of human serum albumin (produced by the liver MPS; red dots) and QSP model fits to the experimental data (Whisker plot indicating median, min-max values) for the mixer and for each individual MPS (liver, lung, endometrium, and gut) for baseline systemic flow rate Qsys = 5 ml/day (left panel) and increased systemic flow rates of Qsys = 15 ml/day (middle panel) and Qsys = 30 ml/day (right panel). The total production rate of albumin is not affected by the flow escalation.
Figure 7
Figure 7
Quantification of diclofenac pharmacokinetics in 7-MPS platform. Samples for diclofenac (DCF) PK were collected from each compartment and quantified for parent drug (DCF, black symbols) and its primary metabolite (4-OH-DCF, red symbols). Individual points represent measurements from different platforms. The results were analyzed with PBPK models, illustrated by solid curves spanning the 48-hour experimental duration.

References

    1. Mak I, Evaniew N, M G. Lost in translation: animal models and clinical trials in cancer treatment. Am J Transl Res. 2014;6:114–118. - PMC - PubMed
    1. Waring MJ, et al. An analysis of the attrition of drug candidates from four major pharmaceutical companies. Nat Rev Drug Discov. 2015;14:475–486. doi: 10.1038/nrd4609. - DOI - PubMed
    1. Causes of clinical failures vary widely by therapeutic class, phase of study (Tufts CSDD Impact Report, 2013).
    1. Cook D, et al. Lessons learned from the fate of AstraZeneca’s drug pipeline: a five-dimensional framework. Nat Rev Drug Discov. 2014;13:419–431. doi: 10.1038/nrd4309. - DOI - PubMed
    1. Stokes, C. L., Cirit, M. & Lauffenburger, D. A. Physiome-on-a-Chip: The Challenge of “Scaling” in Design, Operation, and Translation of Microphysiological Systems. CPT: Pharmacometrics & Systems Pharmacology, n/a–n/a, 10.1002/psp4.12042 (2015). - PMC - PubMed

Publication types