

Double agents: genes with both oncogenic and tumor-suppressor functions
- PMID: 29540752
- PMCID: PMC5852963
- DOI: 10.1038/s41389-018-0034-x
Double agents: genes with both oncogenic and tumor-suppressor functions
Abstract
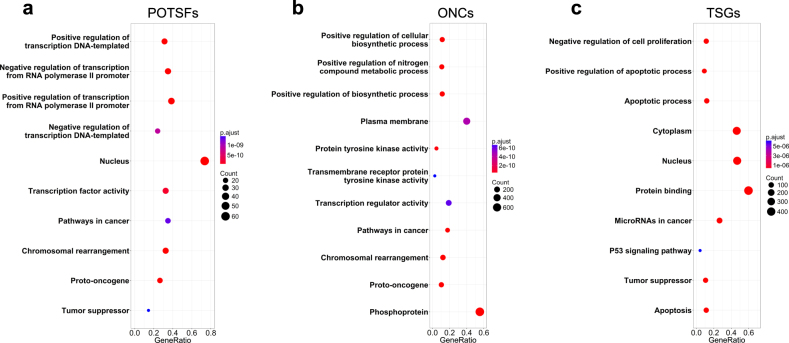
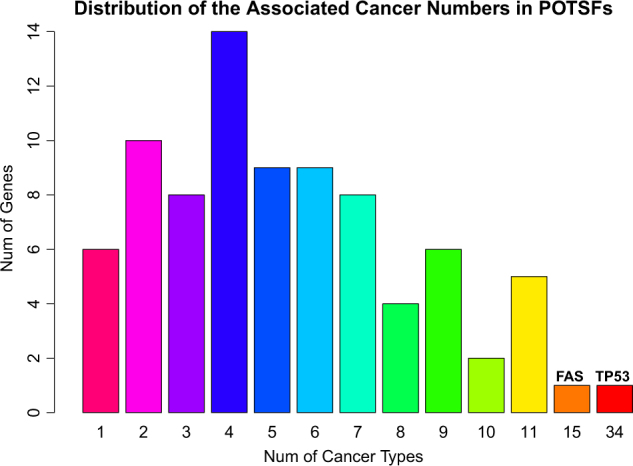
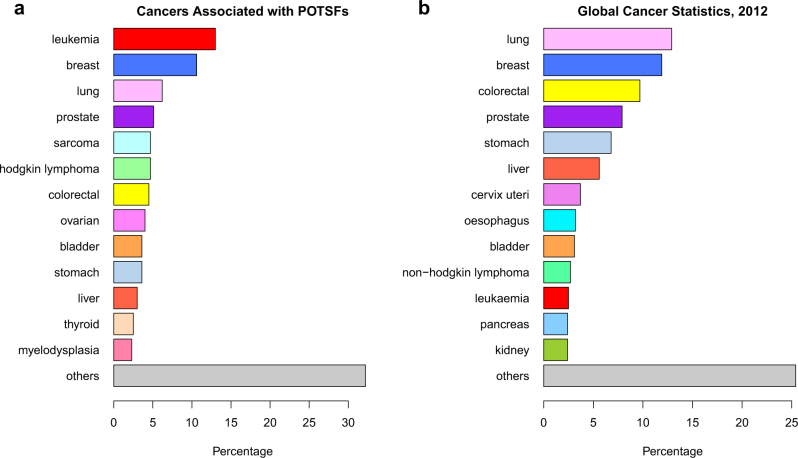
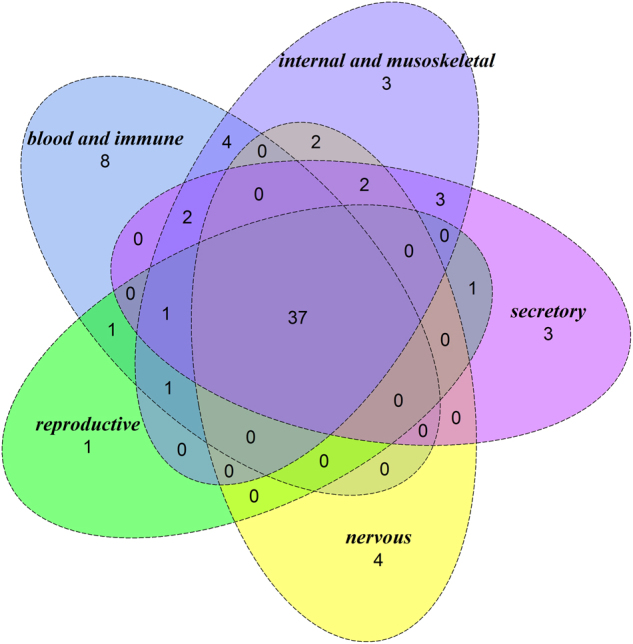
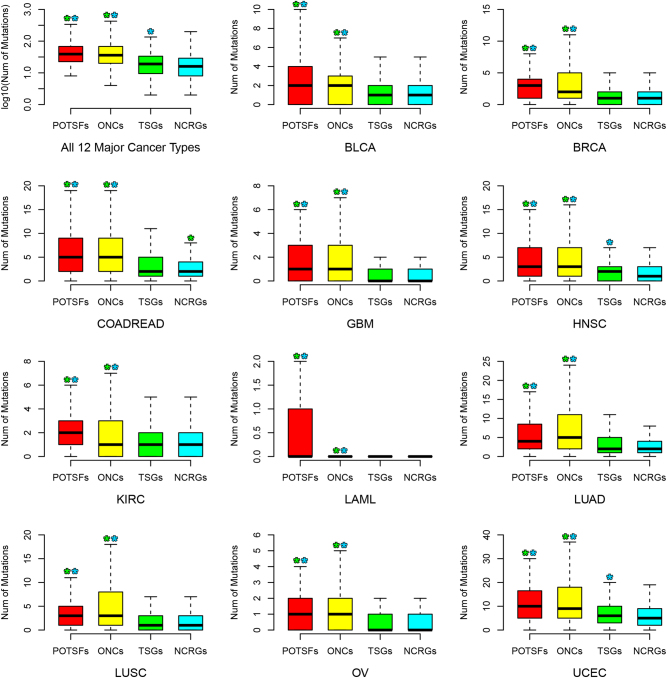
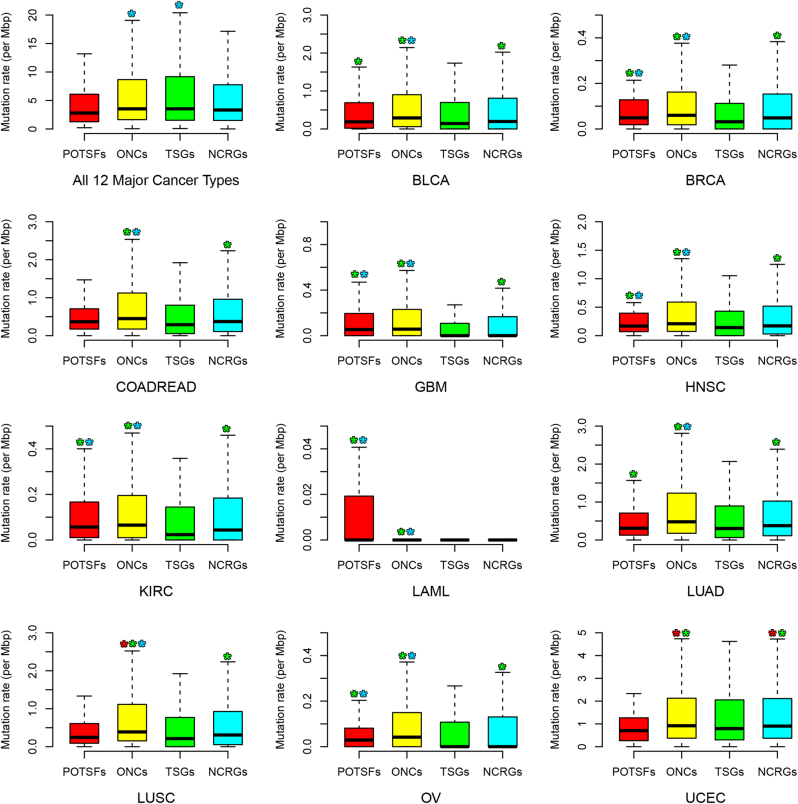
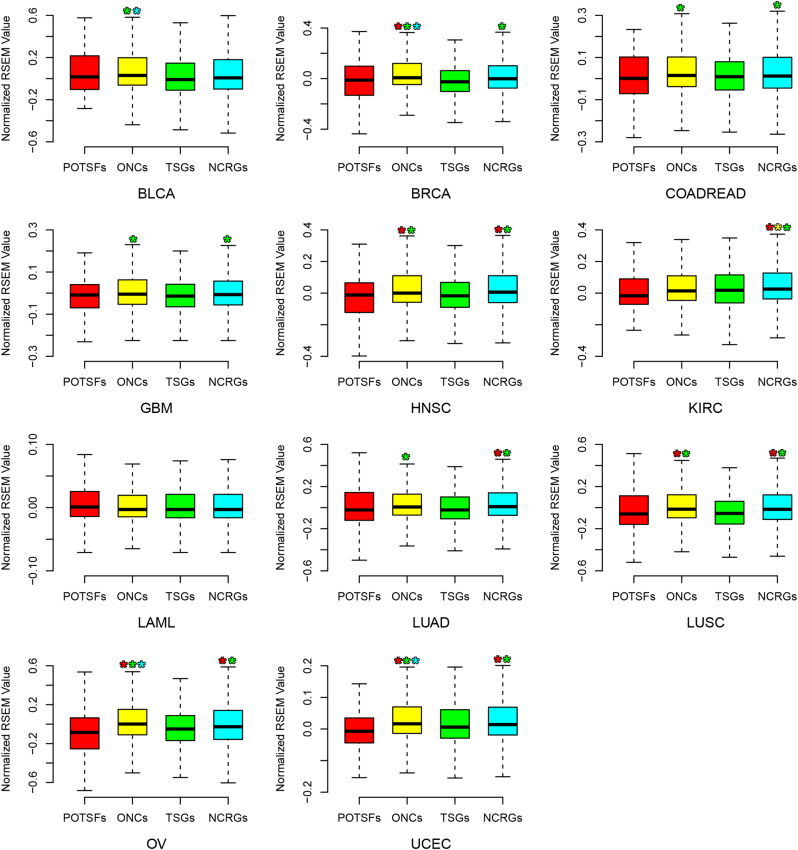
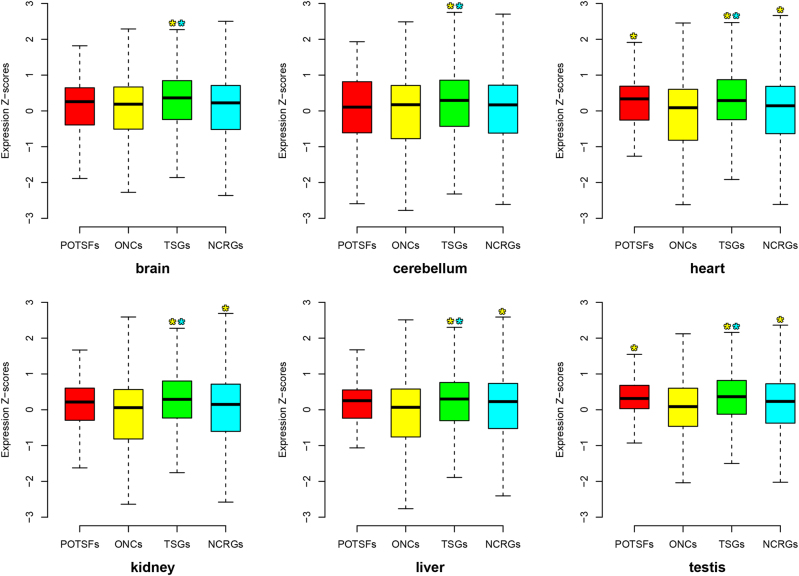
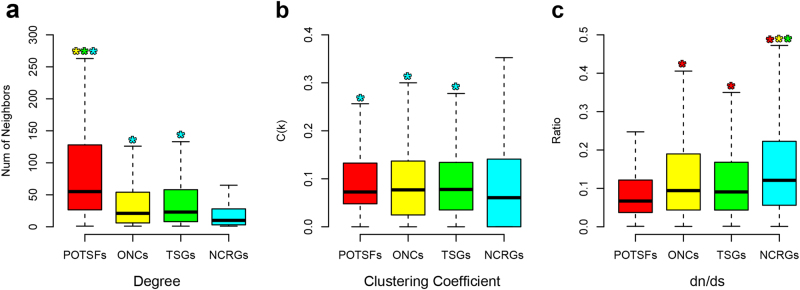
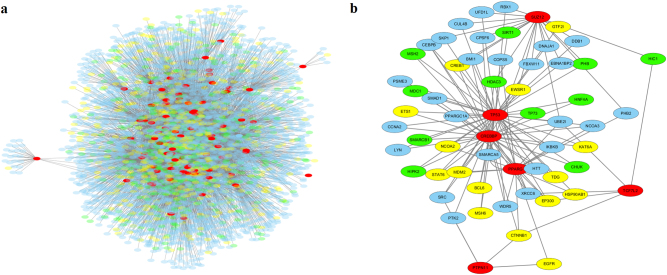
The role of genetic components in cancer development is an area of interest for cancer biologists in general. Intriguingly, some genes have both oncogenic and tumor-suppressor functions. In this study, we systematically identified these genes through database search and text mining. We find that most of them are transcription factors or kinases and exhibit dual biological functions, e.g., that they both positively and negatively regulate transcription in cells. Some cancer types such as leukemia are over-represented by them, whereas some common cancer types such as lung cancer are under-represented by them. Across 12 major cancer types, while their genomic mutation patterns are similar to that of oncogenes, their expression patterns are more similar to that of tumor-suppressor genes. Their expression profile in six human organs propose that they mainly function as tumor suppressor in normal tissue. Our network analyses further show they have higher network degrees than both oncogenes and tumor-suppressor genes and thus tend to be the hub genes in the protein-protein interaction network. Our mutation, expression spectrum, and network analyses might help explain why some cancer types are specifically associated with them. Finally, our results suggest that the functionally altering mutations in "double-agent" genes and oncogenes are the main driving force in cancer development, because non-silent mutations are biasedly distributed toward these two gene sets across all 12 major cancer types.
Conflict of interest statement
The authors declare that they have no conflict of interest.
Figures
Similar articles
-
Oncogenes and tumor suppressor genes: comparative genomics and network perspectives.BMC Genomics. 2015;16 Suppl 7(Suppl 7):S8. doi: 10.1186/1471-2164-16-S7-S8. Epub 2015 Jun 11. BMC Genomics. 2015. PMID: 26099335 Free PMC article.
-
Machine Learning Classification and Structure-Functional Analysis of Cancer Mutations Reveal Unique Dynamic and Network Signatures of Driver Sites in Oncogenes and Tumor Suppressor Genes.J Chem Inf Model. 2018 Oct 22;58(10):2131-2150. doi: 10.1021/acs.jcim.8b00414. Epub 2018 Oct 3. J Chem Inf Model. 2018. PMID: 30253099
-
Activated oncogenes and putative tumor suppressor genes involved in human breast cancers.Cancer Treat Res. 1992;63:15-60. doi: 10.1007/978-1-4615-3088-6_2. Cancer Treat Res. 1992. PMID: 1363356 Review.
-
Suppressor genes in breast cancer: an overview.Cancer Treat Res. 1992;61:45-57. doi: 10.1007/978-1-4615-3500-3_3. Cancer Treat Res. 1992. PMID: 1360244 Review.
-
Recessive oncogenes.Cancer. 1993 Feb 1;71(3 Suppl):1179-86. doi: 10.1002/1097-0142(19930201)71:3+<1179::aid-cncr2820711442>3.0.co;2-b. Cancer. 1993. PMID: 8428341
Cited by
-
Advances in predicting breast cancer driver mutations: Tools for precision oncology (Review).Int J Mol Med. 2025 Jan;55(1):6. doi: 10.3892/ijmm.2024.5447. Epub 2024 Oct 25. Int J Mol Med. 2025. PMID: 39450552 Free PMC article. Review.
-
Neoantigens and their potential applications in tumor immunotherapy.Oncol Lett. 2022 Mar;23(3):88. doi: 10.3892/ol.2022.13208. Epub 2022 Jan 21. Oncol Lett. 2022. PMID: 35126730 Free PMC article. Review.
-
Genetic Suppressor Element 1 (GSE1) Promotes the Oncogenic and Recurrent Phenotypes of Castration-Resistant Prostate Cancer by Targeting Tumor-Associated Calcium Signal Transducer 2 (TACSTD2).Cancers (Basel). 2021 Aug 5;13(16):3959. doi: 10.3390/cancers13163959. Cancers (Basel). 2021. PMID: 34439112 Free PMC article.
-
Re-evaluation of the relationship between PrPc expression and patient prognosis in primary esophageal squamous cell carcinoma and primary hepatocellular carcinoma.Sci Rep. 2024 Dec 28;14(1):31122. doi: 10.1038/s41598-024-82398-4. Sci Rep. 2024. PMID: 39732816 Free PMC article.
-
Prediction of cancer driver genes and mutations: the potential of integrative computational frameworks.Brief Bioinform. 2024 Jan 22;25(2):bbad519. doi: 10.1093/bib/bbad519. Brief Bioinform. 2024. PMID: 38261338 Free PMC article. Review.
References
-
- Cancer: the evolutionary legacy. Nat. Med. 6, 496 (2000). - PubMed
LinkOut - more resources
Full Text Sources
Other Literature Sources
