. 2018 Mar 14;9(1):1074.
doi: 10.1038/s41467-018-03473-9.

Chemo-photothermal therapy combination elicits anti-tumor immunity against advanced metastatic cancer

Affiliations

Chemo-photothermal therapy combination elicits anti-tumor immunity against advanced metastatic cancer

Jutaek Nam et al. Nat Commun. .

Abstract

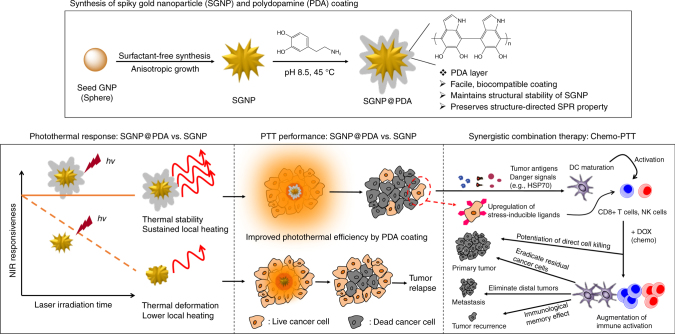
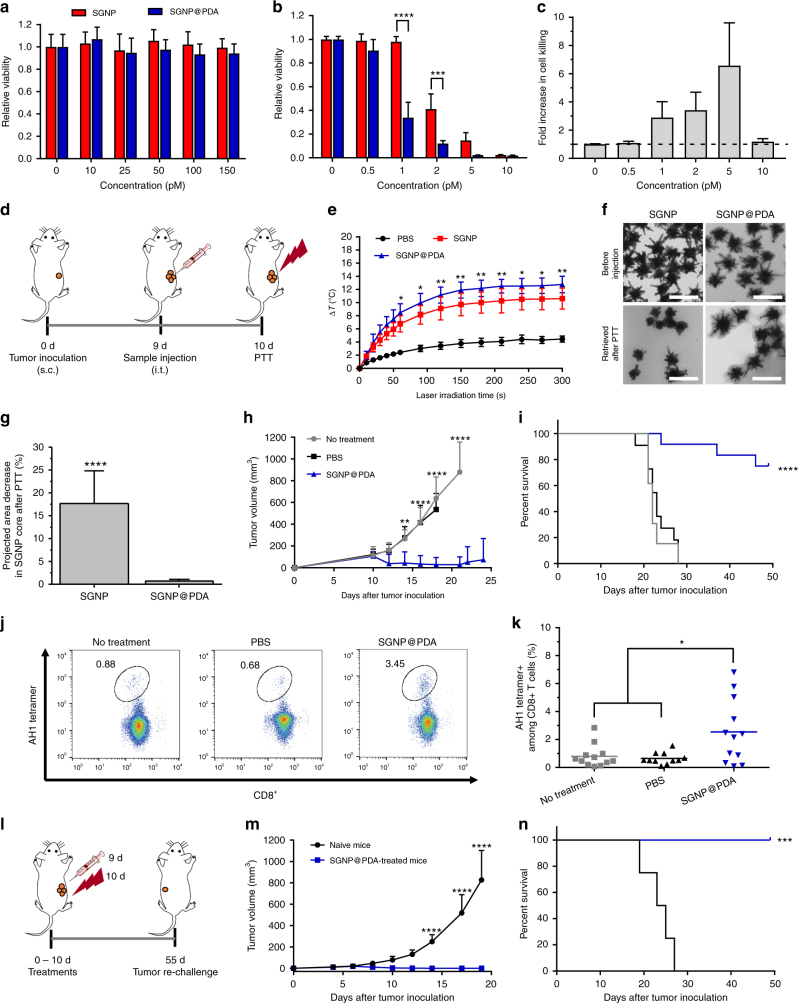
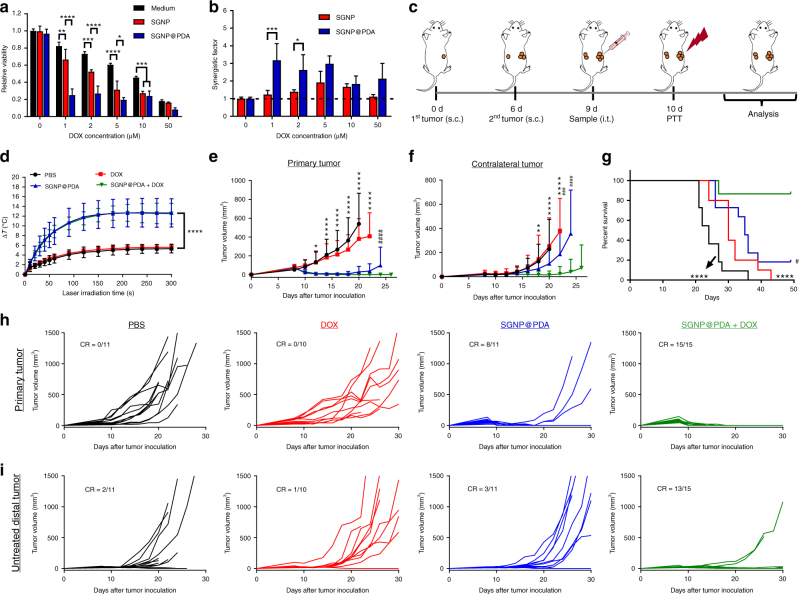
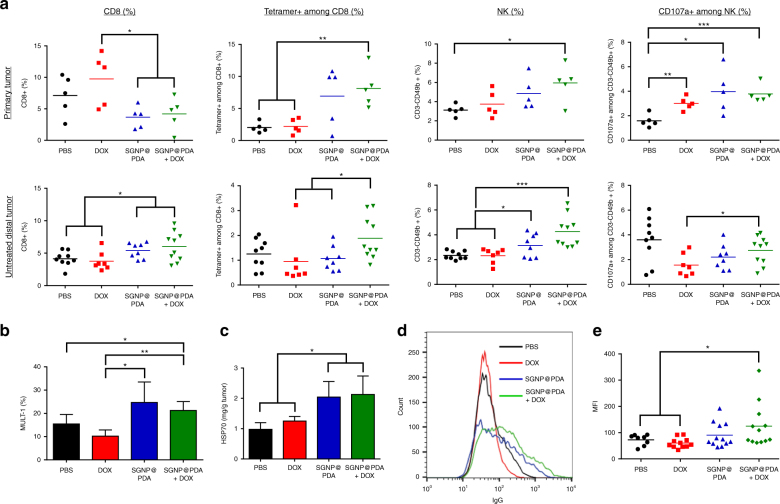
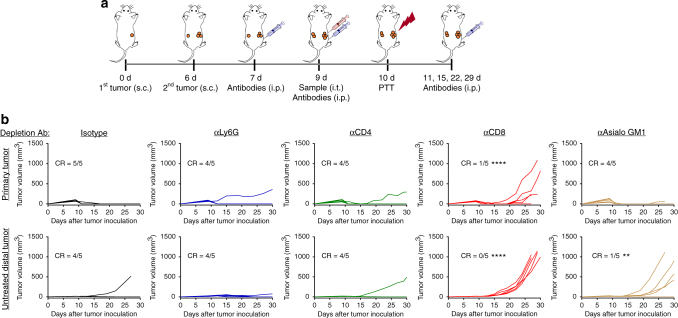
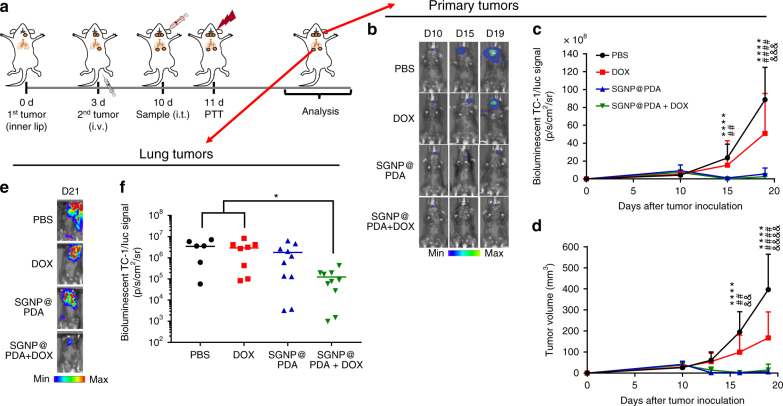
Photothermal therapy (PTT) is a promising cancer treatment modality, but PTT generally requires direct access to the source of light irradiation, thus precluding its utility against disseminated, metastatic tumors. Here, we demonstrate that PTT combined with chemotherapy can trigger potent anti-tumor immunity against disseminated tumors. Specifically, we have developed polydopamine-coated spiky gold nanoparticles as a new photothermal agent with extensive photothermal stability and efficiency. Strikingly, a single round of PTT combined with a sub-therapeutic dose of doxorubicin can elicit robust anti-tumor immune responses and eliminate local as well as untreated, distant tumors in >85% of animals bearing CT26 colon carcinoma. We also demonstrate their therapeutic efficacy against TC-1 submucosa-lung metastasis, a highly aggressive model for advanced head and neck squamous cell carcinoma (HNSCC). Our study sheds new light on a previously unrecognized, immunological facet of chemo-photothermal therapy and may lead to new therapeutic strategies against advanced cancer.


Conflict of interest statement

The authors declare no competing interests.

Figures

Fig. 1
Fig. 1
The schematic illustration shows the development of spiky gold nanoparticles (SGNPs) coated with PDA (SGNP@PDA) as a new photothermal agent with extensive photothermal stability and efficiency. The combination chemo-photothermal therapy triggered potent anti-tumor immunity in vivo and exerted strong anti-tumor efficacy against local primary tumors and untreated, distal tumors, while simultaneously establishing long-term immunity against tumor recurrence
Fig. 2
Fig. 2
Synthesis and characterization of SGNPs and SGNP@PDAs. ac Shown are the absorption spectra (a), TEM images (b), and correlation between the concentration of seed NPs and either the effective diameter or absorption peak wavelength (c) of SGNPs. df Shown are the absorption spectra (d), changes in 283 nm absorbance (e), and shift in the peak wavelength (f) of SGNP@PDAs depending on the concentration of dopamine. SGNP with 775 nm absorption peak was prepared on a large scale and employed for PDA coating study. The number followed by PDA denotes the concentration of dopamine (mg/ml). g, h TEM images of SGNP@PDAs (g), and their hydrodynamic size and zeta potential (h). i, j Effective diameters of SGNP with or without the PDA shell (i) and thickness of the PDA shell (j) determined by analyzing the projected areas of NPs in g. Scale bars are 100 nm. The data show mean ± s.d., representative from 2–3 independent experiments. More than 100 particles were counted for TEM analyses shown in c, i, and j
Fig. 3
Fig. 3
Improved photothermal efficiency of SGNP@PDA. a, b Absorption spectra of SGNP (a) and SGNP@PDA-0.05 (b) after 808 nm laser irradiation at 0 (no irradiation), 1, 3, 5, 10 W/cm2 for 30 min. c Blue-shift of the absorption peak wavelength for SGNP and SGNP@PDAs after laser irradiation. d Representative TEM images of SGNP, SGNP@PDA-0.05, SGNP@PDA-0.3 before (0 W/cm2) and after 10 W/cm2 laser irradiation. Scale bars are 100 nm. e, f Quantitative analysis of TEM images for the decrease in the SGNP core area (e) and thickness of the PDA layer before (0 W/cm2) and after 10 W/cm2 laser irradiation (f). gh Relative changes in 808 nm absorbance of SGNP and SGNP@PDAs (g) and the increase in temperature after laser irradiation at varying laser power (h). i Relationship between absorbance blue-shift and temperature increase calculated by subtracting the values of SGNP from that of SGNP@PDA-0.05. The data show mean ± s.d., representative from 2–3 independent experiments (n = 3). More than 100 particles were counted for TEM analysis shown in e, f. **P < 0.01, ****P < 0.0001, analyzed by one-way ANOVA (e) or two-way ANOVA (h) with Bonferroni multiple comparison post-test. Asterisks indicate statistically significant differences between SGNP vs. all other SGNP@PDA groups
Fig. 4
Fig. 4
Potent therapeutic efficacy and anti-tumor T-cell responses achieved by PTT with SGNP@PDA. a, b Viability of CT26 colon carcinoma cells in vitro after treatment with varying concentrations of SGNP or SGNP@PDA, followed by 24 h incubation in dark (a) or laser irradiation at 10 W/cm2 for 5 min and further 24 h incubation (b). c Fold increase in cell killing by SGNP@PDA compared with SGNP. dg Shown are the schematic illustration of the PTT regimen (d), temperature increase in tumors during laser irradiation at 1 W/cm2 for 5 min (e), TEM images of SGNP and SGNP@PDA before injection or after retrieval from tumors in vivo post PTT (f), and quantitative analysis of a decrease in SGNP core area from TEM images in f (g). h, i Tumor growth (h) and Kaplan–Meier survival curve (i) of CT26 tumor-bearing mice without any treatment or after laser irradiation post administration of PBS or 100 fmol of SGNP@PDA. j, k Representative scatter plots (j) and frequency (k) of AH1-specific CD8+ T cells in peripheral blood mononuclear cells, measured by flow cytometry after 7 days post laser irradiation. ln Schematic of the PTT regimen (l), tumor growth (m), and Kaplan–Meier survival curve (n) of animals for the tumor re-challenge study. The data show mean ± s.d., representative from 2–3 independent experiments; n = 3 (a, b), n = 5 (eg), n = 11–13 (hn). *P < 0.05, **P < 0.01, ***P < 0.001, and ****P < 0.0001, analyzed by two-way ANOVA (b, e, h, m) or one-way ANOVA (k) with Bonferroni multiple comparisons post-test; unpaired two-tailed t-test (g); or log-rank (Mantel–Cox) test (i, n). Asterisks indicate statistically significant differences between SGNP@PDA vs. SGNP (e); between SGNP@PDA vs. no treatment (h); and between SGNP@PDA vs. all other groups (i)
Fig. 5
Fig. 5
Combination chemo-photothermal therapy exerts potent anti-tumor efficacy against local and disseminated tumors. a Viability of CT26 cells after co-treatment of varying concentrations of DOX with 0.5 pM of SGNP or SGNP@PDA followed by laser irradiation at 10 W/cm2 for 5 min and further 24 h incubation. “Medium” indicates DOX treatment alone. b Synergistic factor of combination therapy calculated based on the viability in a. c, d Schematic for the combination therapy in a bilateral tumor model (c), temperature increase in the primary tumor during 5 min laser irradiation at 1 W/cm2 (d). ei Shown are the average tumor growth (e, f) and individual tumor growth (h, i) of the treated primary tumors (e, h) and untreated contralateral tumors (f, i) with fraction of complete tumor regression (CR), and the overall Kaplan–Meier survival curves (g). The data show mean ± s.d. from a representative experiment from 2–3 independent experiments; n = 3 (a, b), n = 5 (d), n = 10–15 (ei). *P < 0.05, ***P < 0.001, and ****P < 0.0001, analyzed by two-way ANOVA (a, b, d, e, f, g), followed by Bonferroni multiple comparisons post-test; or log-rank (Mantel–Cox) test (g); * in d, e, f, g indicates statistically significant differences between SGNP@PDA + DOX vs. PBS or DOX; # in e, f, g indicates statistically significant differences between SGNP@PDA + DOX vs. SGNP@PDA
Fig. 6
Fig. 6
Systemic and local anti-tumor immunity triggered by chemo-photothermal therapy. Bilateral tumor model was established using CT26 cells and treated as in Fig. 5c. a Frequencies of CD8+ T cells, AH1-specific CD8+ T cells, NK cells, and CD107a+ NK cells were measured among tumor-infiltrating lymphocytes in primary and contralateral tumors on day 17 (7 days post PTT). b Percent of MULT-1-positive cells in the tumor was analyzed by flow cytometry. c Intratumoral concentration of HSP70 was measured by ELISA. d, e Representative histogram plot (d) and mean fluorescence intensity (MFI) (e) of CT26 cell-binding sera IgG collected and analyzed after 20 days of PTT. The data show mean ± s.d., representative from 2–3 independent experiments; n = 5–10 (ac), n = 8–12 (e); *P < 0.05, **P < 0.01, and ***P < 0.001, analyzed by one-away ANOVA, followed by Bonferroni multiple comparisons post-test
Fig. 7
Fig. 7
Anti-tumor efficacy of chemo-photothermal therapy mediated by different immune compartments. a Bilateral tumor model was established using CT26 cells, and tumor-bearing mice were intraperitoneally injected with depletion antibodies during and post PTT with SGNP@PDA + DOX. b Shown are individual tumor growth curves with the fraction of complete tumor regression (CR) for the mice treated with antibodies targeted against neutrophils (αLy6G), CD4+ T cells (αCD4), CD8+ T cells (αCD8), and NK cells (αAsialo GM1). Isotype antibody was used as a control group. **P < 0.01 and ****P < 0.0001, analyzed by two-way ANOVA with Bonferroni multiple comparisons post-test in comparison with isotype control. Asterisks indicate statistical differences from the isotype control group
Fig. 8
Fig. 8
Therapeutic efficacy of chemo-photothermal therapy against advanced head and neck squamous cell carcinoma. a Schematic for the TC-1 submucosa-lung metastasis model and the treatment regimen. bd Growth of TC-1/luc lip tumors were visualized using IVIS (b) and quantified by either the bioluminescence signal (c) or direct measurements of the tumor volume (d). e Representative in vivo bioluminescence images of TC-1/luc lung tumors visualized on day 21 with IVIS after shielding the primary lip tumors with a piece of black paper, and f the corresponding intensity of the bioluminescence signal. The data show mean ± s.d. with n = 6–10. *P < 0.05, **P < 0.01, ***P < 0.001, and ****P < 0.0001, analyzed by two-way ANOVA (c, d) or one-way ANOVA (f) with Bonferroni multiple comparisons post-test. *, #, & in c, d indicate statistically significant differences between PBS vs. SGNP@PDA (± DOX) (∗); DOX vs. SGNP@PDA (± DOX) (#); or PBS vs. DOX (&)

References

    1. Hirsch LR, et al. Nanoshell-mediated near-infrared thermal therapy of tumors under magnetic resonance guidance. Proc. Natl Acad. Sci. USA. 2003;100:13549–13554. doi: 10.1073/pnas.2232479100. - DOI - PMC - PubMed
    1. Chu KF, Dupuy DE. Thermal ablation of tumours: biological mechanisms and advances in therapy. Nat. Rev. Cancer. 2014;14:199–208. doi: 10.1038/nrc3672. - DOI - PubMed
    1. Hwang S, et al. Gold nanoparticle-mediated photothermal therapy: current status and future perspective. Nanomedicine. 2014;9:2003–2022. doi: 10.2217/nnm.14.147. - DOI - PubMed
    1. Hauck TS, Jennings TL, Yatsenko T, Kumaradas JC, Chan WCW. Enhancing the toxicity of cancer chemotherapeutics with gold nanorod hyperthermia. Adv. Mater. 2008;20:3832–3838. doi: 10.1002/adma.200800921. - DOI
    1. Park H, et al. Multifunctional nanoparticles for combined doxorubicin and photothermal treatments. ACS Nano. 2009;3:2919–2926. doi: 10.1021/nn900215k. - DOI - PubMed

Publication types