. 2018 Mar 14;8(1):4529.
doi: 10.1038/s41598-018-22574-5.

Application of a Genetic Risk Score to Racially Diverse Type 1 Diabetes Populations Demonstrates the Need for Diversity in Risk-Modeling

Affiliations

Application of a Genetic Risk Score to Racially Diverse Type 1 Diabetes Populations Demonstrates the Need for Diversity in Risk-Modeling

Daniel J Perry et al. Sci Rep. .

Abstract

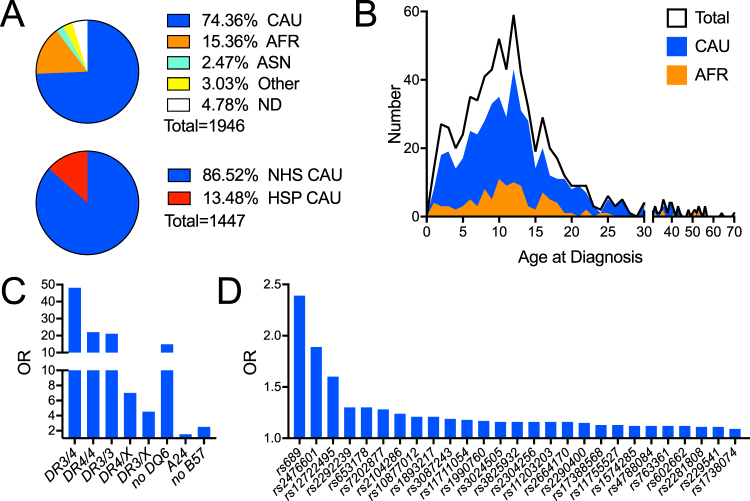
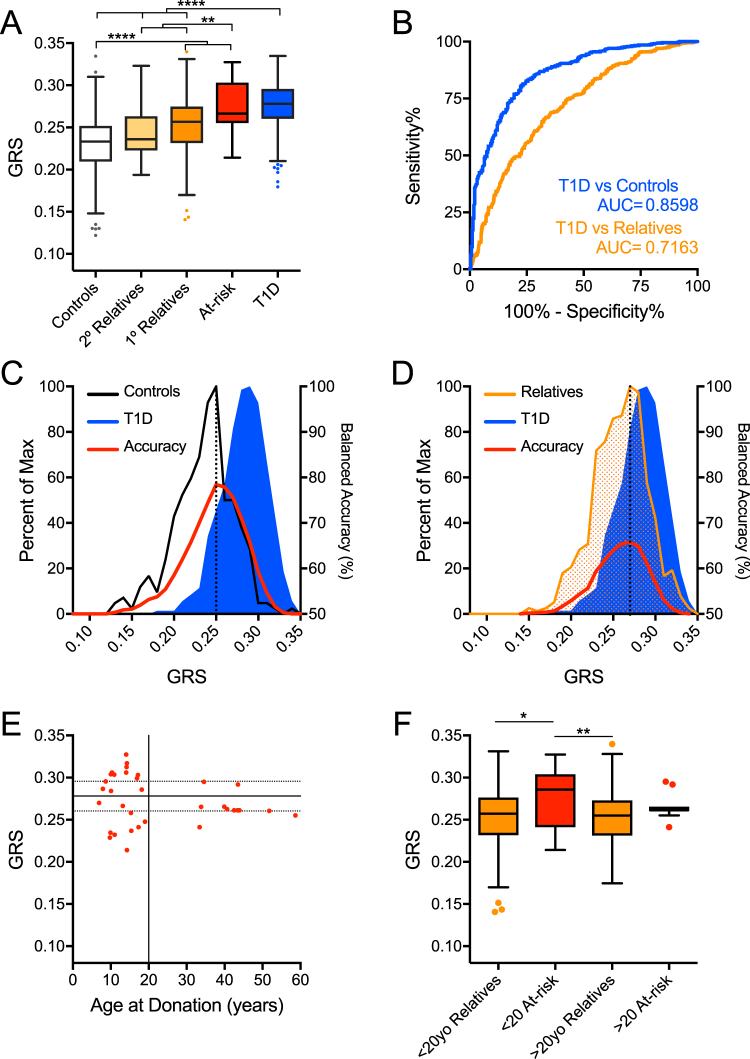
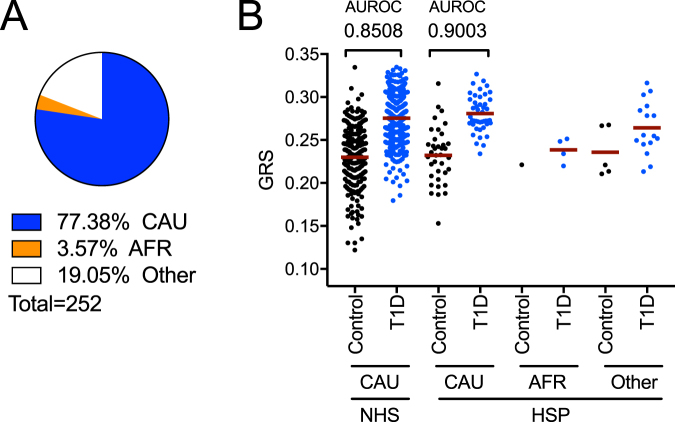
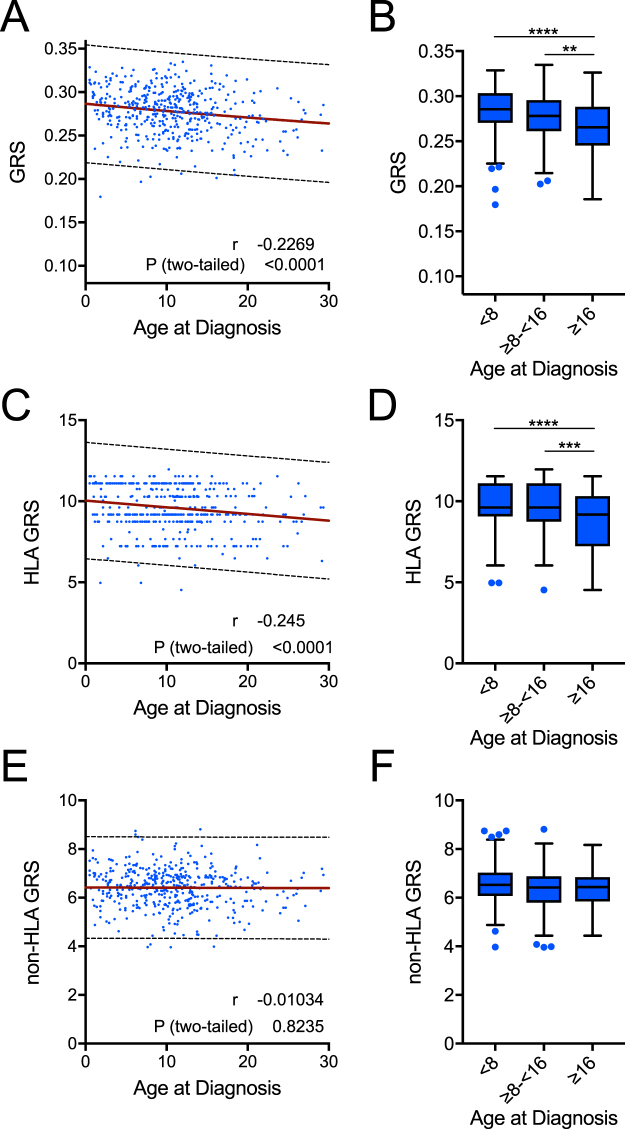
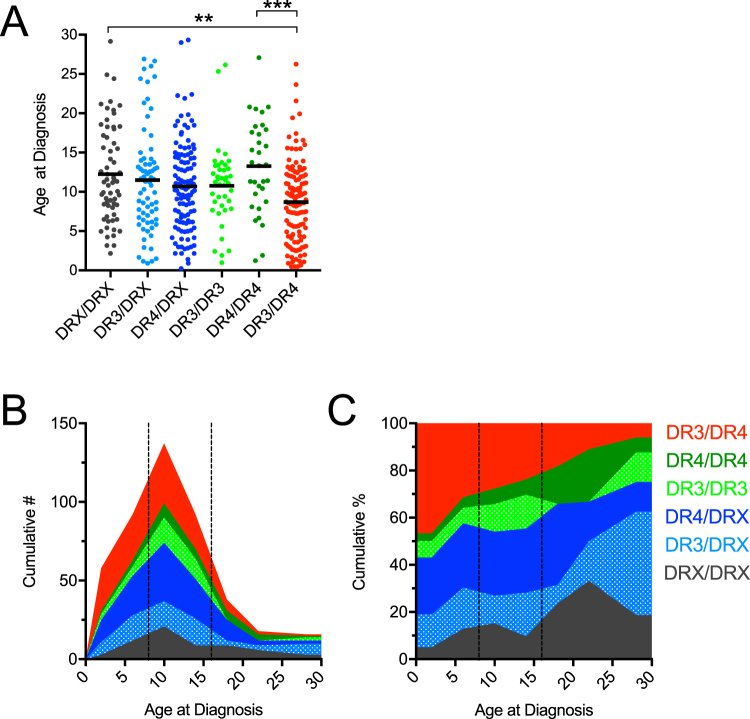
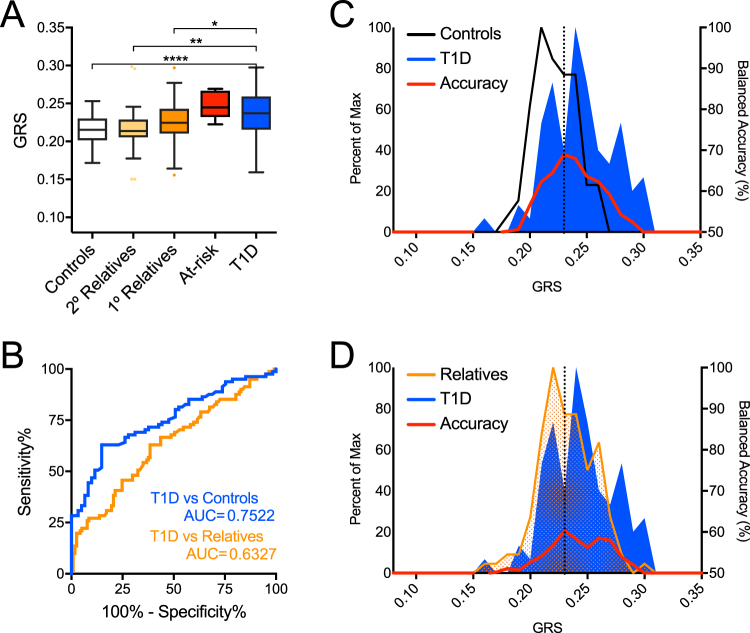
Prior studies identified HLA class-II and 57 additional loci as contributors to genetic susceptibility for type 1 diabetes (T1D). We hypothesized that race and/or ethnicity would be contextually important for evaluating genetic risk markers previously identified from Caucasian/European cohorts. We determined the capacity for a combined genetic risk score (GRS) to discriminate disease-risk subgroups in a racially and ethnically diverse cohort from the southeastern U.S. including 637 T1D patients, 46 at-risk relatives having two or more T1D-related autoantibodies (≥2AAb+), 790 first-degree relatives (≤1AAb+), 68 second-degree relatives (≤1 AAb+), and 405 controls. GRS was higher among Caucasian T1D and at-risk subjects versus ≤ 1AAb+ relatives or controls (P < 0.001). GRS receiver operating characteristic AUC (AUROC) for T1D versus controls was 0.86 (P < 0.001, specificity = 73.9%, sensitivity = 83.3%) among all Caucasian subjects and 0.90 for Hispanic Caucasians (P < 0.001, specificity = 86.5%, sensitivity = 84.4%). Age-at-diagnosis negatively correlated with GRS (P < 0.001) and associated with HLA-DR3/DR4 diplotype. Conversely, GRS was less robust (AUROC = 0.75) and did not correlate with age-of-diagnosis for African Americans. Our findings confirm GRS should be further used in Caucasian populations to assign T1D risk for clinical trials designed for biomarker identification and development of personalized treatment strategies. We also highlight the need to develop a GRS model that accommodates racial diversity.


Conflict of interest statement

The authors declare no competing interests.

Figures

Figure 1
Figure 1
The University of Florida Diabetes Institute (UFDI) cohort demographics and loci used to calculate the Genetic Risk Score (GRS). (A) Top panel- Proportion of Caucasian (CAU), African American (AFR), Asian (ASN), Other (includes 0.26% Native American, 0.26 Pacific Islander, and 2.52% multiple races), and no data/not reported (ND). Bottom panel- Proportion of CAU that also self-reported as Hispanic (HSP) or non-Hispanic (NHS). (B) Age of diagnosis of the total, CAU, and AFR UFDI type 1 diabetes subjects. (C) Odds ratios (OR) for HLA diplotypes (DR3/4, DR4/4, DR3/3, DR4/X, and DR3/X) and haplotypes (non-DQ6, A24, and non-B57) used to compute the GRS. (D) OR for non-HLA loci.
Figure 2
Figure 2
The Genetic Risk Score (GRS) can discriminate Caucasian subjects with type 1 diabetes and high-risk relatives from controls and lower-risk relatives. (A) GRS was significantly higher among Caucasian type 1 diabetes patients (T1D, n = 478) and at-risk relatives (n = 35) compared to controls (n = 290), second-degree relatives (2° Relatives, n = 33), and first-degree relatives (1° Relatives, n = 611). (B) Receiver operating characteristic (ROC) curve shows that the GRS significantly discriminates type 1 diabetes patients from control subjects (T1D vs Controls) with 83.3% sensitivity yielding 73.9% specificity (area under curve (AUC) = 0.8598) and, to a lesser degree, type 1 diabetes patients from first-degree relatives (T1D vs Relatives) with 67.4% sensitivity yielding 65.0% specificity (AUC = 0.7163). (C) Classifying subjects as T1D or control. Peak balanced accuracy was determined to be 78.95% at a GRS of 0.251. (D) Classifying subjects as T1D or relatives. Peak balanced accuracy was 66.70% at a GRS of 0.267. (E) GRS of At-risk subjects (≥2AAb+) vs age at donation. The 75th (upper dotted), 50th (solid), and 25th (lower dotted) centile lines of the T1D GRS are shown for reference. (F) Comparison of GRS of young (<20 years old) At-risk subjects to aged (>20) At-risk, young first-degree relatives, aged first-degree relatives. Kruskal-Wallis ANOVA with Dunn’s posttest *P < 0.05, **P < 0.01, ****P < 0.0001.
Figure 3
Figure 3
GRS assessment of Hispanic ethnicity by race. (A) Proportion of CAU, AFR and Other (multiple or not reported) in subjects that self-reported as Hispanic (HSP) ethnicity. (B) Comparison of HSP ethnicity subjects by race to CAU non-Hispanic (NHS) subjects indicates that GRS discriminates patients from control HSP CAU subjects as well as it does for NHS CAU.
Figure 4
Figure 4
HLA risk imparts a genetic association with age of disease onset. (A) The genetic risk score (GRS) was significantly and inversely correlated with age at diagnosis (linear regression analysis and Pearson correlation coefficient, P < 0.001, r = −0.227). (B) GRS was significantly different in patients when grouped into under 8, 8–16, and over 16 years old at diagnosis (Kruskal-Wallis ANOVA with Dunn’s posttest **P < 0.01, ****P < 0.0001). (C, D) The HLA-only GRS imparted a similar association with age at diagnosis as the full score (C: linear regression analysis and Pearson correlation coefficient, P < 0.001, r = −0.245; D: Kruskal-Wallis ANOVA with Dunn’s posttest *** P < 0.001, ****P < 0.0001). (E, F) The non-HLA GRS did not correlate with age at diagnosis (E: linear regression analysis and Pearson correlation coefficient, P > 0.05, r = −0.010; F: Kruskal-Wallis ANOVA with Dunn’s posttest P > 0.05). The 99% probability bands for linear regressions are depicted as dotted lines.
Figure 5
Figure 5
HLA versus Age at Diagnosis. (A) Patients with the highest risk HLA-DR3/DR4 had a lower age at diagnosis. Kruskal-Wallis ANOVA with Dunn’s posttest **P < 0.01, ***P < 0.001. (B) Stacked histogram depicting the cumulative number of patients grouped by HLA type versus their ages at diagnosis (4 year binned). (C) Stacked histogram depicting the cumulative percent of patients grouped by HLA type versus their ages at diagnosis (4 year binned). (B,C) HLA-type is indicated by color as shown within the figure, and 8-year and 16-year age cutoffs are indicated by dashed lines.
Figure 6
Figure 6
GRS poorly discriminates African American (AFR) subjects with type 1 diabetes and high-risk relatives from controls and lower-risk relatives. (A) GRS was higher among type 1 diabetes patients (T1D, n = 84) and at-risk relatives (n = 6) compared to controls (n = 63), second-degree relatives (2° Relatives, n = 28), and first-degree relatives (1° Relatives, n = 118). Kruskal-Wallis ANOVA with Dunn’s posttest *P < 0.05, **P < 0.01, ****P < 0.0001. (B) Receiver operating characteristic (ROC) curve shows that the GRS discriminates type 1 diabetes patients from control subjects (T1D vs Controls) with 62.96% sensitivity yielding 85.25% specificity (area under curve (AUC) = 0.7522) and type 1 diabetes patients from first-degree relatives (T1D vs Relatives) with 62.96% sensitivity yielding 61.54% specificity (AUC = 0.6327). (C) Classifying subjects as T1D or Control. Peak balanced accuracy was determined to be 68.98% at a GRS of 0.233. (D) Classifying subjects as T1D or relatives. Peak balanced accuracy was 60.39% at a GRS of 0.233.

References

    1. Noble JA. Immunogenetics of type 1 diabetes: A comprehensive review. J Autoimmun. 2015;64:101–112. doi: 10.1016/j.jaut.2015.07.014. - DOI - PubMed
    1. Pociot F, et al. Genetics of type 1 diabetes: what’s next? Diabetes. 2010;59:1561–1571. doi: 10.2337/db10-0076. - DOI - PMC - PubMed
    1. Noble JA, et al. The role of HLA class II genes in insulin-dependent diabetes mellitus: molecular analysis of 180 Caucasian, multiplex families. Am J Hum Genet. 1996;59:1134–1148. - PMC - PubMed
    1. Risch N. Assessing the role of HLA-linked and unlinked determinants of disease. Am J Hum Genet. 1987;40:1–14. - PMC - PubMed
    1. Lambert AP, et al. Absolute risk of childhood-onset type 1 diabetes defined by human leukocyte antigen class II genotype: a population-based study in the United Kingdom. J Clin Endocrinol Metab. 2004;89:4037–4043. doi: 10.1210/jc.2003-032084. - DOI - PubMed

Publication types

MeSH terms