. 2018 Jun;37(23):3113-3130.
doi: 10.1038/s41388-018-0197-0. Epub 2018 Mar 15.

LMTK3 confers chemo-resistance in breast cancer

Affiliations

LMTK3 confers chemo-resistance in breast cancer

Justin Stebbing et al. Oncogene. 2018 Jun.

Abstract

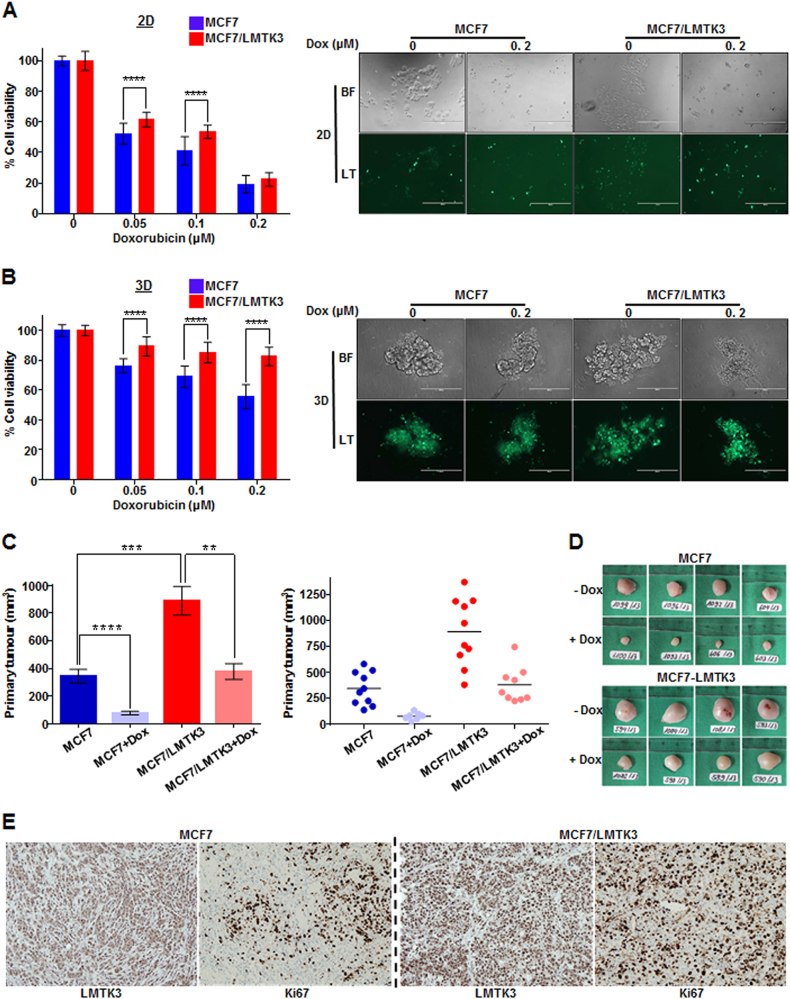
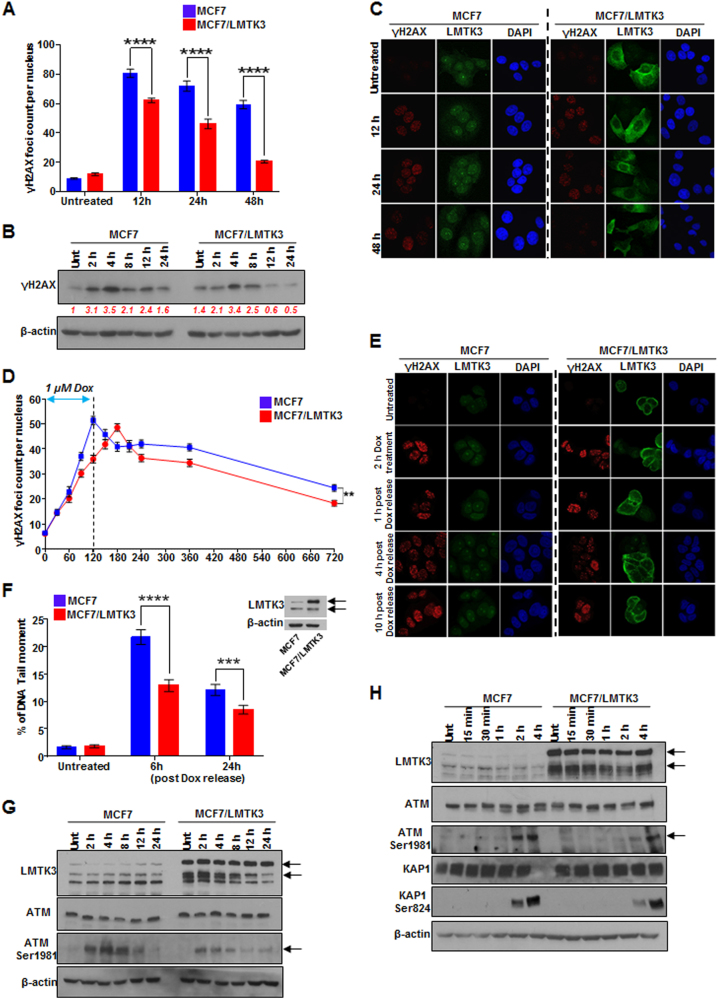
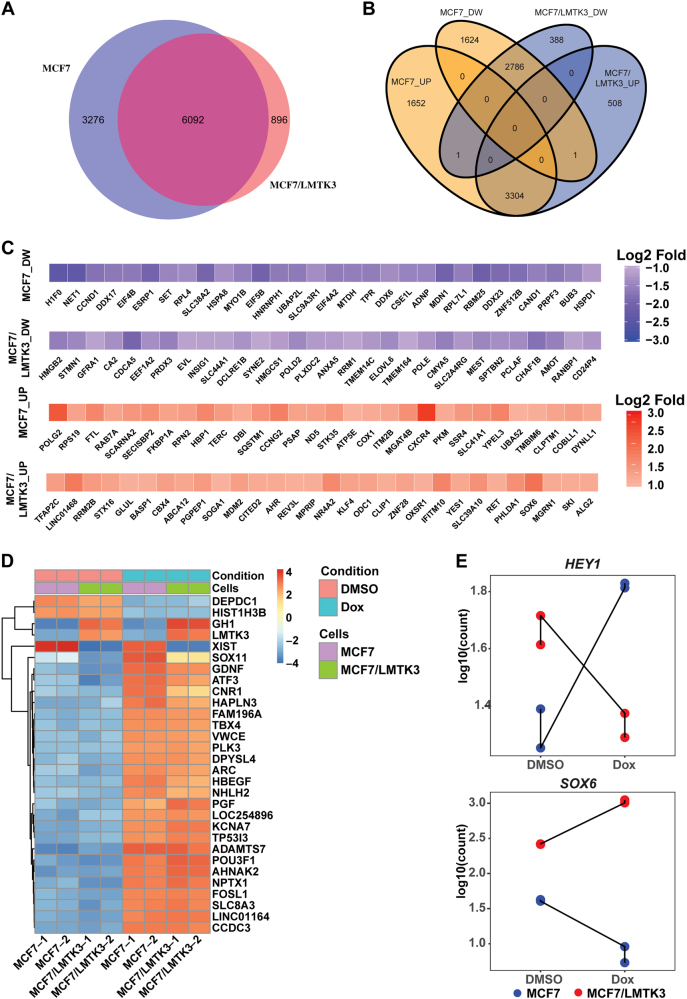
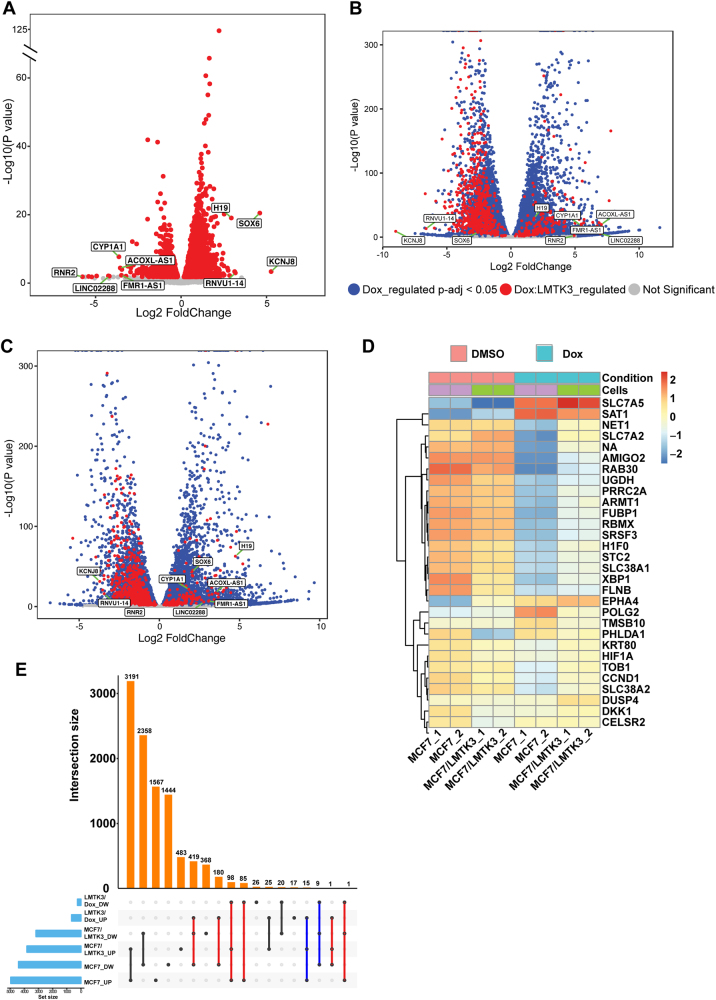
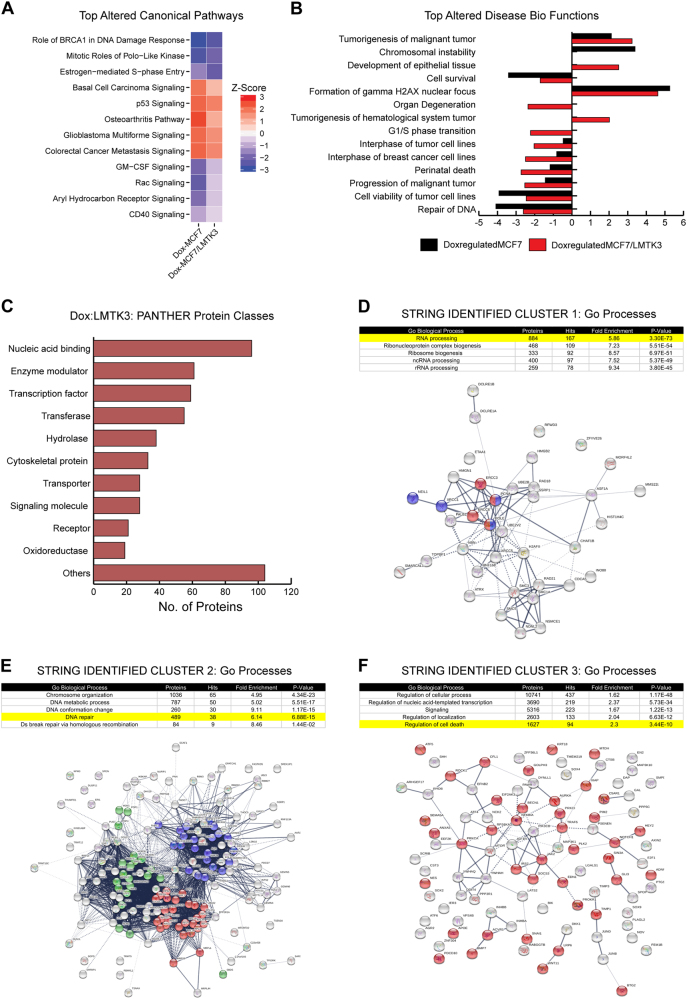
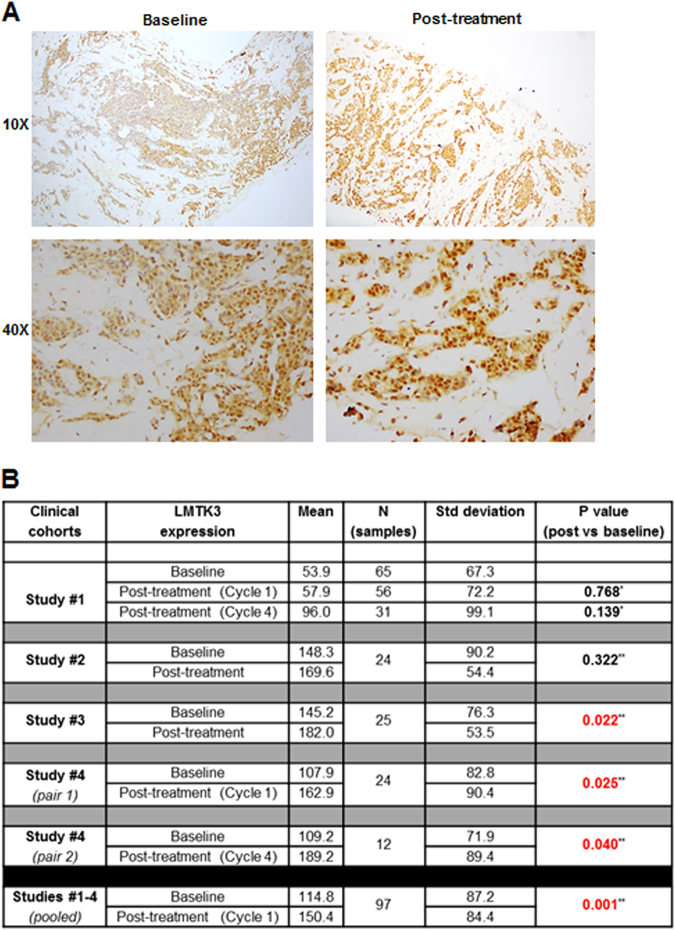
Lemur tyrosine kinase 3 (LMTK3) is an oncogenic kinase that is involved in different types of cancer (breast, lung, gastric, colorectal) and biological processes including proliferation, invasion, migration, chromatin remodeling as well as innate and acquired endocrine resistance. However, the role of LMTK3 in response to cytotoxic chemotherapy has not been investigated thus far. Using both 2D and 3D tissue culture models, we found that overexpression of LMTK3 decreased the sensitivity of breast cancer cell lines to cytotoxic (doxorubicin) treatment. In a mouse model we showed that ectopic overexpression of LMTK3 decreases the efficacy of doxorubicin in reducing tumor growth. Interestingly, breast cancer cells overexpressing LMTK3 delayed the generation of double strand breaks (DSBs) after exposure to doxorubicin, as measured by the formation of γH2AX foci. This effect was at least partly mediated by decreased activity of ataxia-telangiectasia mutated kinase (ATM) as indicated by its reduced phosphorylation levels. In addition, our RNA-seq analyses showed that doxorubicin differentially regulated the expression of over 700 genes depending on LMTK3 protein expression levels. Furthermore, these genes were found to promote DNA repair, cell viability and tumorigenesis processes / pathways in LMTK3-overexpressing MCF7 cells. In human cancers, immunohistochemistry staining of LMTK3 in pre- and post-chemotherapy breast tumor pairs from four separate clinical cohorts revealed a significant increase of LMTK3 following both doxorubicin and docetaxel based chemotherapy. In aggregate, our findings show for the first time a contribution of LMTK3 in cytotoxic drug resistance in breast cancer.


Conflict of interest statement

JS is Editor of Oncogene, GG is a Deputy Editor. This manuscript went through a standard external peer review process and neither were involved with this. The remaining authors declare that they have no conflict of interest.

Figures

Fig. 1
Fig. 1
Over-expression of LMTK3 impedes the effectiveness of doxorubicin in vitro and in vivo. Following treatment with different concentrations of doxorubicin (0.05, 0.1, and 0.2 μM) for 72 h, the percentage (%) of cell viability, was assessed by CellTiter-Glo assay in MCF7 and MCF7/LMTK3 cells cultured in either (a) 2D (monolayers) or (b) 3D (spheroids). All error bars represent the mean ± the standard deviation (SD) from three independent experiments. c Quantification in primary tumor size between MCF7 and MCF7/LMTK3 xenografts with or without doxorubicin treatment at Day 28. (Left) The means and the error bars show the standard error of the mean (SEM) for ten MCF7-LMTK3, nine MCF7-LMTK3+Dox, ten MCF7 and seven MCF7+Dox –derived xenografts. (Right) Data are displayed as individual data points together with their corresponding median values. d Representative images of tumors at Day 28 are shown for the different groups. (e) Histological analysis of LMTK3 and Ki67 expression in representative tumor tissue sections of MCF7 and MCF7/LMTK3 tumors (no doxorubicin treatment). Original magnification, 100×. Scale bars, 100 μm. (**P ≤ 0.01; ***P ≤ 0.001; ****P ≤ 0.0001)
Fig. 2
Fig. 2
Overexpression of LMTK3 delays doxorubicin-induced DNA DSBs and affects the phosphorylation of ATM. a MCF7 and MCF7/LMTK3 cells were treated with 0.4 µM of doxorubicin and 12, 24, and 48 h later, quantitative analysis of γH2AX foci was performed. All error bars represent the mean ± SEM (50 cells were analyzed per each time point; ****P ≤ 0.0001). b Western blot analysis for endogenous γH2AX levels in MCF7 and MCF7/LMTK3 cells following doxorubicin treatment for different time points. β-actin was used as loading control. c MCF7 and MCF7/LMTK3 cells were fixed and subjected to confocal immunofluorescence analysis. Representative confocal microscopy images for γH2AX and LMTK3 are shown for different time points. d MCF7 and MCF7-LMTK3 cells were treated with 1 µM of doxorubicin for up to 2 h. Following, the media was removed allowing cells to grow in fresh complete media for another 10 h. Quantitative analysis of γH2AX foci was performed. All error bars represent the mean ± SEM (50 cells were analysed per each time point; **P ≤ 0.01). e MCF7 and MCF7/LMTK3 cells were fixed and subjected to confocal immunofluorescence analysis. Representative confocal microscopy images for γH2AX are shown for different time points following doxorubicin release. f Doxorubicin-induced DNA damage measured by neutral comet assay. MCF7 and MCF7-LMTK3 cells were treated with 1 µM of doxorubicin for up to 2 h. Following, the media was removed allowing cells to grow in fresh complete media for another 6 and 24 h. Cells were analyzed by fluorescence microscopy; The tail moment was quantified using the ImageJ software with OpenComet plug-in. All error bars represent the mean ± SEM (51 cells were analysed per each time point; ***P ≤ 0.001; ****P ≤ 0.0001). A representative western blot of LMTK3 expression in MCF7 and MCF7/LMTK3 cell lines is shown. g MCF7 and MCF7-LMTK3 cells were treated with 1 µM of doxorubicin for 2, 4, 8, 16, and 24 h. Western blot analysis was performed using the respective antibodies. β-actin was used as loading control. Representative results and quantification of protein bands using ImageJ software are shown for two separate blots. h MCF7 and MCF7-LMTK3 cells were treated with 1 µM of doxorubicin for 15 min, 30 min, 1, 2, and 4 h. Western blot analysis was performed using the respective antibodies. β-actin was used as loading control. Representative results and quantification of protein bands using ImageJ software are shown for two separate blots
Fig. 3
Fig. 3
Global transcriptomic alterations induced by doxorubicin in MCF7 and MCF7/LMTK3 cells. a Venn diagram showing a high degree of overlap as well as differences in the transcripts significantly regulated by doxorubicin in MCF7 and MCF7/LMTK3 cells (Padj < 0.05 and Log2 fold difference of ≥|1|). b Venn diagram comparing numbers of transcripts significantly up (UP) or down-regulated (DW) in each dataset. c Heatmaps showing top-30 (ordered based on Padj value) exclusively regulated transcripts upon doxorubicin treatment of MCF7 and MCF7/LMTK3 cells. Downregulated transcripts (DW) are shown in the upper panel, while upregulated transcripts (UP) are shown in the lower panel. d Heatmap showing amounts by which the read counts of the top-30 (ordered based on Padj value) commonly regulated genes deviates from the gene’s average across all the samples. e Count plot comparing the changes in the RNA-seq read counts of HEY1 and SOX6 between MCF7 and MCF7/LMTK3 cells upon treatment with DMSO or 1 μM doxorubicin
Fig. 4
Fig. 4
Differences in doxorubicin induced global transcriptomic changes based on LMTK3 expression levels. a Volcano plot showing the Log2 fold change of genes that respond differently to the doxorubicin treatment in MCF7 and MCF7/LMTK3 cells (Dox:LMTK3). The Log10 of P value, for significance in fold change, is plotted on the y-axis. b Volcano plot showing the Log2 fold change of doxorubicin regulated genes in MCF7 cells. Genes are colored based on their mode of regulation. Genes identified to respond differently to doxorubicin treatment in MCF7 and MCF7/LMTK3 cells are colored red (Dox:LMTK3). In addition, genes regulated commonly by doxorubicin treatment in both cell lines are colored blue. Genes were colored grey if their fold change were not significantly different compared to DMSO. c Volcano plot showing the Log2 fold change of doxorubicin regulated genes in MCF7/LMTK3 cells. Genes are colored based on their mode of regulation as described above. Top Dox:LMTK3 genes (based on Log2 fold chage) are labelled on all the volcano plots. d Heatmap showing amounts by which the read counts of the top-30 Dox:LMTK3 genes (ordered based on Padj value) deviates from the gene’s average across all the samples. e The UpSet plot showing common and unique doxorubicin regulated genes significantly up (UP) or down-regulated (DW) in each dataset. The red lines indicate antagonistic regulation of same genes by doxorubicin across MCF7 and MCF7/LMTK3 cells. The blue lines indicate additive regulation of genes by doxorubicin across MCF7 and MCF7/LMTK3 cells
Fig. 5
Fig. 5
Functional analysis of doxorubicin-LMTK3 mediated differential gene expression. a Heatmaps comparing Z scores of canonical pathways significantly enriched for doxorubicin regulated genes identified from doxorubicin/DMSO treated MCF7 and MCF7/LMTK3 cells. The significant P-values were calculated by Fisher’s exact test. The activation or inhibition of the canonical pathways and disease bio functions is given by Z score. A Z score of ≥2 is considered as significant activation and a Z-value of ≤−2 is considered as significant inhibition. The Z score between (0, 2) or (−2, 0) represents trend towards activation or inhibition, respectively. b A bar graph comparing Z scores of disease biological functions enriched for doxorubicin regulated genes identified from doxorubicin/DMSO treated MCF7 and MCF7/LMTK3 cells. c Functional classification of Dox:LMTK3 genes identified using PANTHER classification system. d–f GO pathways analysis of the protein-protein interaction clusters identified in Dox:LMTK3 genes using fast-greedy algorithm provided with STRING database. The STRING network analysis was then performed on gene products involved in RNA processing (d: Cluster 1), DNA repair (e: Cluster 2), and regulation of cell death (f: Cluster 3). The blue, red and green color in STRING network of RNA processing represents proteins involved in splicesome, ribosome and ribosome biogenesis respectively. The red and blue color in STRING network of DNA repair represents proteins involved in Nucleotide Excision Repair and Base Excision Repair. The red color in STRING network of regulation of cell death represents proteins involved in downregulation of apoptotic pathways. For all the STRING networks, the strength of the black line indicates strength of the data support for a given protein-protein association
Fig. 6
Fig. 6
LMTK3 expression in pre and post-chemotherapy primary breast tumors. a Representative histological images of LMTK3 expression in matched pre- and post-chemotherapy biopsies (docetaxel and doxorubicin) of a breast cancer patient from study/cohort #3. b Scoring of nuclear LMTK3 expression levels in individual and pooled breast cancer cohorts receiving chemotherapy treatment

References

    1. Giamas G, Filipovic A, Jacob J, Messier W, Zhang H, Yang D, et al. Kinome screening for regulators of the estrogen receptor identifies LMTK3 as a new therapeutic target in breast cancer. Nat Med. 2011;17:715–9. doi: 10.1038/nm.2351. - DOI - PubMed
    1. Li Z, Wu J, Ji M, Shi L, Xu B, Jiang J, et al. Prognostic role of lemur tyrosine kinase 3 in postoperative gastric cancer. Mol Clin Oncol. 2014;2:756–60. doi: 10.3892/mco.2014.301. - DOI - PMC - PubMed
    1. Shi H, Li Q, Ji M, Wu J, Li Z, Zheng X, et al. Lemur tyrosine kinase-3 is a significant prognostic marker for patients with colorectal cancer. Int J Clin Exp Pathol. 2014;7:1101–7. - PMC - PubMed
    1. Shi H, Wu J, Ji M, Zhou Q, Li Z, Zheng X, et al. Serum lemur tyrosine kinase 3 expression in colorectal cancer patients predicts cancer progression and prognosis. Med Oncol. 2013;30:754. doi: 10.1007/s12032-013-0754-x. - DOI - PubMed
    1. Stebbing J, Filipovic A, Ellis IO, Green AR, D’Silva TR, Lenz HJ, et al. LMTK3 expression in breast cancer: association with tumor phenotype and clinical outcome. Breast Cancer Res Treat. 2012;132:537–44. doi: 10.1007/s10549-011-1622-z. - DOI - PubMed

Publication types

MeSH terms